
 ?Mathematical formulae have been encoded as MathML and are displayed in this HTML version using MathJax in order to improve their display. Uncheck the box to turn MathJax off. This feature requires Javascript. Click on a formula to zoom.
Abstract
Recent research on the forecasting of violence has mostly focused on predicting the presence or absence of conflict in a given location, while much less attention has been paid to predicting changes in violence. We organized a prediction competition to forecast changes in state-based violence both for the true future and for a test partition. We received contributions from 15 international teams. The models leverage new insight on the targeted problem, insisting on methodological advances, new data and features, and innovative frameworks which contribute to the research frontiers from various perspectives. This article introduces the competition, presents the main innovations fostered by the teams and discusses ways to further expand and improve upon this wisdom of the crowd. We show that an optimal modeling approach builds on a good number of the presented contributions and new evaluation metrics are needed to capture substantial models’ improvements and reward unique insights.
La investigación reciente sobre la previsión de la violencia se ha centrado principalmente en predecir la presencia o ausencia de conflictos en un determinado lugar, mientras que se ha prestado mucha menos atención a predecir los cambios en la violencia. Organizamos una competencia de predicción para predecir los cambios en la violencia estatal tanto para el futuro cierto como para una división del análisis. Recibimos aportes de quince equipos internacionales. Los modelos aprovechan las nuevas ideas sobre el problema específico insistiendo en los avances metodológicos, los nuevos datos y características, así como en los marcos innovadores que contribuyen a las fronteras de la investigación desde diversas perspectivas. Este artículo presenta la competencia y las principales innovaciones que los equipos fomentan, y analiza maneras de expandirse y mejorar aún más a partir de esta sabiduría del público. Mostramos que un enfoque de modelación óptimo se crea a partir de un buen número de aportes presentados y que se necesitan nuevas métricas de evaluación para capturar las mejoras considerables de los modelos y para premiar las ideas únicas.
Les recherches récentes sur la prévision de la violence se sont principalement concentrées sur la prédiction de la présence ou de l’absence de conflit dans un lieu donné, alors que beaucoup moins d’attention a été accordée à la prédiction des évolutions de la violence. Nous avons organisé un concours de prédictions dont l’objectif était de prévoir les évolutions de la violence étatique à la fois pour le futur réel et pour une partition test. Nous avons reçu des contributions de 15 équipes internationales. Les modèles concernés tirent profit de nouveaux renseignements sur le problème ciblé en insistant sur les progrès méthodologiques, sur de nouvelles données et caractéristiques et sur des cadres innovants contribuant à élargir les frontières des recherches de divers points de vue. Cet article présente le concours et les principales innovations proposées par les équipes et aborde les moyens d’étendre et d’améliorer cette sagesse de la foule. Nous montrons qu’une approche optimale de la modélisation repose sur bon nombre des contributions présentées et que de nouvelles métriques d’évaluation sont nécessaires pour saisir les améliorations substantielles des modèles et récompenser les idées uniques.
Motivation
The use of flexible model representations and out-of-sample validation of predictive performance have become staples of research on conflict and violence over the last 5 years. This research tradition has taken up a challenge identified by Ward, Greenhill, and Bakke (Citation2010). They provided convincing evidence that decades of quantitative studies built solely upon in-sample testing of relatively simple functional forms failed to substantively improve predictions of armed conflict relative to a simple bivariate model. Interdisciplinary teams have leveraged innovations in machine learning and data collection (Sundberg and Melander Citation2013; Raleigh et al. Citation2010; Witmer et al. Citation2017; Hegre et al. Citation2019) at higher temporal and spatial resolutions to achieve meaningful progress in the production of policy relevant predictions of conflict processes.
However, much of this current progress has focused on predicting the presence or absence of conflict in a given location and not on the qualitative changes in escalation and de-escalation of violence. The emphasis on conflict occurrence has illuminated that a high probability of conflict re-occurrence is one important generalizable pattern (Collier, Hoeffler, and Söderbom Citation2008; Hegre et al. Citation2021). Therefore prediction systems have produced useful models of “incidence” of conflict that leverages signals from conflict history, seasonality, and local conflict contagion.Footnote1
One of the unsolved problems with current systems is that they tend to be surprised by changes in observed fatalities, both when violence escalates dramatically or when it disappears partly or completely (Hegre et al. Citation2021; Mueller and Rauh Citation2019). These new or disparate conflict events, or spells of peace, are of pre-eminent importance to policy-makers and conflict researchers. If conflict tends to re-occur, then understanding where violence and fatalities are going to rise or dissipate carries multiplicative relevance. Thus, for prediction systems to live up to their potential policy and scientific relevance, we need to accelerate innovation in predicting these unexpected changes in violence and fatalities.
In order to facilitate progress on this open set of issues, the ViEWS team organized a prediction competition, centered around forecasting changes in state-based violence.Footnote2 We called for contributions in March 2020 with a deadline of September 30 the same year, requesting forecasts for the future—October 2020 through March 2021—as well as forecasts for a test set using historical data. This article introduces the competition and the contributions, and Vesco et al. (Citation2022) compares and evaluates the models.
In organizing the competition we had several related goals. First, we aimed to spur innovation by coherently focusing a group of talented researchers’ attention on the problem of forecasting change in fatalities in a given spatial and time domains. The restricted problem formulation was designed to counter the tendency for researchers to each infer evidence on disparate or only partially overlapping data sets and measures as much as moving beyond the conventional presence-or-absence definition of conflict. When inviting contributions, we asked for innovation in terms of new algorithms, features, and model specifications, as well as contributions in terms of model criticism and potential to improve our understanding of conflict processes.
To achieve this focus, we set out a specific, common list of prediction tasks for all participants, and a selection of evaluation metrics to assess the contributions. Our goal is not to simply replace measurements of conflict occurrence accuracy and related scores with analogous metrics for change, but to broaden the credit and rewards that models and teams are given for innovating in new areas. In particular we aim to incentivize innovative approaches to these problems (Colaresi and Mahmood Citation2017), since the state-of-the-art is what has so far led to the conflict-escalation lacuna. We follow the logic of machine-learning inspired research designs, where the functional form linking signals/features of the world to a target of interest, here changes in fatalities, is not yet known. Therefore, we provided teams with the data and tools to not only build new models, but critique and potentially iteratively improve them moving forward (Blei Citation2014).
Second, we are interested in how best to combine diverse models and leverage the wisdom of the crowd effect across our collective insights. It is well known that a collection of models, each containing unique insights into a complicated process, can potentially boost a system’s performance over and above even the most performant individual model (Page Citation2007; Hong and Page Citation2001, Hong and Page Citation2004). As such, we sought to recruit and open the competition to diverse teams and lower the barriers to entry, hoping to draw the collective attention of talented groups that were working on different facets of violence and conflict.
Because we value diverse approaches to this unsolved problem, we explicitly wanted groups to be rewarded for innovating across distinct dimensions. For example, the success of the competition relies upon participation being open not only to researchers working on new modeling approaches from network science, Bayesian inference and machine learning, but also teams that have been working to create new features and input data that might be useful in predicting changes. Likewise, we aimed to include teams working with both structured (previously collected data) and unstructured information (e.g., text) to apply their talents. In designing our suite of performance metrics, our complementary goal was to measure a team’s contribution, not only individually, but also in terms of how it could add to an ensemble of models. Therefore, potential participants would know that they did not necessarily have to devise the model that scored the most points, but would be rewarded for sharing unique contributions on the data generation process that generalized out of sample, analogous to playing good defense or making great passes to teammates. This implies a trade-off between standardization and innovation: the competition should be flexible enough to elicit diverse contributions and improvements along a wide range of aspects—from innovation in modeling algorithms to inclusion of new data and improved sets of predictors—but uniform enough to guarantee the comparability across models’ results. For example, a competition that preselected the feature space would have increased the comparability across algorithms, at the expense of incentivizing theoretical and data-driven innovations. In this competition, we opted for giving participants greater freedom in a way that could boost improvements in predictions on a wide spectrum. The comparability of models were however guaranteed by different elements: (i) the reliance on the common, standardized infrastructure provided by the ViEWS system; (ii) the common set of metrics utilized for the evaluation, (iii) the use of standard data on fatalities as the ground truth against which to compare the forecasts, and (iv) the setup of a common scoring committee to assess the models on both qualitative and quantitative metrics.
Third, we wanted to begin building the infrastructure and knowledge to run competitions like these in the future. We strongly believe that prediction and measuring generalization performance on unseen data are valuable steps in scientific learning. Both the mistakes that individual models make, as well as which individual future observations are more usefully predicted by which perspective, provide valuable pointers toward new theoretical insights (Colaresi and Mahmood Citation2017). Since competitions such as ours have been successful in other domains (Carpenter Citation2011), we believe creating the infrastructure and experience within the conflict processes community will complement the intellectual exchange in traditional conferences and workshops. Specifically, we hope that prediction competitions such as ours will uniquely provide a more tightly coupled dialogue, where each team’s specific expertise and perspectives exploring different facets of the conflict processes domain will be coherently focused on specific, unsolved problems, such as conflict escalation and de-escalation in the case presented in this special issue.
The Structure of the Competition
The participants to the ViEWS prediction competition were asked to generate forecasts for at least one of the two levels of analysis: country-months (abbreviated as cm in ViEWS) and subnational location-months (priogrid-months, pgm). The set of countries is defined by the Gleditsch-Ward country code (Gleditsch and Ward Citation1999, with later updates), and the geographical extent of countries by the latest version of CShapes (Weidmann, Kuse, and Gleditsch Citation2010). For the subnational forecasts, ViEWS relies on PRIO-GRID (version 2.0; Tollefsen, Strand, and Buhaug Citation2012), a standardized spatial grid structure consisting of quadratic grid cells that jointly cover all areas of the world at a resolution of 0.5 × 0.5 decimal degrees, corresponding to approximately 55 × 55 km near the equator. This resolution matches the estimated precision level of the outcome data (Weidmann Citation2015). Predicting conflicts at this level of analysis also remedies some of the challenges involved in coarser subnational and politically characterized units. Political subunits such as Admin2 regions are prone to similar issues to those affecting country-level studies: the shape and borders of administrative subunits change over time and their definition and function may vary substantially between countries. While these challenges have been known for country-level analyses, the magnitude of the problem is even more substantial for the subnational level (Tollefsen, Strand, and Buhaug Citation2012).
Prediction Target
We provided participants with targets of prediction, which can be thought of as dependent variables, at the different spatial extents, to utilize for training their entries. In ViEWS, violent episodes are defined as conflict events if they lead to at least one battle-related death (BRD) per month at the cm or the disaggregated pgm level.Footnote3 Conflict data are obtained from UCDP-GED and aggregated to the two units of analysis used in ViEWS (Sundberg and Melander Citation2013). Historical data covering 1989–2019 are extracted from the UCDP-GED version 20.1 (Pettersson and Öberg Citation2020; Sundberg and Melander Citation2013).Footnote4 Newer data are provided by the new UCDP-Candidate data set which is updated monthly (see Hegre et al. Citation2020, for an introduction). This allows use of conflict events up to 1 month before the forecasting window. In the competition, the focus is restricted to state-based conflict, as defined by the Uppsala Conflict Data Program (UCDP) (https://www.pcr.uu.se/research/ucdp/definitions/).
While numerous studies exist that predict violence as a dichotomous target (e.g., Goldstone et al. Citation2010; Hegre et al. Citation2013; Cederman and Weidmann Citation2017; Hegre et al. Citation2017; Witmer et al. Citation2017), the humanitarian impact of conflict is to a large degree proportional to its intensity. Although recent research has proposed models for prediction targets such as counts of number of events or the number of fatalities (for instance, Brandt, Schrodt, and Freeman Citation2014; Scharpf et al. Citation2014; Bagozzi Citation2015; Witmer et al. Citation2017; Johnson et al. Citation2018), solutions remain sparse. The goal of the competition was to improve predictions of violence (de-)escalation, going beyond the usual forecasts of the presence of conflict.
Accordingly, participants were asked to predict substantial change in the count of the number of fatalities per month from state-based conflict, for all grid cells (at the pgm level) or all countries (at the cm level) on the African continent. More precisely, the outcome to be predicted is
(1)
(1)
where
is the number of BRDs aggregated to the ViEWS units of analysis (which define the relevant i index). By log-transforming the number of fatalities, we can forecast multiplicative change—a change from 100 to 270 fatalities is seen as commensurate to one from 1,000 deaths to 2,700. Adding 1 to each Yit term implies that a change from 0 to 1 fatalities is recorded as a change of
Footnote5
then, is the change in the log number of deaths (plus 1) from
to t months, for unit i. A step
is the number of months forward to forecast. The outcome
is defined for each month, or time-step s. We use the difference operator, Δs, to denote both change and the step length. For example,
is the change in logged (plus 1) fatalities 2 months in the future relative to the last month of data defined as being available at time t − 2. Since conflict history data become available with a 1-month lag, the unseen future from the time perspective of a research team starts at s = 2. To systematize the information involved in rolling s forward in time, we denote s = 2 as October 2020 for the absolute periodization.
This operationalization of the outcome variable not only allows for a more comprehensive assessment of conflict trends and dynamics but also lays the ground for evaluations of conflict impacts.
Data Partitioning and Step Training
The main challenge for participants was to provide predictions for the true future at the time of the deadline—October 2020 to March 2021, based on data up to and including August 2020.
However, armed conflict is (fortunately) not that frequent, and these 6 months of forecasts will comprise a relatively sparse data set to evaluate. To assess the contributions also against a more comprehensive set of actual conflict observations, we asked participants to provide six sets of test forecasts for each of the 36 months in the test partition (January 2017 through December 2019), for six consecutive steps forward based on data up to 1 month before the forecasting window. Participants could chose to submit separate forecasts for each of the steps ahead in both tasks, or specify how to interpolate or extrapolate from fewer forecasted time-steps. These forecasts are evaluated in Vesco et al. (Citation2022) in this issue.
The data-partitioning scheme that guided these two forecasting tasks is defined in , splitting data temporally into train, calibration, and test partitions. Participants to the competition may train and tune models using all observations in the training and calibration partitions (1990–2019/2014–2016) to produce forecasts for the test set (2017–2019), which are held out for true out-of-sample evaluation.
Table 1. Partitioning of data for estimating model weights, hyperparameter tuning, evaluation, and forecasting.
ViEWS relies on a step-shifting process to optimize the available data for training and calibration (Hegre et al. Citation2021). Predictions presented by each team need to be consistent with this setup, although the forecasting window is shorter.
The ViEWS time-shifting process maximizes the data available for training and calibration (Hegre et al. Citation2021) since it allows comparing forecasts for a given step s for all the 36 months in the test period. This means that the data available for training and calibration changes according to the s-step that the model targets. For example, when producing forecasts for January 2017 for step s = 2, contributors are allowed to use data up to November 2016 for their training and calibration. When forecasting for February 2017, they could include data from December 2016 to their training/calibration. When they forecast for January 2017 and s = 6, they could use data up to July 2016, and so on. This shifting process ensures that we maximize the data available without causing any data leakage.Footnote6
When generating true forecasts, however, this shifting process is much simplified, as forecasts can only be based on the most recent input data—August 2020, the last release of the UCDP-Candidate data at the time of the deadline for the contributors. Therefore, when predicting for March 2021, participants can only forecast for s = 7, or based on 7 months before the target month.
Scoring Entries
The forecasting target was designed to attract attention to the problem of predicting changes in violence. To support the evaluation of the attempts to target an outcome in terms of change in fatalities, we also included some new performance metrics that can account for the direction of momentum and reward novel insights.
Our set of metrics includes the Mean Squared Error (MSE), the Targeted Absolute Distance with Direction Augmentation (TADDA), the Model Ablation Loss (MAL), and the pseudo-Earth Mover Divergence (pEMDiv). MSE is a standard metric for continuous outcomes. When inviting participants to the competition, we noted that MSE would be the main metric, and many participants optimized with respect to that. Since it is in common use and can be computed easily, it contributed to attract the participation of a broad and diverse audience, mapping the road for recurrent competitions in conflict research. In Vesco et al. (Citation2022), we propose TADDA as a new metric specifically tailored to evaluate predictions of changes in fatalities, as it accounts for both the sign and the magnitude of the predictions versus the actual change. TADDA has potential to be applied to all research domains germane to escalation and de-escalation. MAL aims at rewarding models’ contributions to the “wisdom of the crowd.” It is obtained by observing how each model contributes to an unweighted ensemble of the predictions, and thus measures the model’s unique contribution to the predictive performance of an ensemble. pEMDiv (Greene et al. Citation2019) is a network-based, context-sensitive performance metric for the pgm level which takes the spatio-temporal distribution of predictions into account, rewards models that produce good but imperfect temporal and spatial approximations even when they fail to hit the target exactly, and is especially useful for evaluating predictions across space and time. An extensive illustration of the entire set of evaluation metrics is presented in the comparison article in this special issue (Vesco et al. Citation2022).
It is our firm conviction that forecasting models for a complex phenomenon like armed conflict escalation must be evaluated using multiple metrics. Weighing the various dimensions of performance is a challenging task. To do this, we have been greatly assisted by the scoring committee set down for the competition. The highly qualified members of the committee, Nils Weidmann, Adeline Lo, and Gregor Reisch, are all unrelated to ViEWS and the participants.
The Benchmark Models
The teams’ predictions are primarily compared against each other, but also against benchmark models set up by the ViEWS team. The benchmark models were distributed to the teams and were used by several of them as points of departure for their own models. We trained two sets of random forest regression models, one for each level of analysis.Footnote7 Benchmark models at the cm level were trained on global data, pgm models on data for Africa only.Footnote8 Since the task is to predict the logged change in fatalities in the African continent only, we subset the predictions from the cm models accordingly. To reduce computational load, when training the pgm benchmark models, we asymmetrically downsampled the data to keep only one percent of observations with no change in fatalities.Footnote9
The cm models were trained using more than 400 features available in the ViEWS database. The pgm models were trained on 40 features found to be important for the ViEWS models classifying into conflict or no conflict dichotomously. Data in the benchmark models were primarily sourced from the UCDP (Pettersson and Öberg Citation2020), World Development Indicators (WorldBank Citation2019), Varieties of Democracy (Coppedge et al. Citation2020), REIGN (Bell Citation2016), ACLED (Raleigh et al. Citation2010), and PRIO-GRID (Tollefsen, Strand, and Buhaug Citation2012). A selection of the features and their associated impurity-based importances are listed in Supplementary Tables A-1 and A-2.Footnote10
The benchmark predictions at the pgm level were calibrated to ensure that their means and standard deviations closely approximated the means and standard deviations of the actual observed values in the calibration data, for each step. To accomplish this, we computed the mean and standard deviation of as defined in EquationEquation (1)
(1)
(1) for the actuals and benchmark model predictions for the calibration partition. From these, we computed the calibration parameters, using the difference in means and the ratio of the standard deviations, respectively, to shift and rescale the benchmark predictions for the test partition.
We complemented the benchmark models with “no-change models” predicting zero change uniformly across the forecasting window, for each level of analysis. Footnote11 As MSE scores are heavily affected by the zero inflation and the mean value of the outcome being close to zero, these models are especially relevant when evaluating the MSE scores of the contributions.
and present the MSE and TADDA scores for the benchmark model at cm and pgm for the 2017–2019 period. For cm, average MSE across steps is 0.747, while for pgm average MSE is much lower (0.049) due to the higher number of zeros in the true observations. Similarly, TADDA is higher at cm (0.527) than at pgm (0.146). The values of these metrics have no intrinsic meaning, being dependent on class imbalance and other factors, such as the irreducible error in the process, but provide a point of comparison for all of the entries. Almost all models presented by participants scored better than the benchmark models for most of the metrics. The benchmark scores do not exhibit any clear trend over the forecasting horizon, although MSE for s = 7 tends to be among the highest.Footnote12
Table 2. Evaluation scores for the benchmark and no-change models by step, cm.
Table 3. Evaluation scores for the benchmark and no-change models by step, pgm.
Contributions
The structure of our competition would be of little use if we could not attract a heterogeneous crowd of experts to provide unique insights. To incentivize contributions from differentiated teams, we (i) announced the competition via a public, international call without any eligibility prerequirements to participate; (ii) extended personalized invitations to participate to members of the international conflict research community; (iii) lowered the barriers to entry by providing participants with an infrastructure to access ViEWS data and tools (OpenViEWS2 Citation2020); and (iv) announced our intention to reward contributions across multiple dimensions, taking into account various evaluation metrics, as well as the qualitative and quantitative assessment by a scoring committee of experts.
Despite the significant complications from COVID-19, we were successful in drawing together an impressive group of participants. We received 17 contributions from 15 teams by the deadline of September 30, 2020. Nine of these were at the country-month (cm) level, eight at the PRIO-GRID (pgm) level. Two teams (D’Orazio and Lin, Chadefaux) submitted predictions for both levels.Footnote13
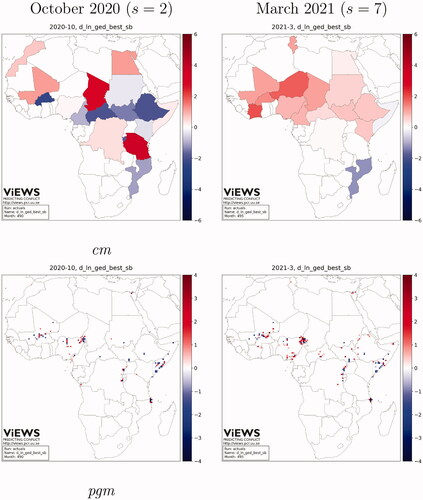
To illustrate the nuances between and common patterns among the different models, and map the predicted change in fatalities from August 2020 to March 2021 for each model, at the cm and the pgm levels. The observed changes in fatalities are presented in for October 2020 (s = 2) and March 2021 (s = 7). The figures reveal some prominent fluctuations in fatalities that have notable repercussions in the models’ evaluation for the true future (see [Vesco et al. Citation2022] for an evaluation of the models). February 2021 (s = 4) saw an abrupt escalation of violence in the Tigray region, as well as an upsurge in fatalities in Mali, where the government remains challenged by the pro-al-Qaida alliance JNIM. December 2020 shows a widespread increase in fatalities, mainly driven by the escalation of tensions in the Central African Republic over former President Bozizé’s presidential candidacy, the violence pitting the Nigerian government against the jihadist group Boko Haram in the northwestern Zamfara, Katsina, Kaduna and the north-east states of Borno and Adamawa, as well as a generalized increase in fatalities at the border between Ethiopia and Sudan when Khartoum reclaimed control over some territories.
Figure 1. Maps of predicted change from September 2020 through March 2021, cm.
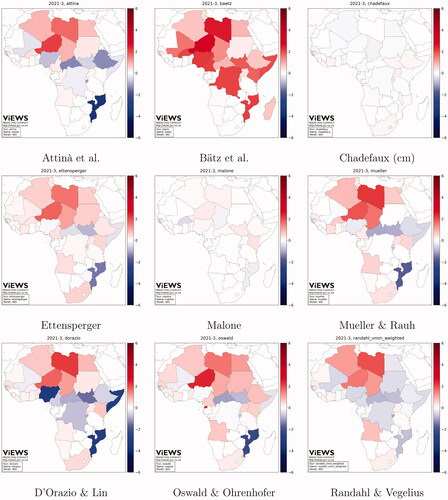
Figure 2. Maps of predicted change from September 2020 through March 2021, pgm.
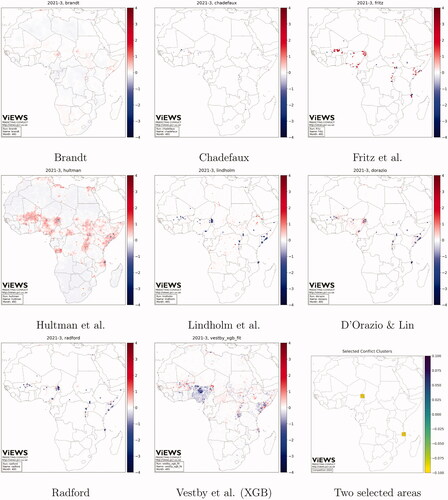
Figure 3. Maps of observed change in fatalities from September 2020 to October 2020 (left), and March 2021 (right), cm (top), and pgm (bottom).
It is immediately apparent that the models are not all encoding the same pattern—correlations between the contributions at the cm are as low as 0.5, with some as high as 0.9. The diversity is more dramatic at the pgm level, with correlations between the model predictions mostly below 0.5.
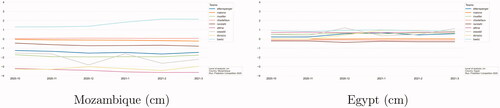
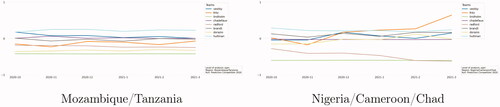
There is also overlap in the predictions of multiple models. At the country-level (), most models forecast escalation in Algeria and Libya, and de-escalation in Central African Republic and Mozambique. The predictions for other contexts diverge. The models disagree on whether violence will escalate in Egypt and Ethiopia, over the October 2020–March 2021 period. In , we show the predicted change in fatalities over time for each model, for Mozambique and Egypt.
Figure 4. Predicted change from September 2020 through March 2021, for selected countries.
At the pgm level (), differences are even stronger across the contributions. Vestby et al.’s model suggests violence will de-escalate in most of Nigeria, although their confidence in the ability of the model to separate between escalation and de-escalation is limited. Hultman, Leis, and Nilsson and D’Orazio and Lin (Citation2022) predict escalation.
plots the forecasted changes over time averaged over two groups of 25 priogrid cells (see lower right map in ). In contrast to the country-level forecasts, the pgm models provide distinct forecasts for regions where violence may be more likely to increase. In the coastal region between Tanzania and Mozambique, Hultman, Leis, and Nilsson suggest an escalation, whereas Lindholm et al. project a strong de-escalation. In the area straddling the borders of Nigeria, Cameroon, and Chad, Fritz et al. (Citation2022) suggest a more intense escalation than the others, and Lindholm et al. again forecast a decline in fatalities.
Figure 5. Predicted change from September 2020 through March 2021, for selected groups of grid cells (bottom).
As we will detail below and is apparent in the individual articles in this special issue, the differences in these forecasts may arise from novel insights and approaches. The groups developed new algorithms and methods for this setting; introduced new features and data; and creative specifications and combinations of strategies.Footnote14
An Ensemble of the Contributed Forecasts
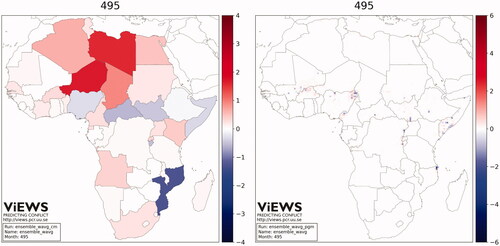
Variance in the forecasts across participants is a necessary, but not sufficient condition to produce new collective insights. We want to know whether the groups of models, when weaved together, can help us better generalize to new cases more effectively than any single model—in short, whether the competition has generated wisdom in our crowd of models. For definitive evidence on this we must await new data from the future. However, right now we can calculate an ensemble forecast from the contributors for this future set (October 2020–March 2021). We obtain ensemble predictions by weighting and averaging all of model predictions at the cm and pgm levels of analysis, respectively, for each step ahead. Specifically, we chose the inverted MSEs as weights, so that more accurate models have a greater influence on the ensemble prediction values. To be clear, the models are fit on the training data. Then, these model objects are used to forecast values for the unseen future set. The weights are assigned based on MSE scores for the test partition (2017–2019) so that distinct data partitions are used for training, weight estimates, and eventually evaluation.
presents the maps of forecasted changes in fatalities from August 2020 up to March 2021, according to the weighted ensemble of contributed models.Footnote15 The ensemble consistently predicts a strong increase in fatalities in Libya, Chad, and Niger and in Egypt and Algeria to a lesser extent. A moderate increase is also predicted in Kenya, Uganda, and Angola. Conversely, the ensemble forecasts a decrease in violence in Mozambique, Nigeria, CAR, South Sudan, Ethiopia, and Somalia. Predictions at the pgm level reveal interesting patterns of localized violence. Conflicts seem to decrease in intensity in some locations, but simultaneously spread in the neighboring regions. For example, the model forecasts a migration of violence from the central region across the border of Nigeria, Chad, and Niger to the surrounding locations. Violence is similarly predicted to move across areas in Mali. Somalia shows a more mixed trend, where various de-escalation spots are forecasted nearby generalized settings of expected escalation. Similar contexts are the Anglophone region of Cameroon, the border between DRC and Uganda, and at the very north of Mozambique, all characterized by a predicted steep decrease in violence in localized areas, surrounded by increasingly violent neighborhoods.
Figure 6. Maps of predicted change from August 2020 through March 2021, weighted ensemble of the contributions, cm (left), and pgm (right).
Summarizing the Innovations across Contributions
The main methodological innovations introduced by the participants are the development of new algorithms to account for spatio-temporal dependencies; the use of textual information extracted from the news and internet queries; and the use of ensembling techniques to enhance predictive performance.
New algorithms
Many participants attempted to improve the representations of spatio-temporal dependencies characterizing conflict patterns. Common choices to address these dependencies were recent advancements in Recurrent Neural Network (RNN) models, and Long–Short Term Memory (LSTM) versions in particular, as well as Markov models.
While neural-network model architectures are beginning to be used more frequently in conflict prediction, this representation may be unfamiliar to many in the conflict processes community. Perhaps the best intuition for these neural-network methods is to think of fitting, in sequence, first multiple lines/cutting planes across feature values, and then defining regions based on whether points fall above or below sets of these boundaries. If there is simply one sequence of multiple cutting planes and inequalities, fit with gradient descent or back-propagation of errors, we have the Multilayer Perceptron algorithm. Deep learning extends this sequence where the regions themselves become features in the next iteration, and new weights/boundaries are defined based on these regions/abstractions. There are different functions that can be used to weight and aggregate (and disaggregate) across these sequences. However, it is this nested, sequential quality that allows multilayer neural-network representations, for example, to learn to represent pixels as wheels in an intermediate step toward predicting whether an image contains a car or not.
Models that rely on neural-network and complex machine-learning approaches, like those presented by Malone (Citation2022), Radford, Brandt et al. (Citation2022), and Chadefaux, have a comparative advantage over simpler models in capturing the dynamics of conflicts and are especially good in predicting changes in fatalities in countries and grid cells where conflicts are ongoing. As they heavily rely on the endogenous information contained by the conflict variables, however, they are less suitable to predict if violence erupts in previously peaceful locations. Models that build on fast-changing features and signals of rising tensions such as those presented by Mueller and Rauh (Citation2022), and Oswald and Ohrenhofer are better equipped to predict new conflict outbreaks. Relatedly, complex algorithms that preponderantly build on the latent information contained in the outcome tend to predict a decrease in fatalities (rather than a null change) in peaceful settings.
Malone (Citation2022) (cm) develops an LSTM approach to remedy some of the shortcomings of RNNs. LSTM weighs the relative influence of historical trends through a series of input, forget, and output “gates,” which control the flow of information across a memory unit (Hochreiter and Schmidhuber Citation1997). The results show that the model’s error rate grows along the forecasting window, but more slowly than the benchmark model. Malone’s model tends to forecast conflict much better for countries that have a strong legacy of conflict—such as DRC, Mozambique, or Angola () —while it performs more poorly in countries where conflict emerges suddenly, consistent with the LSTM representation learning the uneven gaps between spikes in escalation, but not providing new leverage on any initial escalations or violence spikes that are too distant from each other in time or space.
Radford (Citation2022) (pgm) utilizes a neural network that parameterizes the spatial and temporal lag structure, allowing the algorithms to learn these lags on a per-feature basis. By dealing with data at the pgm level as sequential frames, the model learns spatial patterns and allows for higher flexibility with respect to spatial dependencies. These results suggest that if there exist nonzero casualties at the initial time-step, the model generally predicts a decrease in casualties in the following steps. However, when the observed value is zero or greater, the model tends to predict no change. These flexible nonlinear dynamics over space and time are one of the unique contributions of this entry.
Brandt et al. (Citation2022) (pgm) use spatio-temporal graph convolutional neural networks (ST-GCN), which are highly flexible and can account for spatial and temporal dependencies. Similarly to Radford’s, Brandt’s model has a tendency to predict slight negative changes in locations where there is no ongoing conflict () but this might also depend on the calibration strategy, rather than the model’s representation.
Chadefaux (Citation2022) (cm/pgm) uses machine-learning methods derived from pattern recognition in time series, and presents a model that applies clustering and prototyping to extract shapes. His algorithm is trained on entire sequences of events as units of analysis rather than single observations, enabling the model to extract potentially complex motifs and nonlinear patterns of violence. The results show that the MSE for the “Dynamic Time Warping” model significantly improves upon both the benchmark and the no-change models. Similarly to Malone’s, the model presented by Chadefaux exhibits a limited variance in the distribution of predictions: both models’ predictions span a more limited range and have less extreme under and over-predictions than the other models, as visible in Figure 11 in Vesco et al. (Citation2022).
Other approaches have also been proposed to capture spatial or temporal dependencies. Fritz et al. (Citation2022) introduce a hierarchical hurdle regression model to predict the change in fatalities at the pgm level. Their theoretically based algorithm models the intensity of conflict at a specific point in time as a three-stage process, where stages one and two estimate whether they will observe any casualties at the country- and grid cell-level, respectively, while stage three applies a regression model for truncated data to predict the number of such fatalities conditional upon the previous two stages. In a different approach, D’Orazio and Lin (Citation2022) (cm/pgm) explore models trained exclusively on grid cells that experienced conflict in the training set and fix the predictions for these at 0 for the test set. However, they do not conclude these “hurdle models” are better than the alternatives.
Markov models, especially hidden ones (HMM), were another popular choice to capture spatio-temporal patterns. In hidden Markov models, the target system is assumed to be a Markov process (Karlin Citation2014). The density function of the dependent variable is viewed as a combination of latent states with proportions determined by the likelihood that the observation was produced by the respective states. For example, Randahl and Vegelius (Citation2022) (cm) use two ensembles of visible and hidden Markov models, weighted through a genetic algorithm that optimizes the fit on the TADDA score.
Similarly, Lindholm et al. (Citation2022) (pgm) introduce a hidden Markov model which can be thought of as a discrete state-space model having two latent continuous states, where each PRIO-GRID cell is modeled as having two states that evolve over time. These states encode an “onset risk” and “potential severity,” respectively. Using sequential Monte Carlo simulations, they obtain a predictive distribution by computing the probability distribution for a death count at time t conditional on all data observed up until time t − s. The model by by Lindholm et al. performs less well than the one presented by Randahl and Vegelius for the test set, suggesting that the ensembling technique utilized by the latter is particularly useful in increasing performance. The evaluation of the models for the true future (presented in Vesco et al. [Citation2022]) also revealed that the model by Lindholm et al. was underfitting for the test partition and performed well for the true future set.
Another algorithmic innovation focuses on the methodology for usefully extracting features from news sources. Building on previous work (Mueller and Rauh Citation2019), Mueller and Rauh (Citation2022) (cm) combine unsupervised with supervised machine learning, using a Latent Dirichlet Allocation (LDA) model for extracting features from newspaper articles. The output of the forecast model is analyzed in a framework of cost minimization, in which policy costs due to false positives can be traded off against the damages caused by conflict. The models suggest that news can provide useful forecasts even when evaluated in a cost–benefit framework.
Attinà, Carammia, and Iacus (Citation2022) (cm) couple a new algorithm with additional features, presenting an Adaptive Elastic Net (Ada-ENet) model in combination with real-time event data. Elastic Net representations allow a modeler to utilize a weighted combination of L1 (Manhattan distance) and L2 (euclidean distance) regularization penalties, as opposed to choosing one or the other arbitrarily. Vestby et al. (Citation2022) (pgm) use another adaptive algorithm that is based on boosting. In boosting, weak-learners, such as stub-like decision trees, are used to iteratively identify and weight-more-heavily the difficult cases to correctly classify in the training step. Vestby et al.’s contribution specifically opts for an extreme gradient boosting model (XGB) that introduces regularization and is more readily parallelizable than other boosting approaches that must be computed in sequence. Similarly, Ettensperger’s ensemble combines forecasts generated from XGB and Random Forest to improve predictive accuracy.
Other contributions innovate rules to select among multiple candidate models and aggregate the predictions into an ensemble prediction. D’Orazio and Lin (Citation2022) (cm/pgm) exploit three autoML algorithms to span a large number of model specifications. The results show that the models perform better for pgm, while at cm the results are mixed. Among the three, the H2O solver performs best, and is least prone to overfitting. Randahl and Vegelius combine 15 different visible and hidden Markov models into an ensemble prediction, while Ettensperger (Citation2022) integrates models trained on different sets of features and spatial coverage, and with different algorithms (Extreme Gradient Boosting and Random Forests) in a simple average ensemble. Both find that the ensembles outperform single models.
New features
Other contributions invested in integrating innovative sets of features from new data sets to produce improved predictions.
Hultman, Leis, and Nilsson (Citation2022) (pgm) leverage new subnational data on all UN peacekeeping deployments in Africa (1994–2020) from the new Geocoded Peacekeeping (Geo-PKO) data set (Cil et al. Citation2020). Their model adds unique information on the size of peacekeeping units and number of peacekeepers in the vicinity, complementing the traditional focus on drivers of conflict escalation with new insight on what fosters de-escalation.
Fritz et al. (Citation2022) (pgm) focus on the role of governmental arms imports as an indicator of both intensifying fighting and deterrence of challenges. As spatial distance may have logistical implications on the ability of the central forces to deploy conventional weapons, they allow the local effect of arms imports on conflict intensity to vary depending on a location’s distance from the capital.
The models in Bätz, Klöckner, and Schneider (Citation2022) (cm) include direct and indirect proxies for a weakening status quo in the context of a bargaining model. Their algorithms progressively include additional predictors on top of a baseline model. Novel information used to predict changes in conflict intensity regards data on political leaders, actual and anticipated elections, as well as measures of deaths caused by COVID-19, caseloads, and hospital beds on a per capita basis. Their results show that the addition of socioeconomic and political variables reduces the prediction error and adds explained variance.
Vestby et al. (Citation2022) (pgm) explore the predictive potential of an extensive set of variables included in PRIOGRID v.3, extending the features available in the previous version of PRIOGRID (Tollefsen, Strand, and Buhaug Citation2012). This data collection has global coverage of all predictors from 1995 to 2019 and, among others, includes information on geographic and climatic characteristics, demographics, socio-economic factors, political and institutional settings, and information on elections.
Brandt et al. (Citation2022) (pgm) add monthly ICEWS event data (Boschee et al. Citation2018) for the last 20 years. They use CAMEO event counts and rely on the flexibility of their modeling technique to capture the linkages between civil conflict and ICEWS events. The results show these data sometimes improve performance, but sometimes decrease performance, depending on the choice of the evaluation metric.
Attinà, Carammia, and Iacus (Citation2022) also integrate event data from the Global Database of Events, Language, and Tone project (GDELT Citation2020), a repository of geolocated events coded from the world’s broadcast, print and web media. GDELT includes data on the instability potential of each event, as well as a continuous measure of actions’ intensity, ranging from cooperative to violent.
Oswald and Ohrenhofer (Citation2022) (cm) build on the intuition that internet searches might reflect broader socio-economic or political patterns, represent individual feelings of threat and danger, and thus capture early signals of violence escalation. They integrate the ViEWS benchmark model with measures of Wikipedia topic saliency, leveraging data on views of and contributions to Wikipedia pages. Their predictors provide an innovative perspective on early signals of violence, by identifying politically controversial topics as measured by the number of page changes, along with the saliency of the country proxied by the number of page views. However, they find that only the country page views variable contributes positively to the forecasting task.
Mueller and Rauh include data extracted from newspaper articles and aggregated into topics to capture subtle signals from the news, which are positively or negatively related to violence risk.
Model specifications
The contributions vary greatly in terms of strategies for feature selection as well as techniques to engineer features. Several of them rely on the estimation algorithms to select features from the 600 variables provided in the ViEWS package provided to participants or own feature contributions. For instance, Brandt et al. (Citation2022) focus on building an end-to-end framework with little feature engineering, and include all inputs to the model as raw features. Radford and Malone rely on the techniques in convolutional neural-network models to expand features from a smaller selection of raw features. Attinà, Carammia, and Iacus feed their AdaNet model with the features included in the ViEWS data set, allowing the algorithm to perform both the selection of the optimal (and most parsimonious) set of features and the estimation contextually. Contributions such as Vestby et al. that make use of tree-based models allow these algorithms to weigh the importance of the broad feature sets fed into them. Vestby et al. also add some theoretically motivated temporal lags and manipulations of the conflict variables, such as the counts of state-based, one-sided, and nonstate violence over a moving 12-month window, as well as the 6-month moving average growth of these counts.
Other contributions select the features manually into their model specifications. Fritz et al. (Citation2022) (pgm) opt for a parsimonious set of theoretically motivated variables, and emphasize the external procurement of major conventional weapons as a critical factor that gives governments the opportunity to catalyze armed conflict.
Bätz, Klöckner, and Schneider specify their models in a cumulative approach, progressively adding theoretically driven feature sets on top of a baseline model. Similarly, Hultman, Leis, and Nilsson test three different model specifications based on peacekeeping operations data. One model only contains the number of peace keeping operations (PKOs) in the PRIO-GRID cell and a spatial lag; a second model includes some additional peacekeeping-related features; and the third model also integrates additional information on space–time dependencies and seasonality. Their results show that while the model including only PKOs is the best in terms of TADDA scores, including violence history is necessary not to underestimate positive changes in conflict.
Acknowledging the difficulty of knowing a priori the right model specification or algorithm, several contributions structure their approach to draw on multiple specifications. D’Orazio and Lin (Citation2022) use automated Machine-Learning systems to search systematically over a wide space of specifications. Ettensperger and Randahl and Vegelius use ensemble techniques to generate predictions from a number of distinct models.
Model criticism
Some participants provided multiple model specifications and compared their predictive performance on the test set to get some insight on the modeling approach and/or the theory behind it. D’Orazio and Lin (Citation2022) test different model specifications at both cm and pgm. The results show that their dependent variable-only model, which only includes information about the endogenous variable, performs better than a model which uses the most useful predictors from ViEWS, as well as the hurdle-model specification, which uses heuristics to remove zero-fatality observations. Their findings suggest that auto-machine-learning (auto-ML) systems based on a conflict history only specification achieves the highest predictive power, especially at high spatial resolution (pgm), whereas exogenous variables may be more valuable at higher levels of aggregation (cm). The authors also expect that slow-moving variables like development indicators will not yield improvements over their best model, as the value of this information gets incorporated into the auto-ML forecasts. Improvements in forecasting at pgm level might rather be achieved by integrating information on sudden changes preceding violence.
A common realization from the participants was the need for improved and extended sets of evaluation metrics which (i) take the predictive distribution into account; (ii) reward the ability to accurately forecast nonzero changes in fatalities, compared to models that always predict null change; (iii) evaluate models’ performance in different subtasks separately, that is, with respect to predicting the onset or recurrence of violence as distinct from the change in fatalities in ongoing conflicts; and (iv) measure substantial modeling improvements.
Both Brandt et al. (Citation2022) and Lindholm et al. propose models that generate forecasts as distributions rather than points only, and advocate evaluation metrics that take the entire distribution into account. Exploring this on their own models, Brandt et al. (Citation2022) find that the performance of a model that includes event data is clearly better when using MSE for evaluation, while when using a metric that accounts for the predictions’ distributions, the results are mixed and the inclusion of ICEWS event data does not clearly contribute to better performance. On the basis of that, they advocate for a better alignment of the selection of performance metrics with the models’ end-goal, in a way to optimize the forecasting model according to its objective. Lindholm et al. also argue that the predictive distribution contains valuable information that is not taken into account in the competition scoring. They find their model to perform relatively worse when evaluating with a point-only metric like the MSE. Brandt et al. (Citation2022) suggest using continuous rank probability scores (CRPS, see Brandt, Schrodt, and Freeman Citation2014) as a proper scoring metric that accounts for the distribution of the prediction, not only the point, as is the case with mean squared error. CRPS can improve model selection, as accounting for the full distribution can help researchers to avoid cases where the MSE is low but predictions exhibit high variance. On the other hand, just as the MSE, CRPS does not necessarily reward models’ ability to forecast nonzero changes in fatalities.
Pointing to the limits of the state of the art in forecasting changes in fatalities, Vestby et al. discuss their models’ performance relative to the no-change model. The no-change model exhibits a better MSE score than the alternatives they propose. The authors’ preferred model is their Extreme Gradient Boosting model (XGB), which they report to be best at predicting actual changes in locations where there was a nonzero change in violence, although coming at the expense of more “false positives.” Based on this, they question the usefulness of the MSE for evaluating models’ performance and advocate for the introduction of new evaluation metrics which reward not only “trueness” — squared deviations from the actuals — but also “precision” — models’ ability to discriminate between no change and either escalation or de-escalation. Such metrics would acknowledge the sensitivity of early warning models to positive actual occurrence, rather than the nonoccurrence of (de-)escalation. For example, they suggest the Concordance Correlation Coefficient (Lin Citation1989, CCC) which evaluates the pairwise agreement between two vectors of observations along a scale from –1 to 1 and measures both “precision” and “trueness” at the same time.Footnote16
Theoretical insights and future advancements
Many teams provide valuable insight on forecasting changes in fatalities both from a theoretical and methodological stand-point.
Models presented by Malone, Chadefaux, and D’Orazio and Lin (Citation2022) perform well by only including conflict history variables as predictors, pointing to the importance of exploiting further the information contained in past conflict trends. Likewise, Randahl and Vegelius show that out of their 15 constituent models, the highest ensemble weights are assigned to the conflict history and the conflict neighborhood models.
Another lesson from the contributions concern the importance of parsimony in forecasting models. Models with one or very few features perform at least as well as models with very extensive feature sets (e.g., D’Orazio and Lin Citation2022). Results from various contributions reiterate the importance of digging into conflict-related variables, such as spatial and temporal patterns, to improve forecasting performance of the change in fatalities (Chadefaux, D’Orazio and Lin, Lindholm et al., Malone, and Randahl and Vegelius).
Yet, as predicting change in fatalities is harder than predicting conflict incidence or duration, including features that can capture both early warning signals of violence escalation and drivers of de-escalation can provide added value.
Textual information related to event data can contribute to increasing the signals of early tensions. Event data (Attinà, Carammia, and Iacus, and Brandt et al.), data from Wikipedia pages (Oswald and Ohrenhofer) and features extracted from the news (Mueller and Rauh) can capture almost real-time changes in attitudes both at an individual and collective level which might provide unique insight on the raise of tensions or the increased risk of violence onset.
Models that include theoretically motivated factors (Fritz, Lebacher, and Kauermann Citation2020), or mediating contextual conditions that can lead to de-escalation rather than increase in violence—such as PKOs (Hultman, Leis, and Nilsson), could similarly add unique insights to forecasting changes in fatalities, and balance the tendency to predict a continuous positive change in violence in locations burdened by a gloomy conflict legacy.
The difficulty of the prediction task may indicate that the very prediction problem put to the contributors could have been better formulated. This is discussed at some length in Vestby et al. (Citation2022). For instance, they point out that the fluctuating nature of monthly fatalities suggest that we should rather be interested in the more permanent and substantial changes in levels identified by change-point models (e.g., Cunen, Hjort, and Nygård Citation2020) than month-to-month changes. One possibility could be to define escalation as a latent variable and observe it at lower spatio-temporal resolution to avoid introducing too much noise in the data. Another interpretation is that the task of prediction is difficult, especially at the pgm level, because peace science has been focused on linear models using lower spatial and temporal resolution concepts and measurements for five decades (Ward and Beger Citation2017). A shift in focus could bring more sustained progress.
What We Have Learned
The contributions of teams with different expertise and approaches to studying the escalation and de-escalation of violence has taught us some valuable lessons on forecasting conflict processes.
It is clear that the task of predicting change is daunting, as it requires two quite different abilities: the sensitivity to pick up early warning signals of tensions before a conflict erupts, and the ability of discerning the amount of change from the pre-existing level. While models are quite good at predicting ongoing violence based on previous conflict history, due to persistent patterns of violence, forecasting violent breakups is much more difficult, as well as predicting events in areas with no recent conflict history (Vestby et al. Citation2022). The problem of the large proportion of observations with zeros is even more pressing when predicting changes in fatalities than when predicting conflict incidence. This has to be taken into account both when developing models and evaluating them. MSE does not address these issues, as it does not reward or penalize models for their ability to predict in the neighborhood of zeros. An important endeavor for future research is thus to elaborate a set of evaluation metrics that can assess forecasting performance over different dimensions. Relatedly, promoting the use of a full set of metrics rather than only one to evaluate models’ performance could improve the evaluation process.
Models generally struggle to distinguish positive from negative changes in fatalities, especially at the monthly level (Vestby et al. Citation2022). Forecasting de-escalation seems to be a particularly hard problem, and models that include drivers of conflict settlement such as peacekeeping operations might be a valuable complement to traditional approaches that include only drivers of conflict escalation. A reason why de-escalation might be hard to predict could be the time-varying character of a conflict.
Models that include information about different actors or conflict types could help improve performance (Malone Citation2022). As Malone points out, there might be theoretical reasons why forecasting models struggle to predict new conflicts, as suggested by the efficient market hypothesis in financial economics (e.g., Malkiel and Fama Citation1970) and bargaining theories (Fearon Citation1994; Spaniel and Malone Citation2019) —war might be “in the error term” (Gartzke Citation1999). If so, there may be a ceiling on model performance, and we should have conditional expectations about when forecasting is likely to prove more accurate than others. Also, as mentioned by Mueller and Rauh (Citation2022), the number of cases of first onsets is low and machine-learning models are less useful than smaller, more theoretically based models.
The models submitted agree on the importance of spatio-temporal dependencies when investigating changes in violence patterns. Models based on very parsimonious sets of input features, or even on conflict-related variables only, tend to perform at least as well as models with many predictors. This calls for the importance of digging into methods and approaches to exploit the (latent) information contained in conflict variables further. Models need to carefully define the dependent variable in a way that best encodes learnable information about (de-)escalation patterns, and how that relates to the spatio-temporal resolution (Vestby et al.).
Complex algorithms can reach higher levels of accuracy in forecasting, but this tends to come at the expense of interpretability. This competition exemplified how political science is moving toward increasingly complex models. These models with potentially hundreds of thousand of parameters and layers of nonlinearities are undoubtedly needed, at least as a step toward predicting emergent, social phenomena such as violence. These advances however need to be coupled with efforts of interpreting the results. Increased interpretability is necessary so that these findings can contribute to a greater scientific understanding of conflict processes and ultimately enhance theory developments. Iterating induction from models and then qualitative knowledge about patterns and cases holds the promise of more parsimonious representations as well as transferring learning from one task (e.g., escalation) to others (e.g., onset). Advancements in forecasting therefore need to both listen and speak to sound theoretical developments, to enable this process (Colaresi and Mahmood Citation2017). A lack of interpretability might also limit the policy-relevance and ethical use of these models. Without understanding the patterns in the models (and data) it is more difficult for researchers and policy-makers to ensure that they do not encode bias or unfairness to specific groups. While there is significant work to be done on this moving forward, models like the one presented by Fritz et al. (Citation2022), which explicitly aims at being easy to interpret, theoretically solid and flexible enough to capture interpretable linear and nonlinear effects, might foster theoretical advances, be better able to reflect the observable patterns in the data, and contribute to multimethod dialogue on further progress.
What wisdom can we learn from the crowd of contributors to the competition? Our results from evaluating the unweighted average ensemble of predictions for the true future (reported in Vesco et al. [Citation2022]) clearly suggest that the optimal modeling approach draws on a good number of them. One challenge when evaluating and scoring the contributions is that each of them are partial solutions to the problem. The contributed forecasts are specializing in a narrow subset of the problem, and the true value of the innovation can be hidden by suboptimal performance with respect to the aspects that are given less attention. For instance, many participants chose to include only a selection of the features available to them when developing their algorithms or expanding with new features, and those contributing new features may use less optimal algorithms.
As demonstrated by their superior relative performance in the test partition, models spanning multiple specifications can contribute greatly to the prediction task [the D’Orazio and Lin (Citation2022) auto-ML solutions perform very well at both levels of analysis, as does the ensemble model in Ettensperger]. Our simple ensemble model seeks to exploit this across all the contributions to the competition. Another approach would be to pick the most promising partial contributions and assemble them in a new modeling framework. Although outside the scope of this introductory article, this framework would likely include the following: (i) Some form of ensemble modeling, possibly in combination with automated specification search algorithms, are essential; (ii) At the cm level, the new features suggested are clearly valuable (iii) Data extracted from the news through topic modeling (Mueller and Rauh) or in the form of events data (Brandt et al. Citation2022) belong to an improved model, as do internet search data (Oswald and Ohrenhofer); (iv) At the pgm level, an optimized model would include some of the suggested methods for modeling existing conflict history data, either through convolutional RNN models or the “time-warping” procedure suggested by Chadefaux. Several contributors point to the difficulty of modeling onset of violence and change from a given level of pre-existing violence simultaneously. Markov and state-space models (Randahl and Vegelius; Lindholm et al.) are clearly effective. Although the submitted hurdle models (Fritz et al. Citation2022 and D’Orazio and Lin) do not perform spectacularly well, such solutions or functional equivalents should probably belong to a synthesizing ensemble of models.
It seems clear that competitions like the one presented here are useful tools to advance research in forecasting social behavior. The format allowed us to apply the latest and most innovative trends in research to a common problem, and we believe the lessons learned are more clear than would have been the case if there was no predefined common task to focus on. We have developed an infrastructure that can be reused in future competitions, and have contributed to a learning process among the ViEWS team and all the participants that are new to the format.
We intended this competition to set out a ground for future ones. To this end, we established a flexible infrastructure that can be reused in future competitions. Following such a trial-and-error approach, the competition was also a useful stress-test for the openness and usability of the ViEWS system [through OpenViEWS2 (Citation2020)].Footnote17
The dynamic exchanges involving the ViEWS team and the participants contributed to an interactive learning process and resulted in the establishment of an international network which comprises academics working at different institutions, with different expertise, discipline of interest, and seniority level.
Future Research Avenues
The competition organized by ViEWS achieved significant improvements in our collective knowledge on conflict forecasting. Yet, it also highlighted some important research gaps and suggested promising avenues for future research. First, if scholars want predictions to be valuable for policy-makers and stakeholders, they need to clarify their expectations as for models’ performance and limits. An avenue for future research is thus to find meaningful ways to estimate and represent the uncertainty related to forecasts. Anticipating future armed conflict is obviously an uncertain endeavor and the uncertainty has to be modeled and reported in a much clearer way than what has been done so far. A step in this direction is to complement point forecasts with probability distributions as recommended by Brandt, Schrodt, and Freeman (Citation2014). Approaches that report the uncertainty of the forecasts would facilitate the comparison of models not only with regards to the accuracy of point estimates, but also to their relative error and confidence level.
Second, more research is needed on developing, testing, and applying evaluation metrics that assess the forecasting models for their comprehensive performance, evaluate their ability to predict different stages of violence (predicting the onset of conflict is different than predicting violence de-escalation), and reward them for accurately predicting changes in fatalities where they occur rather than zero in peaceful settings.
Third, this competition revealed that the ensembles of all contributions performed well and better than the average model in the true future partition, but always worse than the best individual contribution. This opens up new research questions. Specifically, scholars need to further delve into the power of ensemble techniques and test under what conditions ensembles can improve the forecasting accuracy upon individual models.
Finally, a promising research area is to understand how to fruitfully combine approaches that exploit the latent information contained in the conflict variable, including the spatio-temporal dependencies and nonlinearities, with theoretically informed and fast-changing features that can help predict violence outbreaks or escalations in settings where the history of or spatial distance to conflict would not have suggested a risk of conflict.
Supplemental Material
Download PDF (633.3 KB)Acknowledgments
Thanks to the ViEWS team that has contributed immensely to the prediction competition, to this article and the entire special issue, and to all the authors of articles in the issue for providing helpful comments. We are also grateful to Espen Geelmuyden Rød for his great work in developing and launching the prediction competition, as well as to the two anonymous reviewers for helpful comments.
Additional information
Funding
Notes
1 For example, see the thematic models in Hegre et al. (Citation2019) and Hegre et al. (Citation2021).
2 The ViEWS team has developed an early warning system for political violence since 2017. For more information on the project, see ViEWSER (Citation2022) as well as Hegre et al. (Citation2019) and Hegre et al. (Citation2021).
3 In the forecasts presented in Vesco et al. (Citation2022), the target at the cm level is conflict with at least 25 BRDs, but ViEWS records all fatal events as coded by the UCDP (Pettersson and Öberg Citation2020; Hegre et al. Citation2021).
4 The UCDP-GED raw data are publicly available through the UCDP-GED API (Croicu and Sundberg Citation2013).
5 This can be thought of as setting a scale for escalation from zero to one in terms of multiplicative change. We set this scale to be similar to doubling plus 1. Thus doubling any value and adding 1 closely approximates the change from 0 to 1 that we instantiate each value with. Substantively, this value provides a lift to the importance of “new” conflict or conflicts that die down to zero (since the log scale is symmetric about the factor change).
6 Having a true out-of-sample/from-the-future test set (in the second column) helps to avoid that any intentional or accidental data leakage and overfitting will lead to poor generalization performance.
7 In practice, we trained separate models for each step and for each of the tasks listed above, but they all have the same feature sets and hyperparameters.
8 The ViEWS team is continuously updating and improving the data. During the competition, some minor issues were discovered with the structures (geometries and neighborhoods) of the cm and pgm data sets as well as with the handling of missing data. For the sake of fairness, the benchmark models still use the original version of the data, while the evaluation of the contributions is performed against the corrected actual data. Supplementary Tables A-3 and A-4 report the evaluation results for the benchmark model computed on the corrected actual data. The evaluation changes only very slightly.
9 See Hegre et al. (Citation2019) for details.
10 Feature importance is calculated as the normalized total reduction in Gini impurity for each input.
11 We are grateful to Vestby et al. (Citation2022) for proposing this as a second benchmark model.
12 There are two interpretations for different scores across distinct sets of comparison data: the first is that the model does worse, or second, that the prediction problem at step 6 is simply more difficult that the other steps. A comparison of the values of metrics calculated with different target/actual observations cannot identify which of these interpretations is correct. The same problem does not plague comparing models based on the same observed data, since this holds constant the difficulty of the problem.
13 An overview of the contributions and their main features is presented in in Vesco et al. (Citation2022).
14 We emphasize that these insights do not imply that there is not significant work to accomplish in the future, only that we find clear evidence of progress. Even if these are early days, especially for usefully predicting changes at high spatial resolution, there are reasons to be optimistic that there are systematic patterns to learn from.
15 The comparison metrics of an ensemble of the contributions for the test set are unveiled in Vesco et al. (Citation2022).
16 There are also some significant limitations to the CCC, including the fact that it mixes information on accuracy and precision without disambiguating them. Because of this, a model that fits patterns in the data more accurately than another, which would be preferred by MSE, would have its lower variance penalized by CCC. This is one reason why CCC is used for estimating the reliability of measurements, but not as performance metrics conventionally for forecasting.
17 The code used to run the benchmark models and for evaluating the contributions is available in our replication material package. ViEWS has recently developed a new version of the infrastructure that is even more accessible and flexible (https://github.com/prio-data/viewser/wiki).
References
- Attinà, Fulvio, Marcello Carammia, and Stefano Iacus. 2022. “Forecasting Change in Conflict Fatalities with Dynamic Elastic Net.” International Interactions 48 (4).
- Bätz, Konstantin, Ann-Cathrin Klöckner, and Gerald Schneider. 2022. “Challenging the Status Quo: Predicting Violence with Sparse Decision-Making Data.” International Interactions 48 (4). doi:10.1080/03050629.2022.2051024.
- Bagozzi, Benjamin E. 2015. “Forecasting Civil Conflict with Zero-Inflated Count Models.” Civil Wars 17 (1): 1–24. doi:10.1080/13698249.2015.1059564.
- Bell, Curtis. 2016. The Rulers, Elections, and Irregular Governance Dataset (REIGN). Broomfield: OEF Research.
- Blei, David M. 2014. “Build, Compute, Critique, Repeat: Data Analysis with Latent Variable Models.” Annual Review of Statistics and Its Application 1 (1): 203–232. doi:10.1146/annurev-statistics-022513-115657.
- Boschee, Elizabeth, Jennifer Lautenschlager, Sean O’Brien, Steve Shellman, and James Starz. 2018. “ICEWS Automated Daily Event Data v121”. Harvard Dataverse. Accessed 30 September 2020. https://dataverse.harvard.edu/dataset.xhtml?persistentId=doi:10.7910/DVN/QI2T9A
- Brandt, Patrick, Vito D’Orazio, Latifur Khan, Yi-Fan Li, Javier Osorio, and Marcus Sianan. 2022. “Conflict Forecasting with Event Data and Spatio-Temporal Graph Convolutional Networks.” International Interactions 48 (4). doi:10.1080/03050629.2022.2036987.
- Brandt, Patrick, Philip Schrodt, and John Freeman. 2014. “Evaluating Forecasts of Political Conflict Dynamics.” International Journal of Forecasting 30 (4): 944–962. doi:10.1016/j.ijforecast.2014.03.014.
- Carpenter, Jennifer. 2011. “May the Best Analyst Win.” Science 331 (6018): 698–699. doi:10.1126/science.331.6018.698.
- Cederman, Lars-Erik, and Nils B. Weidmann. 2017. “Predicting Armed Conflict: Time to Adjust Our Expectations?” Science 355 (6324): 474–476. doi:10.1126/science.aal4483.
- Chadefaux, Thomas. 2022. “A Shape-Based Approach to Conflict Forecasting.” International Interactions 48 (4). doi:10.1080/03050629.2022.2009821.
- Cil, Deniz, Hanne Fjelde, Lisa Hultman, and Desirée Nilsson. 2020. “Mapping Blue Helmets: Introducing the Geocoded Peacekeeping Operations (Geo-PKO) Dataset.” Journal of Peace Research 57 (2): 360–370. doi:10.1177/0022343319871978.
- Colaresi, Michael, and Zuhaib Mahmood. 2017. “Do the Robot: Lessons from Machine Learning to Improve Conflict Forecasting.” Journal of Peace Research 54 (2): 193–214. doi:10.1177/0022343316682065.
- Collier, Paul, Anke Hoeffler, and Måns Söderbom. 2008. “Post-Conflict Risks.” Journal of Peace Research 45 (4): 461–478. doi:10.1177/0022343308091356.
- Coppedge, Michael, John Gerring, Carl Henrik Knutsen, Staffan I. Lindberg, Jan Teorell, David Altman, Michael Bernhard, et al. 2020. V-Dem Codebook v10. Varieties of Democracy (V-Dem) Project. Accessed 30 September 2020. https://www.v-dem.net/en/data/data-version-10/
- Croicu, Mihai Catalin, and Ralph Sundberg. 2013. “UCDP Georeferenced Event Dataset Codebook v4.0”. Uppsala Conflict Data Program, Uppsala University. Accessed 22 June 2022. https://ucdp.uu.se/downloads/index.html#ged_global
- Cunen, Céline, Nils Lid Hjort, and Håvard Mokleiv Nygård. 2020. “Statistical Sightings of Better Angels: Analysing the Distribution of Battle-Deaths in Interstate Conflict over Time.” Journal of Peace Research 57 (2): 221–234. doi:10.1177/0022343319896843.
- D’Orazio, Vito, and Yu Lin. 2022. “Forecasting Conflict in Africa with Automated Machine Learning Systems.” International Interactions 48 (4). doi:10.1080/03050629.2022.2017290.
- Ettensperger, Felix. 2022. “Forecasting Conflict Using a Diverse Machine-Learning Ensemble: Ensemble Averaging with Multiple Tree-Based Algorithms and Variance Promoting Data Configurations.” International Interactions 48 (4). doi:10.1080/03050629.2022.1993209.
- Fearon, James D. 1994. “Domestic Political Audiences and the Escalation of International Disputes.” American Political Science Review 88 (3): 577–592. doi:10.2307/2944796.
- Fritz, Cornelius, Michael Lebacher, and Göran Kauermann. 2020. “Tempus Volat, Hora Fugit: A Survey of Tie-Oriented Dynamic Network Models in Discrete and Continuous Time.” Statistica Neerlandica 74 (3): 275–299. doi:10.1111/stan.12198.
- Fritz, Cornelius, Marius Mehrl, Paul W. Thurner, and Göran Kauermann. 2022. “The Role of Governmental Weapons Procurements in Forecasting Monthly Fatalities in Intrastate Conflicts: A Semiparametric Hierarchical Hurdle Model.” International Interactions 48 (4). doi:10.1080/03050629.2022.1993210.
- Gartzke, Erik. 1999. “War is in the Error Term.” International Organization 53 (3): 567–587. doi:10.1162/002081899550995.
- GDELT 2020. The GDELT Project. Accessed 30 September 2020. https://www.gdeltproject.org
- Gleditsch, Kristian S., and Michael D. Ward. 1999. “A Revised List of Independent States since the Congress of Vienna.” International Interactions 25 (4): 393–413. doi:10.1080/03050629908434958.
- Goldstone, Jack A., Robert H. Bates, David L. Epstein, Ted Robert Gurr, Michael B. Lustik, Monty G. Marshall, Jay Ulfelder, and Mark Woodward. 2010. “A Global Model for Forecasting Political Instability.” American Journal of Political Science 54 (1): 190–208. doi:10.1111/j.1540-5907.2009.00426.x.
- Greene, Kevin, Håvard Hegre, Frederick Hoyles, and Michael Colaresi. 2019. “Move It or Lose It: Introducing Pseudo-Earth Mover Divergence as a Context-Sensitive Metric for Evaluating and Improving Forecasting and Prediction Systems.” Paper presented at the 2019 Barcelona GSE Summer Forum, Workshop on Forecasting Political and Economic Crisis: Social Science Meets Machine Learning, Barcelona, Spain, June.
- Hegre, Håvard, Marie Allansson, Matthias Basedau, Mike Colaresi, Mihai Catalin Croicu, Hanne Fjelde, Frederick Hoyles, et al. 2019. “ViEWS: A Political Violence Early Warning System.” Journal of Peace Research 56 (2): 155–174. doi:10.1177/0022343319823860.
- Hegre, Håvard, Joakim Karlsen, Håvard Mokleiv Nygård, Håvard Strand, and Henrik Urdal. 2013. “Predicting Armed Conflict 2010–2050.” International Studies Quarterly 57 (2): 250–270. doi:10.1111/isqu.12007.
- Hegre, Håvard, Nils W. Metternich, Håvard Mokleiv Nygård, and Julian Wucherpfennig. 2017. “Introduction: Forecasting in Peace Research.” Journal of Peace Research 54 (2): 113–124. doi:10.1177/0022343317691330.
- Hegre, Håvard, Curtis Bell, Michael Colaresi, Mihai Catalin Croicu, Frederick Hoyles, Remco Jansen, Maxine Ria Leis, et al. 2021. “ViEWS: Revising and Evaluating the ViEWS Political Violence Early-Warning System.” Journal of Peace Research 58 (3): 599–611. doi:10.1177/0022343320962157.
- Hegre, Håvard, Mihai Catalin Croicu, Kristine Eck, and Stina Högbladh. 2020. “Introducing the UCDP Candidate Events Dataset.” Research & Politics 7 (3): 205316802093525. doi:10.1177/2053168020935257.
- Hochreiter, Sepp, and Jürgen Schmidhuber. 1997. “Long Short-Term Memory.” Neural Computation 9 (8): 1735–1780. doi:10.1162/neco.1997.9.8.1735.
- Hong, Lu, and Scott E. Page. 2001. “Problem Solving by Heterogeneous Agents.” Journal of Economic Theory 97 (1): 123–163. doi:10.1006/jeth.2000.2709.
- Hong, Lu, and Scott E. Page. 2004. “Groups of Diverse Problem Solvers Can Outperform Groups of High-Ability Problem Solvers.” Proceedings of the National Academy of Sciences of the United States of America 101 (46): 16385–16389. doi:10.1073/pnas.0403723101.
- Hultman, Lisa, Maxine Leis, and Desirée Nilsson. 2022. “Employing Local Peacekeeping Data to Forecast Changes in Violence.” International Interactions 48 (4).
- Johnson, N., A. Hitchman, D. Phan, and L. Smith. 2018. “Self-Exciting Point Process Models for Political Conflict Forecasting.” European Journal of Applied Mathematics 29 (4): 685–707. doi:10.1017/S095679251700033X.
- Karlin, Samuel. 2014. A First Course in Stochastic Processes. Cambridge: Springer.
- Lin, Lawrence I-Kuei. 1989. “A Concordance Correlation Coefficient to Evaluate Reproducibility.” Biometrics 45 (1): 255–268. doi:10.2307/2532051.
- Lindholm, Andreas, Johannes Hendriks, Adrian Wills, and Thomas B. Schön. 2022. “Predicting Political Violence Using a State-Space Model.” International Interactions 48 (4).
- Malkiel, Burton G., and Eugene F. Fama. 1970. “Efficient Capital Markets: A Review of Theory and Empirical Work.” The Journal of Finance 25 (2): 383–417. doi:10.2307/2325486.
- Malone, Iris. 2022. “Recurrent Neural Networks for Conflict Forecasting.” International Interactions 48 (x): 1–20. doi:10.1080/03050629.2022.2016736.
- Mueller, Hannes, and Christopher Rauh. 2022. “Using Past Violence and Current News to Predict Changes in Violence.” International Interactions 48 (4).
- Mueller, Hannes Felix, and Christopher Rauh. 2019. The Hard Problem of Prediction for Conflict Prevention. CEPR Discussion Papers 13748. C.E.P.R. Discussion Papers, London: CEPR Centre for Economic Policy Research.
- Oswald, Christian, and Daniel Ohrenhofer. 2022. “Click, Click Boom: Using Wikipedia Data to Predict Changes in Battle-Related Deaths.” International Interactions 48 (4). doi:10.1080/03050629.2022.2061969.
- OpenViEWS2 2020. ViEWS. Accessed 30 September 2020. https://github.com/UppsalaConflictDataProgram/OpenViEWS
- Page, Scott E. 2007. The Difference: How the Power of Diversity Creaetes Better Groups, Firms, Schools, and Societies. Princeton: Princeton University Press.
- Pettersson, Therése, and Magnus Öberg. 2020. “Organized Violence, 1989–2019.” Journal of Peace Research 57 (4): 597–613. doi:10.1177/0022343320934986.
- Radford, Benjamin J. 2022. “High Resolution Conflict Forecasting with Spatial Convolutions and Long Short-Term Memory.” International Interactions 48 (4).
- Raleigh, Clionadh, Håvard Hegre, Joakim Karlsen, and Andrew Linke. 2010. “Introducing ACLED: An Armed Conflict Location and Event Dataset.” Journal of Peace Research 47 (5): 651–660. doi:10.1177/0022343310378914.
- Randahl, David, and Johan Vegelius. 2022. “Predicting Escalating and de-Escalating Violence in Africa Using Markov Models.” International Interactions 48 (4). doi:10.1080/03050629.2022.2049772.
- Scharpf, Adam, Gerald Schneider, Anna Nöh, and Aaron Clauset. 2014. “Forecasting the Risk of Extreme Massacres in Syria.” ERIS – European Review of International Studies 1 (2): 50–68. doi:10.3224/eris.v1i2.16503.
- Spaniel, William, and Iris Malone. 2019. “The Uncertainty Trade-off: Reexamining Opportunity Costs and War.” International Studies Quarterly 63 (4): 1025–1034. doi:10.1093/isq/sqz050.
- Sundberg, Ralph, and Erik Melander. 2013. “Introducing the UCDP Georeferenced Event Dataset.” Journal of Peace Research 50 (4): 523–532. doi:10.1177/0022343313484347.
- Tollefsen, Andreas Forø, Håvard Strand, and Halvard Buhaug. 2012. “PRIO-GRID: A Unified Spatial Data Structure.” Journal of Peace Research 49 (2): 363–374. doi:10.1177/0022343311431287.
- Vesco, Paola, Håvard Hegre, Michael Colaresi, Remco Bastiaan Jansen, Adeline Lo, Gregor Reisch, and Nils B. Weidmann. 2022. “United They Stand: Findings from an Escalation Prediction Competition.” International Interactions 48 (4). doi:10.1080/03050629.2022.2029856.
- Vestby, Jonas, Jürgen Brandsch, Vilde Bergstad Larsen, Peder Landsverk, and Andreas Forø Tollefsen. 2022. “Predicting (de-)Escalation of Sub-National Violence Using Gradient Boosting: Does It Work?” International Interactions 48 (4). doi:10.1080/03050629.2022.2021198.
- ViEWSER 2022. ViEWS. Accessed 22 June 2022. https://github.com/prio-data/viewser/wiki
- Ward, Michael D., and Andreas Beger. 2017. “Lessons from near Real-Time Forecasting of Irregular Leadership Changes.” Journal of Peace Research 54 (2): 141–156. doi:10.1177/0022343316680858.
- Ward, Michael D., Brian D. Greenhill, and Kristin M. Bakke. 2010. “The Perils of Policy by p-Value: Predicting Civil Conflicts.” Journal of Peace Research 47 (4): 363–375. doi:10.1177/0022343309356491.
- Weidmann, Nils B. 2015. “On the Accuracy of Media-Based Conflict Event Data.” Journal of Conflict Resolution 59 (6): 1129–1149. doi:10.1177/0022002714530431.
- Weidmann, Nils B., Doreen Kuse, and Kristian Skrede Gleditsch. 2010. “The Geography of the International System: The CShapes Dataset.” International Interactions 36 (1): 86–106. doi:10.1080/03050620903554614.
- Witmer, Frank D. W., Andrew M. Linke, John O’Loughlin, Andrew Gettelman, and Arlene Laing. 2017. “Subnational Violent Conflict Forecasts for Sub-Saharan Africa, 2015–65, Using Climate-Sensitive Models.” Journal of Peace Research 54 (2): 175–192. doi:10.1177/0022343316682064.
- World Bank 2019. “World Development Indicators”. World Bank Data Bank. Accessed 22 June 2022. https://databank.worldbank.org/source/world-development-indicators