
ABSTRACT
Stand-alone price analysis of illicit opium and coca does not explain why smallholders turn to illicit crops for coping and survival. Under conditions of precarity, illicit crop markets can stimulate productivity. They generate returns that can tame crises and relieve pressures. To smallholders facing marginalisation, violence, and climate change – growing opium and coca, despite their illegality, can reduce or spread risks and provide more predictability. Thus, rather than fix on the ‘invisible hand’ of price theory, the focus should be on the ‘visible hand’ of political entrepreneurship, interdependent relationships, and the metrics of precarity. To do this, this paper retrospectively compares illicit crop prices before and after certain historical moments in Bolivia, Myanmar, Colombia, and Afghanistan.
Introduction: in search of the ‘invisible’ and ‘visible hands’
Sometime in June 1980, poor subsistence farmer Paulino Vasquez was on his way to Chimore, Bolivia, to sell the 100 pounds of coca leaves he carried on his back, worrying about wildly fluctuating prices.Footnote1 In February, he got 6,000 pesos for a similar 100-pound load (about US$240Footnote2). However, in April and May, the prices dropped to about 1,500 pesos ($60). At least, Paulino reassured himself, coca always had buyers, unlike his other crops. Moments later, a truck driver stopped and paid 16,000 pesos ($640) for his coca leaves. The unexpected price rise and Paulino’s windfall began what Laserna described as Bolivia’s ‘coca boom’ of the 1980s (1995, 1–18).
The impact of high coca prices reverberated throughout the country. Although illicit, coca-growing was quickly rising to become an alternative source of income, especially since the number of unemployed were rising due to the contraction – triggered by falling global prices – of the country’s mining and gas industries. The lure of high coca prices induced more migration to the sparsely-populated, flat, low-lying eastern provinces, where the government built roads in the 1960s and 1970s to encourage settlement and agricultural production. Soon, the Chapare and adjacent municipalities like Chimore in Cochabamba Province transformed to be the main coca-producing areas. In his cost–benefit analysis of Bolivia’s national accounts in the 1980s, Painter concludes that the coca-cocaine economy ‘facilitated the country’s most radical restructuring of its economy this century’ (Citation1994, 53–54, 73).
How could such price movements be explained, and what are the underlying changes and processes they represent? What information did those prices signal, particularly to people like Paulino, the truck driver, and migrants to the Chapare? What do price changes trigger? Moreover, did the price rises indicate that Bolivia’s economy was restructuring, led by coca production?
Applying price theory is the dominant approach in making sense of illicit drug crop prices and their fluctuations. Since prices, as the assumption goes, reflect and signal what goes on in the market, its analysis – based on the basic supply-and-demand model leading to an ‘equilibrium’ point where the optimal price and production levels meet – should inform policy responses. Such an approach, however, is fundamentally flawed. The ‘invisible hand’ that is said to shape market behaviour and reflected through prices is an assumption arrived at not through empirical observation and critical reflection but accepted as an already existing or self-evident certainty. This paper argues that a search for the visible hand of power and political entrepreneurship instead and how they affect prices may yield more useful outcomes for policy rethinking and development.
This paper attempts an alternative route for analysis – it conducts a simple retrospective comparative analysis of immediate contexts and prices before and after a historical turning point in key illicit crop-producing countries. It starts with Bolivia and uses the experience of the coca boom in the 1980s as a reference point for developing three inferences that may be at work when illicit crop prices change – that illicit crops, despite being routinely regarded as sources of disorder, may also stimulate productivity, relieve economic pressures, and provide predictability. The paper then probes further into three more cases for closer comparative analysis and testing of the inferences:
Myanmar: the 1989–1994 ceasefires with insurgent armies in opium-growing borderlands.
Colombia: the September 1996 cocalero uprising in the coca-growing southern provinces.
Afghanistan: the 2000–2001 opium ban by the Taliban.
Some factors justify the use of a simple before-and-after comparison. First, knowledge about illicit crops and drug markets has inconsistencies and limitations — e.g. market size estimates (number of individual drug users) often do not tally with estimates of the volume of production (or consumption by users). These inconsistencies make it impossible to track and evaluate the real effects of and on prices. In addition, price theory only works when prices and production volumes are stable, and all other factors remain constant — which rarely happen in the real world. Given these difficulties, a before-and-after comparison becomes a practical, though not necessarily comprehensive, alternative analysis method. Second, prices are neither self-contained stand-alones nor givens put in place by an ‘invisible hand’. As reflected in Harriss-White’s arguments (Citation1999) and previously elaborated by Laserna (Citation1995), an evidently visible hand in the production and exchange of illicit drug crops shapes outcomes and market behaviour. That ‘visible hand’ is essentially embedded in the historical turning points and plays a role in creating the before and after scenarios.
This paper is a contribution to the call of the Drugs and (dis)order Research Project to rethink drug policy reform and analyse further the links of illicit drug economies to wider development and peacebuilding challenges.Footnote3 The project produced a body of work that examined the tensions and trade-offs between drugs, development, and peacebuilding policies; expanded on the paradox of illicit economies; and investigated alternatives.Footnote4 This special issue of JPS to which this paper belongs could hopefully sustain and expand the conversation.
Unpacking the ‘mystery’ of prices
In 1999, the predecessor of the UN Office on Drugs and Crime (UNODC) published the 315-page booklet Global Illicit Drug Trends, which began the annual reporting system known today as the UN World Drug Reports (WDR). This maiden publication made a vital claim: that ‘prices are among the most complex indicators of markets, reflecting not only an interaction of supply and demand but also various other factors relating to quality (purity), competition, and risk’ (1999, 77).
In 2006, the theory was further elaborated in a joint UNODC-World Bank publication on Afghanistan’s opiate industry. Chapter 2, which measures the macroeconomic impact of both the drug industry and counternarcotic operations, reiterates that the demand for opium declines when the export price increases and supply increases; inversely, supply declines when the farm gate price and the risk premium decrease (Martin and Symansky Citation2006). Thus, Chapter 5 stated that prices ‘are a critical determinant of the overall level of opium/opiate revenues in the Afghan economy, and of the distribution of revenues.’ Prices, therefore, provide market-based signals that influence the decisions of producers, traders, consumers, and other actors. As such, the authors continue, an analysis of opiate price data allows for weaknesses and vulnerabilities in the market and structure of the opium economy to be identified and exploited, thus contributing to shaping a more effective counternarcotics strategy (Byrd and Jonglez Citation2006).
By 2010, illicit drug price theory is fully embedded in drug policy research and analysis. The US National Research Council (NRC) published the 122-page report, Understanding the Demand for Illegal Drugs, that elaborated on a basic supply-and-demand model (see ), which ‘provides a specific language and framework to interpret available data on observed prices and quantities of illegal substances in particular markets.’ It also ascribed prices and price changes with certain predictive qualities — i.e. that an understanding of the movements in the supply and demand curves, and the resulting equilibrium price level and volume of production, can make drug control and prohibition policies better targeted, timed, and tracked (Reuter Citation2010, 18–19).
Figure 1. Basic price theory applied to illicit drugs. A government crackdown on drugs removes supplies in the market, resulting in lower volumes (Q2) and higher prices (P2). Supply-side interventions move the supply curve up and leftwards (Source: Reuter 2019: 19).
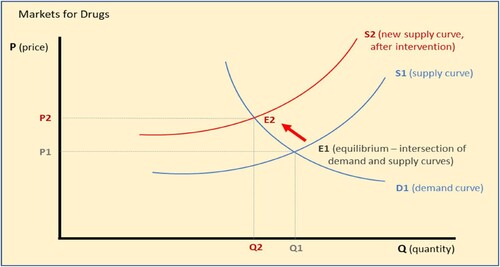
There are, however, several issues with the model, foremost of which is how the expected higher prices (P2 in ) triggered by tougher law enforcement have generally not emerged in practice. It is a remarkable empirical puzzle, quantified by economists Storti and de Grauwe (Citation2009) into a 50% to 80% drop in the prices of cocaine and heroin in Western Europe and the US from 1990 to 2005, despite intensified law enforcement globally and an ambitious 10-year programme for a ‘drugs-free world’ launched by the UN General Assembly in 1998. Storti and de Grauwe came up with an explanation: an intermediation margin between the retail supply curve and the farmer supply curve ().
Figure 2. Intermediation margin. Intermediation, typically by criminal entrepreneurs, dramatically raises the prices of illicit drugs without necessarily affecting quantity or the farmer supply curve. (Source: Storti and de Grauwe Citation2009).
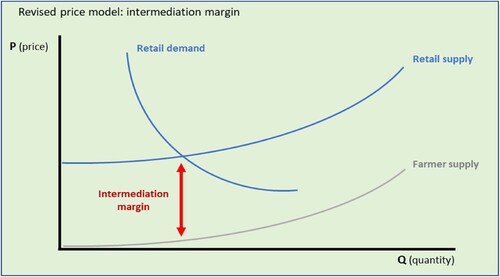
The intermediation margin is the steep price rise compensating for the related risks of bringing illicit crop products to the market. Two factors affect it – the risk premium or the incentive high enough to prompt suppliers to engage in illegal buying and distribution; and the efficiency of intermediation, i.e. the costs of intermediation due to border controls, flows of labour and capital, and management tools. The authors make an important argument: the historical decline of cocaine and heroin retail prices is due to the disappearing need for intermediation. Because cross-border payments and transactions have become more efficient, and transportation and communication costs are sharply cheaper, layers of intermediation are reduced. Hence, their answer to the empirical puzzle is that globalisation, more than policy intervention, is the main driving force behind historically declining heroin and cocaine prices.
Though an intermediation margin improves analysis, more is needed to explain the price changes observed in Bolivia in 1980. Tools for intermediation, like political and other forms of leverage, will remain relevant even in a globalised world. Quantifying risk into a price-based intermediation margin may also be problematic. For example, when there is stronger law enforcement and hence a greater need for intermediation, criminal suppliers will not always require higher prices because stronger law enforcement, not a lack of demand, is the problem they face – which they can solve by switching smuggling routes, changing delivery schedules, or paying bribes while keeping prices fixed. UN authorities add that, especially in the short term, traffickers typically react to supply changes not by changing prices but by adjusting purity (WDR Citation2002, p. 33).
Another issue with the basic model is that there is no clarity on whether price levels are a cause or consequence of movements in the supply and demand curves. It is the typical chicken-and-egg problem. If prices provide signals for decision-making, they cause outcomes – such as high prices triggering more illicit crops to be grown. But then price rises can also be the outcome itself, a consequence of factors like changing weather patterns or a reduction in supply because of more effective law enforcement, as illustrated by . This lack of clarity muddles policymaking – if high prices incentivise increased production, how should policymakers deal with the higher prices triggered by better law enforcement?
Further compounding the issue is the implicit assumption that competitive and monopoly prices exist or remain unproblematic in illicit crop markets. In the literature, an often-used term to describe drug trafficking organisations is ‘drug cartel’ – technically a collusion of actors to manipulate prices and maximise profit. But as two leading experts point out, these so-called ‘cartels’ could hardly exercise control over the volume of production of drug crops, even with the systematic use of violence. In addition, growers are said to be too small, fragmented, and dispersed to coordinate their decisions or to have any collective power in bargaining and setting prices (Reuter and Trautmann Citation2009, 11).
The supply-and-demand model assumes that prices eventually settle at an equilibrium when competitors maximise profit by improving productivity and reducing costs – like in licit agricultural markets. But in illicit opium and coca markets, the most useful strategy to prevail over competitors is not being more efficient but being able to pay bribes, buy information, know when a government crackdown is forthcoming, or display significant coercive capacity – and then use the ensuing depletion of supply to maximise profits. In other words, a new form of economics is involved that moves away from prices and the ‘invisible hand’ and converges instead on political entrepreneurship and the ‘visible hand’ – a huge gap not addressed in the price analysis.
There is also a mistake, first pointed out by Laserna (Citation1995), in the conventional understanding of profits. Official narratives point out that illicit drug prices multiply by up to 200 times from farm to market – like when coca leaves that sell for $650 per kg at the farmgate in Colombia transform into cocaine sold at $120,000 in the streets of Chicago; or when the opium gum that sells for US$ 550 per kg at the farmgate in Afghanistan ends up being sold in retail as heroin in London streets at US$ 135,000 per kg (Reuter and Trautmann Citation2009, 23).Footnote5 Thus, the overall picture is that the least profits are made at the farmgate, and most profits are earned at the retail selling stage. This is misleading, said Laserna, because the comparison omits the number of economic units or people involved. While thousands of peasant households are involved at the farmgate stage, many individuals are also similarly involved at the retail selling stage. Thus, it is at the middle stages of the commodity chain – when very few, typically well-connected and well-endowed criminal entrepreneurs move production into consumption – where profit-making rises exponentially.
A final issue with the basic model is that price information on illicit crops is usually of such poor quality that policies developed from movements plotted along the demand and supply curves become unreliable. Especially for illicit markets, holding certain variables constant is an impossibility. Therefore, the question is how, then, could illicit crop prices and price changes be studied to understand their signals and what they trigger and the underlying processes they represent?
Simply put, price theory and conventional analyses tend to flatten the complex phenomenon of illicit crops and their prices into a single story. The next sections unpacks the complex phenomenon to facilitate a better understanding of price signals.
Bolivia: the ‘coca boom’ of the 1980s
The dramatic coca price rises that brought Paulino Vasquez’s windfall cannot be understood as isolated from the serious crises engulfing Bolivia then. In 1980, Bolivia’s formal economy was collapsing due to the sharp decline in the global prices of its main exports, tin and gas, causing these industries to contract critically. Official unemployment jumped to 5.8% in 1980, increasing to 21% by 1985. With foreign currency running scarce, a balance-of-payments crisis was triggered. By 1984, almost half the value of exports (47.7%) went to servicing debt payments. As the financial crisis deepened, inflation started to spiral out of control and exceeded 8000 per cent by 1985 (Laserna Citation1995, 40–45). A sustained drought from 1983 further worsened conditions.
On top of these economic convulsions were political crises. Between 1978 and 1982, there were three general elections and ten presidential changes — four by a military coup, three by legitimate processes through Congress, and three by internal disputes in the Armed Forces (Laserna Citation1995, 31).
Yet as crisis after crisis overwhelmed Bolivia, coca production, intriguingly, was expanding. Coca production significantly increased, peaking in 1986–87, thereby acting, according to Painter, ‘as a huge social safety net, absorbing labour from the collapsed mining and industrial sectors, and replacing large portions of dollars previously generated by minerals, gas, and other exports’ (Citation1994, 54).Footnote6 Thus, as Laserna explains, the coca boom of the 1980s is characterised not only by the greatest relative increases in coca production volumes and incomes but also by the accelerated migration to the coca-growing Chapare, which saw its annual population growth rate rise from 3.48% in 1975–29.25% by 1980. As the coca boom tapered off by 1987, population growth fell back to 9.38% and settled at 1.2% by 1991 (Citation1995, 15–19).
Coca buffers the impact of hyperinflation
Laserna’s account serves to unpack the ‘mystery’ of prices. Although global demand played a role, the crisis conditions, he contends, primarily stimulated and initiated the coca boom. Because of the crises, growing coca for the illicit drug market made sense – like an emergency measure taken because nothing else was working. He further points out that ‘whether they were effectively protected, or they simply knew that the possibility of repression was minimal, the illegal purchasers of coca and coca paste exerted tremendous pressure on the coca market, forcing prices to rise rapidly and thus initiating the coca boom’ (Citation1995, 31, emphasis added). Actual actors with visible hands in real markets, rather than the invisible hand of supply and demand, were the main reasons behind the farmgate price rises.
Another significant contention is that the structural adjustment programme – implemented by 1985 to stabilise and control the economy – ‘rested in part on the clandestine coca economy’. As Klein (Citation2007) explained, structural adjustment was called ‘The Brick’ dropped on the heads of the Bolivian public because the package eliminated food subsidies, cancelled almost all price controls, hiked oil prices by 300 per cent, froze government wages, cut government spending, opened Bolivia’s borders to unrestricted imports, and downsized state companies in preparation for privatisation. Thus, hundreds of thousands of full-time jobs were eliminated and replaced with precarious ones without protections. Although hyperinflation was eventually tamed, Bolivians eligible for social security between 1983 and 1988 dropped by 61 per cent (Klein Citation2007, 142–150). Painter argues that coca and cocaine production provided critical, and perhaps decisive, support for the success of the stabilisation programme by absorbing, among others, the newly unemployed sections of Bolivia’s working class (Citation1994, 54), a point Laserna supports. In specific ways, coca growing became the new form of social security.
This cursory review clarifies that illicit or clandestine markets are real. Illicit economic activities are woven into the everyday activities of survival and development. They can generate productivity levels that can restructure a convulsing labour market, invite foreign currency, and give campesinos like Vasquez the economic windfalls that rarely come their way.
Ultimately, prohibition creates illicit markets. Remove prohibition, and Paulino’s transaction with the truck driver would be like exchanging pesos for coffee or tobacco. This is ironic because while prohibition is globally enforced by three UN treaties to ‘remove universal threats to development, prevent the erosion of social and human capital, and reverse corruption, governance failures, crime and violence’ (Ban Citation2012), the illicit enterprise targeted by prohibition may actually be a real solution to those threats to development and human capital. As shown above, illicit markets may also provide the means to tame crises or relieve pressures — not always, but at least sometimes — to allow national economies in crisis to restructure and recover.
Predictability amidst uncertainty
Another critical point is that Paulino grew coca not primarily because of so-called price signals, which are unpredictable at the best of times, but because of the assurance that there will always be coca buyers, unlike his other crops. For poor farmers whose survival depends on selling harvests on time, coca provides more predictability. Most of its plant species are hardy and, when mature, can be harvested every 2–3 months. It stores much longer and better than food crops, especially when transformed via rudimentary means into coca paste or base, which is also easier to transport. With these qualities and the assurance that there will always be buyers, coca growing becomes a risk-reduction or risk-spreading strategy. Despite being underground and illegal, the illicit coca trade ironically provided more predictability and reliability than Bolivia’s main exports and licit agricultural products subject to the vagaries of globalisation at that time.
The preceding discussion leads to at least three key inferences that often need to be included in conventional price analysis:
First, illicit crop markets bring a certain level of productivity. In the case of Bolivia in the 1980s, coca did not replace or destroy other crops, as usually happens in the expansion of commercial agriculture. Especially in the Chapare, coca was grown mainly as a supplementary cash crop rather than a dominant mono-crop – its growers also relied on rice, bananas, or citrus fruit. In addition, those who had no land or were only precariously employed found seasonal income as hired hands in coca paste production (Grisaffi Citation2015).
This character of coca leads to the second inference – that illicit crops, when widely produced, processed, and sold, can generate the income that can tame crises or relieve pressures. As Laserna and Painter documented, the coca trade generated many dollars lost with the collapse of the tin and gas industries – a primary reason for the hyperinflation.
Third and most importantly, coca growing provided predictability and reduced risks, as Paulino Vasquez experienced.
To further test these three inferences, the following sections examine whether similar patterns are evident in Myanmar, Colombia, and Afghanistan.
Myanmar: the 1989–1994 ceasefire agreements
The case of Myanmar from 1989 to 1994, when ceasefire agreements were signed, shows that the political and socio-economic contexts, not prices, shaped outcomes for the smallholder farming of opium poppy.
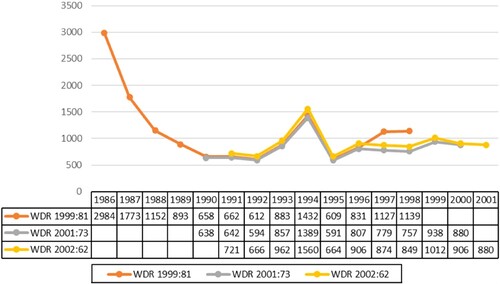
Price analysis is hampered by inconsistencies in the figures supplied by official sources. shows differing price estimates reported by four different UN documents. There are different understandable reasons for the disparities, including (a) the use of different conversion rates or base years; (b) the UNIDCP 1996 statistical table was drawn from US-administered surveys based on representative samples; and (c) there was no standardised reporting on illicit crop prices.Footnote7
Table 1. Different annual average farmgate prices of opium in Myanmar, 1986–2001 (in $/kg)
Politico-economic context before 1989
In 1989, Myanmar was the world’s largest producer and exporter of illicit opiates. The US government’s 1990 International Narcotics Control Strategy Report (INCSR) says combatting narcotics was a top Burmese priority from 1974 to 1988 because narcotics provided the financial means for insurgent groups to survive and purchase weapons. But after the 1988 mass demonstrations that rocked the country, leading to the installation of a new military regime, Yangon pursued a policy of détente in insurgent-controlled territories, where most of the opium crop was grown. This realignment of priorities led to pressure on opium producers and traffickers becoming almost relaxed. Consequently, the US expressed displeasure by decertifying Burma in 1989, making it ineligible to receive US aid (INCSR Citation1990, pp. 271–272).Footnote8
When the Communist Party of Burma (CPB), the largest insurgent group, splintered in 1989, Myanmar’s military quickly signed localised ceasefire agreements with the various factions. The CPB broke into four separate armies along ethnic lines: the United Wa State Army (UWSA) in the Wa Hills; the Myanmar National Democratic Alliance Army (MNDAA) in the Kokang region; the Shan State Army–East (SSA-East); and the New Democratic Army–Kachin (NDA-K) in northern Kachin State (INCSR Citation1990, 272; Meehan Citation2011, 382). Ceasefires were agreed upon from 1989 to 1994, reaching 22 by 1997.
Since the military coup of 1962 and the installation of a one-party state under the Burma Socialist Programme Party (BSPP), Yangon pursued poorly executed economic reforms and a largely self-imposed isolation that crippled foreign trade and disrupted the consumer economy. The worsening economic crisis, explains McCoy, contributed to the shift away from counternarcotics. One consequence is that opium exports and a thriving cross-border ‘black’ market expanded. In Shan State, smugglers carried opium to Thailand and, on their return, smuggled back consumer goods – from transistor radios, motorbikes, watches, and toothpaste – as well as weapons and ammunition (Citation2003, 367). Opium became the survival crop and principal income earner.
It was, in fact, the move to bankrupt smugglers that lit the fuse for the 1988 protests. In March, then-leader General Ne Win demonetised the kyat, the country’s currency, by removing key banknotes from circulation. But the move pushed inflation to around 30% and wiped out life savings, igniting widespread protests (Meehan Citation2011, 385). In July 1988, as the regime started to lose control, Ne Win was forced to step down, and a new military junta led by General Saw Maung, known as the State Law and Order Restoration Council (SLORC), assumed power. Elections held in 1990, won by Aung San Suu Kyi’s National League for Democracy (NLD), were not recognised by the SLORC. Consequently, international economic sanctions were imposed on Myanmar, further isolating its economy.
The US wanted Myanmar to continue fighting narcotics, but this clearly could not be prioritised as the military rulers were more concerned with diffusing threats, pacifying the borderlands, and stabilising the economy.
Myanmar’s opium areas in historical context (1985–2021)
Areas under opium cultivation in Myanmar more than doubled between 1987 and 1989, just before the ceasefires, and reached historical highs from 1989 to 1997 as counternarcotics pressures in the opium-growing borderlands were relieved. tracks the expansion and decline of Myanmar’s opium areas (in hectares), compared with Afghanistan, from 1985 to 2021. Data for this chart was assembled from statistical tables of various editions of the INCSR and WDR.
Figure 3. Area (hectares) under illicit opium cultivation, Myanmar and Afghanistan, 1985–2021 (Sources: INCSR and WDR, various years).
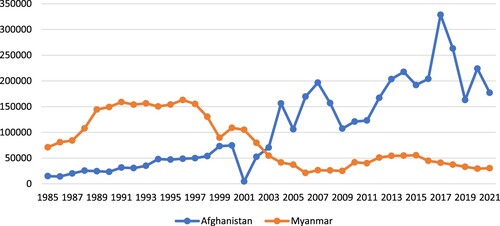
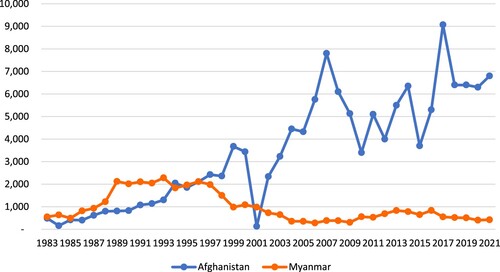
However, it must be noted that regarding production volume, Afghanistan overtook Myanmar in around 1996, at about the same time the Taliban first took power (). Because most of Myanmar’s opium-growing lands are on rain-fed hillsides, its harvests per hectare are typically four times lower than in Afghanistan, where opium is grown in the river valleys of Helmand and Kandahar that are crossed by irrigation canals distributing water from the Kajaki and Arghandab dams (WDR Citation2001, 6). In comparison though, Myanmar’s opium crop has a higher morphine content, making it three to four times more expensive.
Figure 4. Estimated production of opium (dried) in metric tons, Myanmar and Afghanistan 1983–2021 (Sources: INSCR and WDR).
Exploring explanations on the price changes
When the price data in Table-1 are plotted (), the divergences become obvious: between 1986 and 1990, there is a huge disparity in prices reported by UNIDCP-96 (blue line) and WDR-99 (orange line), and between three of the documents from 1996 to 2001. However, there are similarities too. Between 1990–1996 – a period covering the ceasefire years – all four documents have virtually parallel tracks (mostly U-shaped): between 1990 and 1992, prices went down; it went up again from 1993 to 1995; and dipped from 1995 to 1997.
Figure 5. Comparison of farm-gate prices ($/kg) of dried opium in Myanmar as reported in four separate UN documents, 1986–2001.
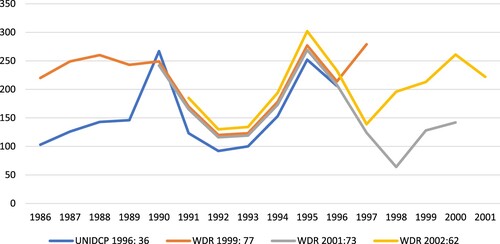
Key events somehow coincided with the price changes: ceasefires were signed when prices declined in 1990–1993. Then in December 1993, the Shan State National Congress and its 20,000-strong Mong Tai Army (MTA) convened in Homong to proclaim independence and acclaim warlord and drug trafficker Khun Sa as their leader. Prices are observed to rise. Shan independence, however, drew Yangon, Bangkok, Beijing, and Washington into an ad hoc but powerful alliance (McCoy Citation2003). In late 1994, Myanmar’s army, re-equipped with arms from China, mobilised 10,000 troops for three massive dry-season offensives, with support from UWSA that had become Khun Sa’s main drug competitor by then. Prices are observed to fall.
By early 1996, Khun Sa buckled. As thousands of MTA soldiers surrendered, Khun Sa appeared to have struck a deal – he and his aides were welcomed to Yangon by the SLORC as ‘our own blood brethren’. He subsequently retired to a luxurious lakeside villa with his wives, a neighbour to General Ne Win (McCoy Citation2003, 435–439). An outraged US government not only demanded that the SLORC turn over Khun Sa so he could be tried for drug offences but also imposed further economic sanctions (Martin Citation2012). Khun Sa kept his villa and lifestyle until he died of old age in 2007.
To summarise, although it is difficult to state what affected prices before and after the ceasefires conclusively, the notion that farmgate prices result from market behaviour shaped by the ‘invisible hand’ may be ruled out. Farmgate prices emerge less as signals for market decision-making and more as indicators of the impact of the precarity that poor opium-growing households face in their political and social contexts. As further elaborated by Meehan (Citation2021), efforts to reduce opium prices to induce farmers to switch to other crops do not provide ‘opportunities’ but slash the key safety net many farming households rely upon.
Colombia: the 1996 Cocalero uprising in the Amazonias
In March 1996, the US made Colombia ineligible to receive US aid and preferential trade benefits despite the intensification of coca eradication in the first half of the 1990s. It was a punishment for President Ernesto Samper, elected in 1994 and subsequently accused of and investigated by the Colombian Congress of knowingly taking millions in contributions from the Cali cartel. The decertification, among others, meant suspending between $750 million and $1 billion in US Import-Export Bank commitments, $50 million in loans, and $540 million in insurance from the Overseas Private Investment Corporation (New York Times, 2 March Citation1996).
To reverse decertification, Samper ratcheted the drug war further. Aerial fumigation was expanded and intensified in the Amazonias – the southern provinces of Amazonas, Caqueta, Guaviare, Putumayo and Vaupes that comprise more than a third of Colombia's territory. Controls were tightened on the sale of cement and gasoline (used for processing coca). Samper's heightened eradication triggered what Ramirez documented as the ‘Cocalero Uprising’, when up to 200,000 subsistence cocaleros in Putumayo, Caqueta and Guaviare, including women, children and indigenous people, held marches to the nearest towns from July to August 1996 to protest the heightened threats to their health and livelihoods (Citation2011, loc. 229).Footnote9 Riots ensued, with up to seven farmers killed in clashes between protesters and security forces in capital towns. The biggest rebel group, the FARC (Spanish acronym of Revolutionary Armed Forces of Colombia), subsequently launched offensives in September, resulting in at least 130 Colombians dead and half the country paralysed as overland transport was halted (Los Angeles Times, 22 September Citation1996).
Colombia's experience before and after the 1996 Cocalero Uprising provides further conclusive evidence that non-price attributes are why smallholders turn to coca for coping and survival. While coca-base prices fell steeply from 1986 to 1992, coca cultivation expanded, contrary to price theory. Moreover, as the war on drugs gained the upper hand against the drug ‘cartels’ from 1992 until 1994, the increase in cultivation continued while coca-base prices nearly trebled. Other factors, therefore, appear to be at work – which plausibly includes land dispossession and displacement – in driving the peasants’ decisions to grow coca. The following section goes into greater detail on these other factors at work.
Prices in the world’s largest producer of coca and cocaine
A collection of coca-base prices in Colombia in 16 years from 1986 to 2001, drawn from three different UN documents, shows different figures (). However, plotting the data reveals more uniformity – there are differences, but overall, the lines are close and parallel to each other – slight variances appear due to different base years and conversion rates used. WDR 1999 (orange line) largely accords with the other two, with a deviation only from 1996 to 1997.
Figure 6. Different coca base prices (US$/kg) in Colombia, 1986–2001.
Note: These are prices of coca base. Coca processing involves turning the leaves into paste, often done in the fields to cut on costs of transport. The paste is then converted into a more concentrated coca base, which may then be brought to makeshift labs near rivers or beside airstrips for further processing into cocaine (DEA, February 1991).
Questions for are: What accounts for (a) the sharp decline in coca-base prices from 1986 to 1992; (b) the increase from 1992 to 1994; (c) the steep fall from 1994 to 1995; and (d) the general level movements after 1996, following the Cocalero Uprising?
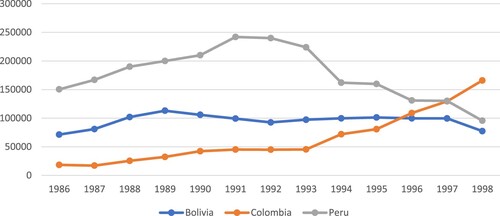
Colombia became the world’s largest coca and cocaine producer in the period covered by . As shown by the orange line below in , from 1986 to 1992, when prices were steeply falling, Colombia’s coca production volume steadily increased and had more than doubled by 1992. From 1993, coca production continued a sharp rise despite fluctuations in prices. compares Colombia’s coca production with Peru and Bolivia and shows that in 1997, Colombia had overtaken the other two countries.
Figure 7. Comparison of coca production in Bolivia, Colombia and Peru, in metric tons, 1986–1998 (source: WDR Citation1999: 42)
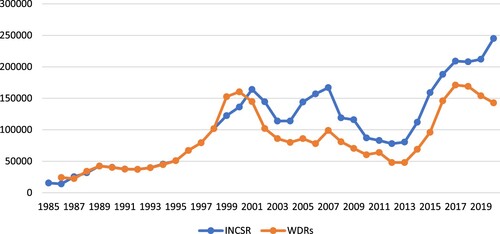
tracks Colombia’s rise as the world’s principal coca grower over a wider period, from 1985 to 2020, in terms of areas (hectares) under cultivation. It shows that hectarage generally increased when prices fell from 1986 to 1992. This increase in hectarage continued from 1992 to 2001 when coca base prices fluctuated. Plotted in are figures from two official sources: the INCSRs of the US (blue line) and the WDRs of the UN (orange line). The figures are similar from 1987 to 1998 but started to diverge thereafter. Since 2001, INCSR figures have been consistently higher. The differences appear to reflect different methodologies used. Nevertheless, both INCSR and WDR affirm that since 1999, Colombia has been the world’s top cultivator of coca and producer of cocaine.
Figure 8. Area under coca cultivation in Colombia (hectares), 1985–2020, as reported separately by annual WDRs and INCSRs
Politico-economic context alongside growth in coca and cocaine production
At least three key developments coincided with the expansion of Colombia’s coca-growing areas from the early 1990s. First was the intensification of the US-led war on drugs from 1989 to 1995 that led to the killing, capture, or extradition of drug cartel leaders (including Pablo Escobar, killed in December 1993) and, ultimately, the dismantling of the Medellin and Cali cartels and their associated licit businesses (New York Times, 20 December Citation1994, 27 June Citation1995, 6 August Citation1995).
Second, land conflicts, particularly in the northern provinces, intensified from 1985 to 2001, leading to massive human rights violations, land dispossession, and displacement of small peasant farmers. In the Uraba area, for example, more than 20 kidnappings and massacres of dozens of agricultural workers and union organisers occurred between 1988 and 1990 and continued to cast fear thereafter (CorteIDH, Citation2006). The violence appears to have been triggered by the scramble for land caused by the consolidation of commercial agriculture and banana contract farming; the shift to cattle-raising in certain areas to hold and claim the land as values rise; and the dramatic rise in property values along new highways – resulting in the weakest and least protected being violently dispossessed and displaced (Gutierrez Sanin Citation2019; Ballve Citation2012; Gootenberg and Davalos Citation2018).
Third, key actors, including entrepreneurs in violence, emerged from the land conflicts. Left-wing rebel groups, like the FARC and the ELN (National Liberation Army), cast their lot with displaced peasants on the one hand. On the other were paramilitaries, like the cattle-owning Castaño brothers, who came to dominate Uraba militarily and then mutated into criminal entrepreneurs who became the local partners of indirect rule by the central state (Gutierrez Sanin Citation2019; Grajales Citation2015). This configuration led to the emergence of a constructed ‘narco-frontier’ or the depiction of these spaces as ‘lawless’ or ‘stateless’ in ways that distort the understanding of its ongoing dynamics. As explained by Ballve (Citation2019), contrary to portrayals of ungovernability, these areas have extra-legal regimes of rule in which the state is simply one actor among others. Goodhand (Citation2021) points out that automatic depictions of lawless, violent, and marginal frontiers undermine the need to confront the underlying power relations and vested interests that drive the violence and socioeconomic restructuring and hence impede efforts towards a more sustainable and spatially inclusive peace.
The decline of coca areas from 2001–2004 () is worth some focus. This period was also when serious rifts emerged among the paramilitaries, such as Carlos Castaño’s rejection of Plan Birmania and his bitter public split from the paramilitary alliance Autodefensas Unidas de Colombia (AUC). Plan Birmania (Spanish for ‘Burma Plan’) was a plot to create an alliance of drug traffickers, paramilitaries, and politicians – apparently inspired by the paramilitary experience in Myanmar where militias were given leeway to make money from illicit drug crops (opium) in return for their participation in counterinsurgency operations (UPI Español, February Citation2007; Semana, August Citation2007). Carlos rejected the plan because, apparently, he objected to criminal drug traffickers leading the right-wing political movement he was helping build. By 2002, Carlos was negotiating with the national government for the demobilisation of paramilitary units he helped create. Carlos is believed to have been killed in April 2004, apparently on orders from his own brother, the criminally-inclined Vicente (McDermott Citation2008).
Colombia’s experience is a local version of the empirical puzzle – it rose to become the world’s leading coca grower and cocaine producer amidst the long-term decline in the prices of cocaine in the US and Europe. Despite falling consumer prices and intensifying wars on drugs, coca cultivation was, curiously, expanding. Successive INCSRs from 1985 to 2000 declared that ‘the operations of the country’s cocaine mafias have been thrown into disarray’ or that ‘a number of major traffickers are on the run’ (INCSR Citation1996). Yet, coca areas were increasing, implying that eradication was failing. It is evident that decisions – like escalation and continued counternarcotics funding from the US Congress – were being made despite the evidence reported.
In 1994, Colombia ratified the 1988 UN Convention Against Illicit Traffic in Narcotic Drugs and Psychotropic Substances, making drug trafficking formally a criminal offence, allowing the confiscation of proceeds from drug offences, and enabling the seizure of associated bank, financial and commercial records. It became the legal basis for the escalation of the war on drugs. Also approved was the aerial application of the herbicide glyphosate – by November 1994, national police units were spraying known coca-producing areas (INCSR Citation1996, Citation1997). Policymakers believed that using force was sufficient to destroy the underlying labour and production networks, business structures, and supply chains of the illicit cocaine trade.
Cocalero displacement in the southern provinces
This examination reveals that despite falling global prices and the intensification of eradication to the point that it triggered an uprising, the areas under coca cultivation in Colombia did not decrease but instead continued to expand.
Salgado (Citation2012, 2–3) explains that the sparsely-populated areas of the Amazonias absorbed peasant colonos– those expelled or displaced from other territories due to agribusiness expansion, violent conflict, or political persecution who, for one reason or another, did not choose to relocate to urban centres. It is not well-known outside Colombia that the country had the most internally displaced people (IDPs) worldwide before the Syrian conflict. In March 2018, Colombia's internal refugees were estimated at more than 7.6 million, or about 15.30% of the country's population. Footnote10
The ‘colonised’ frontier territories, emphasises Salgado, are not ‘spontaneous settlements’ that result from normal economic growth or expansion. Rather, these are territories that marginalised peasants forcibly uprooted from elsewhere identify with to find refuge and rebuild livelihoods. Having no legal titles and often settled in remote areas and forest reserves, colonos survive the conditions of a ‘rearguard economy’ — no protection from state institutions; with little or no access to public services like health, education, electricity or water; located far away from market centres; vulnerable to commodity price fluctuations; and with no access to bank credit for the crops they are used to growing (plantain, corn, or rice). In other words, they were generally excluded from commercial and consumer networks. It was against this background that coca farming came to the Amazonias.
To the colonos, growing coca as a cash crop to supplement the food crops they grew made sense given the conditions of precarity they faced, explains Ramirez. As a hardy plant, the coca bush is ideal for peasants without land security. Drug traffickers appear to have provided the colonos with the coca seeds and chemicals to process coca leaves into a paste. These traffickers then bought the paste themselves, often bartering goods such as food and clothing at good prices (Citation2011: loc. 880), saving the peasants the prohibitive costs of transport and, at the same time, giving them easy access to food and other consumer necessities. In other words, through the coca trade, colono communities excluded from markets and commercial networks were reconnected back to those markets and networks. Following Ramirez, the problem to solve, therefore, is not peasant colonos growing an illicit crop but the marginalisation and exclusion that made it inevitable for displaced and dispossessed peasants to turn to an illicit crop to cope, survive, and reduce risks.
To end the Cocalero Uprising of 1996, some protesting farmers tried to negotiate a solution, mainly by offering to voluntarily eradicate their coca crops for a fee, thereby avoiding the more harmful aerial fumigation. They also sought price guarantees on alternative crops they might grow instead, emphasising that survival is behind the push to grow coca, not criminality or taking advantage of high cocaine prices (which was historically declining in its consumer markets after all). The government refused (ibid.).
Political theatre is also relevant. Samper's intensification appears less due to strategic consideration and more dictated by his need to display stronger counternarcotics credentials to the US. When Colombia was decertified, the big ‘cartels’ were already routed, so the ostensible targets were poor cocalero peasants who could barely defend themselves. US policymakers found themselves in a conundrum – the big men and the drug cartels were already destroyed, yet areas under coca cultivation continued to expand. Their solution was the escalation of eradication. As such, when aerial fumigation was systematically introduced and intensified, triggering the Cocalero Uprising, US decision-makers were kept on side. US President William Clinton eventually applied a waiver, again making Colombia eligible for US funding and support.
The Cocalero Uprising and the Cocalero identity established are an important legacy of an unprecedented political mobilisation in defence of land, livelihoods, and health triggered by unparalleled attacks on the livelihoods of poor and displaced peasants.
Afghanistan: the 2000–2001 Taliban opium ban
The opium ban enforced by the Taliban in Afghanistan from 2000 to 2001 best illustrates how political signals and developments are important drivers of price changes – i.e. that prices are more a consequence and less a cause of outcomes in highly-fluid and complex markets.
, which presents the monthly monitoring of dry opium prices from March 1997 to December 2002 in the opium markets of Nangarhar and Kandahar, shows that Kandahar’s prices have mostly always been lower than Nangarhar’s. In September 1997, dry opium was selling for US$33/kg in Kandahar, almost three times less than the US$97/ kg it was selling in Nangarhar. This pattern generally continued until June 2000, when dry opium prices were at the lowest at US$31/kg in Kandahar and US$38/kg in Nangarhar.
Figure 9. Price tracking of dry opuim prices (US$/kg) in Nangarhar and Kandahar, March 1997 to December 2002 (Source: Afghan Opium Survey 2002 and 2003)
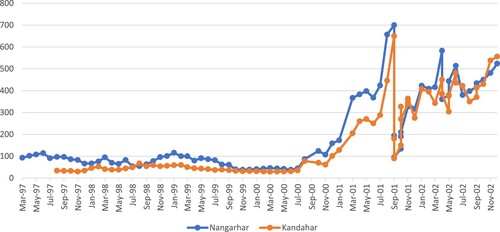
Prices started rising in July 2000 after Taliban leader Mullah Omar issued a fatwa (religious decree) that opium production violated fundamental Islamic tradition. The fatwa, rather than actual reductions in supply, initially triggered the price increases. Even if there were removals of opium stocks from the market as the ban took effect, or hoarding took place in anticipation of supply reductions, the price rises were almost automatic and too soon. In addition, opium is a winter crop typically planted in December and harvested in March, which meant that the fatwa declared in July would not have had any immediate impact on aggregate supply yet as the opium crop due for March 2001 still has not been planted.
Prices rose dramatically until 10 September 2001, when they peaked at US$700/kg in Nangarhar and US$650 in Kandahar – an almost 20-fold increase in 15 months from June 2000. By this time, the price rises may be accounted for by the accumulated impact of the fatwa and actual depletions in supply. However, the following day, the 9/11 attacks on US territory happened. Immediately, prices dropped steeply to US$95/kg in Nangarhar and US$90 in Kandahar. Clearly, the dramatic price movements of September–October 2001 were shaped more by political developments and less by the law of supply and demand and intermediation. Before the year ended, prices rose again and generally stayed high, but still well below the peak on 10 September 2001.
Politico-economic context of the ban
On 13 December 2000, at a US House Judiciary Committee hearing, the State Department Coordinator for Counterterrorism Michael Sheehan brushed aside the opium ban and said the Taliban, which took power in late 1996, was responsible for Afghanistan’s emergence as the world’s leading producer of opium. ‘Narcotics-linked income’, said Sheehan, ‘strengthens the Taliban’s capacity to provide support for international terrorism, buy weapons, fight opposition groups, and maintain control of territory where training camps are located’ (Statement, House Judiciary Committee).
Richard B. Scott, an engineer and former USAID employee living in Helmand whom the Taliban authorised just two years earlier to oversee the desilting of a central irrigation canal, was incredulous. In an email to Sheehan, Scott called for the opium ban to be supported, asserting that the only way opium production may be countered is by fully rehabilitating Helmand’s irrigation system so farmers could return to their double-cropping system with cotton and food crops. He wrote and actively lobbied other US officials, including the chief of intelligence at the Drug Enforcement Administration, to support the ban. Scott was ignored; subsequent US bombings caused further damage to the central canal (Scott, 17 December 2000).
The inaction of American officials stemmed from a strategic dilemma: while the Taliban could indeed be allies in the war on drugs, they were the targets of the war on terror. The two wars – on drugs and terror – cancelling each other out has been a recurring theme bedevilling US policy. In Laos and Thailand, hill tribes that were US allies in the war on communism were also the main opium and heroin producers (McCoy Citation2003). In Bolivia, top drug lords extradited to the US in the 1980s had to be released because they turned out to be CIA assets in the Guerra Sucia (Dirty War) (Levine Citation1993). In Afghanistan, the DEA’s intelligence chief initially acknowledged the ban to be a successFootnote11 but eventually changed the narrative by saying the ban was just a ploy to get good PR for the Taliban and harvest windfall profits from price rises of (allegedly) stockpiled heroin (DEA, 5 December 2001).
The extent of the ban’s success was laid bare when an evaluation conducted by Western experts and published in 2004 by the International Journal of Drug Policy reported ‘a 99% reduction in opium poppy farming in Taliban-controlled areas.’ The evaluators checked if perhaps drought, migration, or changes in the global opium market may be contributing factors to the reduction. The evidence was conclusive: the reduction was entirely due to enforcement action by the Taliban. The ban, therefore, said the authors, ‘may have been the most effective drug control action of modern times’ (Farrell and Thorne Citation2004, 81).
Consequences of the ban
UNODC officials – who pursued a foot-in-the-door policy that encouraged the Taliban to enforce the ban by offering international recognition and development aid – naturally regarded the ban’s success as a significant contribution (Farrell and Thorne Citation2004, 84). However, Sandeep Chawla, then head of UNODC’s research, also qualified that ‘in drug control terms it was an unprecedented success but in humanitarian terms a major disaster’ (TNI, Citation2001, 17).
One of the most dramatic consequences of the ban was the breakdown of the salaam, the informal credit system upon which many poor farmers relied for survival (Jelsma Citation2005, 98). Mansfield confirms that the salaam system came under considerable stress and highlighted that the ban, along with the eradication campaigns of 2002 and 2003, were the major causes of accumulated debt that resulted in many households becoming so deeply indebted that they had to sell their long-term productive assets – land and labour – and even their daughters (called ‘opium brides’) to pay their debts. Mansfield cited the case of a barber from Achin who took an advance payment of US$400 on four kilograms of opium to pay for the treatment of his sick father. Because of the opium ban, he could not pay the debt, which ballooned to US$7200 after three years. With the mediation of the local jirga, it was decided that the barber would give his daughter to the lender against US$3200 of the loan and mortgage two jeribs of his land against the remaining US$4000 (Mansfield Citation2004).
Opium cultivation, states another expert, Adam Pain, is more debt-relieving than debt-creating, and the rise in the costs of credit was determined more by instability and economic risk (Citation2008). This benefit from opium made the breakdown of the salaam more painful – many indebted farmers who defaulted on their opium loans became refugees who moved to Iran or Pakistan. Moreover, accumulated debt forced the return of opium cultivation with a vengeance. In subsequent years, heavily indebted households had no choice but to grow opium despite the risks of eradication and arrest. Jelsma concludes that the short-lived drug control ‘success story’ of the opium ban can also enter history ‘as one of the most blatant examples of a humanitarian crisis being consciously aggravated under the guidance of a UN agency’ (Citation2005, 98) intent on sustaining the UN General Assembly’s determined pursuit of a ‘drugs-free world.’
How data aggregation changes the picture
However, note that a different picture emerges when price movements are aggregated and averaged into a single figure for a year, then plotted for long-term trends. shows that the peak price of US$700/kg mentioned in disappears when averaged over the entire year of 2001 – the resulting single figure (US$301/kg) hides in-year sharp price movements. When average annual prices are plotted yearly from 1986 to 2018, the prices before 2001 rarely went higher than $70/kg and were, in fact, lowest at a weighted national average of $30/kg in 2000. Prices increased tenfold to an average of $301/kg in 2001, peaked at $425/kg in 2003, and then dropped sharply to $142/kg in 2004.
Figure 10. National weighted average annual prices (US$/kg) of dry opium in Afghanistan, 1986–2018 (Source: WDR various years)
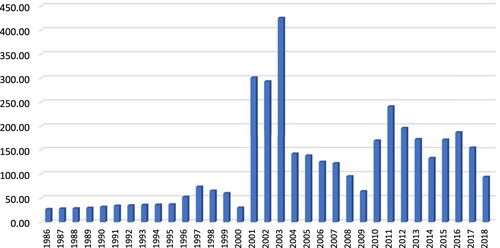
By any measure, the 2000–2001 opium ban affected an increase in dry opium prices. However, measuring impact only in terms of a shift in the so-called supply curve would be short-sighted. and thus show that supply availability offers only a limited explanation for price changes; political signals and developments are also important drivers, and ways of reporting (aggregation) may hide significant movements. More importantly, the impact should be measured in terms of indicators of precarity, i.e. the breakdown of the informal credit system, increased indebtedness resulting in forced sales of assets or fleeing to become refugees, and the further entrenchment of dependence on illicit crops in the local economy (Mansfield Citation2006; and Jelsma Citation2005).
Conclusion: tackling tensions and trade-offs
Although vilified as ‘evil’ in the preamble of the 1961 UN Single Convention on Narcotic Drugs and classified by a UN Secretary-General as a ‘universal threat to development’, the illicit drug crops opium and coca paradoxically provide an incredibly reliable strategy that helps smallholders to survive, if not thrive, under the conditions of severe precarity and uncertainty. This ability lies less in these crops’ prices, which are ironically increased by prohibition, but more in their under-observed attributes as easy-to-grow plant crops and versatile objects of trade.
Opium and coca are hardy and resilient plants that can be grown and harvested quickly on marginal land by displaced and dispossessed peasants who do not have land security, protection from state institutions, and the benefits of public services. Growing them enables its poor growers desperate for credit to access loans that they would be otherwise unqualified to receive had they been growing regular crops instead. These illicit crops can be processed using backyard means into low-volume, low-weight, high-value, and significantly less-perishable products than most cash crops, making it ideal for growing where weather and water patterns are erratic, roads are bad or non-existent, and located far away from market centres. In their semi-processed form, these crops also serve as insurance – goods kept under the bed to be sold during emergencies. But most importantly, these crops will be grown because there is always an assurance that they will be sold or traded for consumer items like cooking oil, sugar, or salt, especially when prices fluctuate. These attributes explain why illicit crop cultivation continues and expands, despite prohibition.
The three important inferences about illicit crop markets are affirmed in this paper. First, although the trade in illicit crops may be banned and illegal, it can stimulate productivity. It would deliver incomes to poor and marginalised households, thus enabling survival under conditions of precarity. Second, illicit crop markets, though typically associated with illegality, violence, and conflict, can also be a source of order – they tamed economic crises and relieved pressures from convulsing local economies and played a crucial role in pacifying borderlands. Third, it provides some form of predictability. Growing it, therefore, especially when faced with the threats and vagaries of globalisation, is a risk reduction or risk-spreading strategy.
The remarkable resilience of illicit crops to prohibition shows that the usual ways of tackling the problem – for example, the reliance on price theory to identify and exploit ‘weaknesses’ of illicit crop markets or the single-minded use of coercion or state power alone to enforce eradication – need to be radically rethought and reconsidered.
There is no dearth of developing new approaches. Bolivia, for example, has led in this regard with its highly nuanced slogan, ‘No to cocaine, yes to coca’. Many development agencies and governments have experimented with different forms of Alternative Development. Another is simply replicating what illicit markets provide – protection to the unprotected, credit to the uncreditworthy, or market access to the excluded.
The problem is that many assumptions remain unchallenged. Single-disciplinary models that tend to obscure rather than clarify – like price theory – remain dominant in developing policy responses. The disconnects between various approaches – for example, how counternarcotics campaigns may eradicate illicit crops along with informal credit systems upon which many survive – tend to be swept under the carpet rather than confronted. The role of licit markets and development in inadvertently displacing the weakest and least protected remains largely ignored. Relationships of conflict and accommodation with and between ‘unusual actors’ – such as allies in the war on drugs who are targets of the war on terror, and vice-versa – become de facto quid pro quos rather than strategically directed.
Price theory has been refuted particularly by scholars of agrarian studies. Harriss-White (Citation1999) highlights that the focus on the price performance of licit crops privileges production at the expense of exchange relations or the ‘visible hands’ that structure actual market outcomes. Another critique is how efficiency trumps complexity in mainstream market analysis. Real agricultural commodity markets, point out Ali Jan and Harriss-White (Citation2012), are complex systems of efficiency, extraction, and exploitation, and emphasise the need for more studies on issues like the control of labour processes, flows of money, and state and non-state regulative practices. In examining criminal political economies in South Asia, a group of scholars points to the need to unpack the ‘crime-business-politics nexus’ in which the world of crime is deeply entangled in assemblages – a messy bundle of social relations and variously structured components in states and markets (Harriss-White and Michelutti Citation2019, 323).
One way of starting a rethink is by tackling the fundamental tensions and trade-offs – or the ‘trilemma’ as the Drugs and (dis)order Project puts it – between drugs, development, and peacebuilding policies (Goodhand et al. Citation2021). The trilemma emphasises that tensions exist and need to be recognised – for example, market-led rural development also creates conditions of precarity that leave marginalised and excluded communities with no choice but to rely on illicit crop cultivation for survival; or that the enforcement of prohibition can undermine fragile peace processes. Trade-offs will therefore be inevitable, especially where ‘perfect storms’ – the combination of multiple crises of poverty, conflict, corruption, criminality, and climate change – run. Rather than deny, ignore, or forget, the tensions and trade-offs need to be confronted.
Another is by considering that illicit crops and their products move through a commodity chain, where different supply and demand layers emerge at each chain link or level. Thus, rather than reduce complexity into the single, all-encompassing model of price theory, a multi-layered alternative is needed to make it possible to visualise a more composite image of the general structure of the illicit drugs industry.
Discarding certain narratives or imaginaries that structure understanding would help. A key imaginary that should be done away with is the ‘ungovernable’ and ‘stateless’ ‘narco-frontier’ that is sometimes exaggerated into the term ‘narco-state’ by many mainstream analysts and prohibition advocates. As Goodhand (Citation2021) explained, this imaginary performs a specific ideological function – to sustain the idea that the use of force and state power alone is the solution to the problem of illicit drug crops at the expense of policy responses rooted in more interdisciplinary approaches.
Undiscriminating imaginaries create not only conceptual stretching but also harmful logical leaps. An example comes from as early as INCSR 1986, which uncritically attributed opium price rises in the early 1980s to weather changes. A 1980 survey by Thailand’s Office of the Narcotics Control Board (ONCB) tracked how opium prices climbed rapidly after the drought of 1979 and 1980, pushing opium prices up to as much as US$500/kg, more than ten times its lowest rate in previous years. The price increases, in turn, is said to have incentivised significant opium production in 1981 (INCSR Citation1986: 228). The implied conclusion is that the drought caused the price increase, and opportunistic opium farmers gained the windfall.
Opium, however, is not a lucrative crop to poor peasants in the Golden Triangle, asserts experts like McCoy (Citation2003) and Lintner (Citation2000) – they grow it mainly as a dry season crop to supplement the rainy season’s upland rice crop. Thus, the drought may have affected the rice crop, but less so the opium crop. Opium is also grown because of its small bulk, storability, and stability of value. To poor peasants, opium is a medium of exchange, like currency, that can be drawn on in times of need (INCSR Citation1986: 218). Thus, opium prices remained low and stable for its growers. At the same time, it sharply increased on the Thai border due to the ‘visible hand’ of middlemen, primarily ethnic Chinese traders, who procured opium from farmers and then supplied them with trade goods in exchange (ibid.).
In Afghanistan, official explanations have been criticised for being ‘economical with the truth’. All too often, Mansfield states, opium cultivation is seen merely as a function of prices, such as when officials made the quick conclusion that more opium would be grown in 2004 because prices had breached US$400/kg while the prices of other crops – e.g. wheat, onions, and tomatoes – were way too low. Mansfield’s key point is that households decide on how much land to allocate to wheat, not because of market prices but based on estimates of water availability. Wheat will be planted if water is expected to be sufficient; if water is scarce, then the land is better allocated to grow the more drought-resistant opium poppy instead. Other fieldwork suggested that even if opium prices were high, households would still favour wheat cultivation if they feared they could not purchase it on the open market (Mansfield Citation2007).
It is also essential to consider that income has many faces – cashless incomes are possible in local economies where illicit crops are grown. As already stated, opium is considered insurance ‘money‘ to be used in emergencies. Coca-paste and base have been used as payments for labour in cash-starved and infrastructure-scarce coca-growing areas of southern Colombia. Credit may also be viewed as a form of income.
In other words, growing illicit crops is more than just about earning income from high prices. Growing illicit crops is a way to minimise risks, preserve the value of labour, access credit, or prepare for future risks. Because illicit crop cultivation occurs mainly in marginalised and excluded local economies, tying its benefits solely to income realised through cash and measured by prices precludes an understanding of how and why it becomes a mechanism for coping and survival.
Conventional policy responses need rethinking. Moving away from the ‘invisible hand’ to the more measurable ‘visible hands’ requires the underlying relations of exchange and accumulation in illicit crop markets to be similarly monitored and documented in the statistical tables reported each year by the INCSRs and WDRs.
Disclosure statement
No potential conflict of interest was reported by the author(s).
Correction Statement
This article has been republished with minor changes. These changes do not impact the academic content of the article.
Additional information
Notes on contributors
Eric D. U. Gutierrez
Eric D.U. Gutierrez is a practitioner-scholar with 25 years of research experience and field-based work with NGOs investigating precarity, disturbance, and indeterminacy in the Global South. He received his PhD (cum laude) from ISS-Erasmus University Rotterdam for the dissertation ‘Criminals Without Borders: Resilience and Interdependency in Opium and Coca Commodity Chains’. A Philippine national with residency in Germany and the UK, he has written on corruption, governance, and the conflict in the southern Philippines.
Notes
1 From the 1995 PhD Dissertation of Bolivian economist Roberto Laserna, who interviewed Vasquez and other coca farmers in his fieldwork.
2 Based on US Treasury exchange rates of US$1 = 24.97 Bolivian pesos on 31 March 1980).
3 The Drugs and (dis)order Research Project (2018 to 2022), led by SOAS-University of London, was funded by the UK’s Global Challenges Research Fund (GCRF) to answer the question ‘How do war economies transform into peace economies?’ For more details, see https://drugs-disorder.soas.ac.uk/
4 See, for example: Goodhand et al. (Citation2021); Meehan (Citation2021); Acero and Machuca (Citation2021); and Gutierrez (Citation2021) and Gutierrez (Citation2020).
5 The prices quoted throughout this paper are transformed into their US dollar equivalent for easy comparison. The UN monitoring system also uses the US dollar as the standard currency when reporting the relevant figures.
6 Painter was the BBC’s Bolivia correspondent in the 1980s.
7 Note: All data tables and graphs in this paper are presented with full details at the end.
8 Annual INCSRs were submitted to the US Congress beginning around 1986. Among others, INCSRs assess whether countries receiving US aid comply with international drug control treaties. Non-compliant countries are decertified. Further note: the US consistently uses ‘Burma’ and ‘Rangoon’.
9 Some early versions of an e-book application do not state the pages but instead states the ‘location xx of xxxx', hence the use of ‘loc.’ In the citation.
References
- Acero, Camilo, and Diana Machuca. 2021. “The Substitution Program on Trial: Progress and Setback of the Peace Agreement in the Policy Against Illicit Crops in Colombia.” International Journal of Drug Policy 89. doi:10.1016/j.drugpo.2021.103158.
- Ali Jan, Muhammad, and Barbara Harriss-White. 2012. “The Three Roles of Agricultural Markets: A Review of Ideas About Agricultural Commodity Markets in India.” Economic and Political Weekly 47 (52): 39–52. http://www.jstor.org/stable/41720550.
- Ballve, Teo. 2012. “Everyday State Formation: Territory, Decentralization, and the Narco Landgrab in Colombia.” Environment and Planning D: Society and Space 30 (4): 603–622. doi:10.1068/d4611.
- Ballve, Teo. 2019. “Narco-frontiers: A Spatial Framework for Drug-fuelled Accumulation.” Journal of Agrarian Change 19 (2): 211–224. doi:10.1111/joac.12300.
- Ban, Ki-Moon. 26 June 2012. “Remarks to the General Assembly's Thematic Debate on Drugs and Crime as a Threat to Development.” https://www.un.org/sg/en/content/sg/speeches/2012-06-26/remarks-general-assemblys-thematic-debate-drugs-and-crime-threat.
- Byrd, William A., and Olivier Jonglez. February 2006. “Prices and Market Interactions in the Opium Economy” Chapter 5 in Duddenberg and Byrd (editors), Afghanistan’s Drug Industry: Structure, Functioning, Dynamics, and Implications for Counter-Narcotics Policy. UNODC and World Bank, https://www.unodc.org/pdf/afg/publications/afghanistan_drug_industry.pdf.
- CorteIDH (Inter-American Court of Human Rights). 31 January 2006. “Case of the Pueblo Bello Massacre v. Colombia.” http://www.corteidh.or.cr/docs/casos/articulos/seriec_140_ing.pdf.
- Farrell, Graham, and John Thorne. 2004. “Where Have All the Flowers Gone? Evaluation of the Taliban Crackdown Against Opium Poppy Cultivation in Afghanistan.” International Journal of Drug Policy 16: 81–91. doi:10.1016/j.drugpo.2004.07.007.
- Goodhand, Jonathan. 2021. “Beyond the Narco-Frontier: Rethinking an Imaginary of the Margins.” International Journal of Drug Policy 89. doi:10.1016/j.drugpo.2020.103045.
- Goodhand, Jonathan, Patrick Meehan, Jasmine Bhatia, Maziyar Ghiabi, and Francisco Gutierrez Sanin. 2021. “Critical Policy Frontiers: The Drugs-Development-Peacebuilding Trilemma.” International Journal of Drug Policy 89. doi:10.1016/j.drugpo.2021.103115.
- Gootenberg, Paul, and Liliana M. Davalos, eds. 2018. The Origins of Cocaine: Colonization and Failed Development in the Amazon Andes. London and New York: Routledge. E-book copy on Bookshelf.
- Grajales, Jacobo. 2015. “Legalising the Illegal in Colombia: Criminals as Political Actors.” In Drugs and Illicit Practices: Assessing their Impact on Development and Governance, edited by E. Gutierrez. London: Christian Aid. https://www.christianaid.org.uk/sites/default/files/2017-08/drugs-illicit-practices-impact-development-governance-october-2015.pdf.
- Grisaffi, Thomas. 2015. “The Cato Accord: Bolivia’s Humane and Effective Approach to Control Coca Cultivation.” Paper presented at the 11th Mercosur Anthropology Congress, Montevideo, Uruguay. http://discovery.ucl.ac.uk/1474403/1/Coca%20control%20for%20Discovery%20V2.pdf.
- Gutierrez, Eric Dante. 2020. “The Paradox of Illicit Economies: Survival, Resilience, and the Limits of Development and Drug Policy Orthodoxy.” Globalizations 17 (6): 1008–1026. doi:10.1080/14747731.2020.1718825.
- Gutierrez, Eric Dante. 2021. “Criminal Entrepreneurs as Pioneers, Intermediaries, and Arbitrageurs in Borderland Economies.” International Journal of Drug Policy 89. doi:10.1016/j.drugpo.2020.103091.
- Gutierrez Sanin, Francisco. 2019. Clientelistic Warfare: Paramilitaries and the State in Colombia (1982–2007). Oxford: Peter Lang AG.
- Harriss-White, Barbara. 1999. “Introduction: Visible Hands.” In Agricultural Markets from Theory to Practice, edited by B. Harriss-White. London: Palgrave Macmillan. doi:10.1007/978-1-349-27273-0_1.
- Harriss-White, Barbara, and Lucia Michelutti (eds.). (2019). The Wild East: Criminal Political Economies in South Asia. UCL Press. doi:10.2307/j.ctvfrxr41
- Jelsma, Martin. 2005. “Learning Lessons from the Taliban Opium Ban.” International Journal of Drug Policy 16 (2): 98–103. doi:10.1016/j.drugpo.2005.01.002.
- Klein, Naomi. 2007. The Shock Doctrine: The Rise of Disaster Capitalism. London: Penguin Books.
- Laserna, Roberto. 1995. ‘Coca Cultivation, Drug Traffic and Regional Development in Cochabamba, Bolivia’. PhD dissertation, University of California at Berkeley.
- Levine, Michael with Laura Kavanau-Levine. 1993. The Big White Lie: The Deep Cover Operation that Exposed the CIA Sabotage of the Drug War. www.policetrialexpert.com (publisher). Kindle edition.
- Lintner, Bertil. 2000. The Golden Triangle Opium Trade: An Overview. Chiang Mai: Asia-Pacific Media Services. http://www.asiapacificms.com/papers/pdf/gt_opium_trade.pdf.
- Los Angeles Times. 22 September 1996. “Cocaine Crackdown Has Colombians Fearing War”, by Juanita Darling. https://www.latimes.com/archives/la-xpm-1996-09-22-mn-46571-story.html.
- Mansfield, David. 2006. “Responding to the Challenge of Diversity in Opium Poppy Cultivation”, Chapter 3 in Duddenberg and Byrd (editors), Afghanistan’s Drug Industry: Structure, Functioning, Dynamics, and Implications for Counter-Narcotics Policy. UNODC and World Bank, https://www.unodc.org/pdf/afg/publications/afghanistan_drug_industry.pdf.
- Mansfield, David. 2007. “‘Economical with the Truth’: The Limits of Price and Profitability in both Explaining Opium Poppy Cultivation in Afghanistan and in Designing Effective Responses.” In Reconstructing Agriculture in Afghanistan, edited by A. Pain, and J. Sutton, 213–234. Rugby: Practical Action Publishing.
- Mansfield, David. April 2004. “What is Driving Opium Poppy Cultivation? Decision Making Amongst Opium Poppy Cultivators in Afghanistan in the 2003/4 Growing Season”, paper for the UNODC/ONDCP Second Technical Workshop on Drug Control Research. http://www.davidmansfield.org/home/docs/field/10.pdf.
- Martin, Michael F. 2012. “US Sanctions on Burma.” CRS Report for Congress. Congressional Research Service 7-5700. https://fas.org/sgp/crs/row/R41336.pdf.
- Martin, Edouard, and Steven Symansky. February 2006. “Macroeconomic Impact of the Drug Economy and Counternarcotic Efforts”, Chapter 2 in Duddenberg and Byrd (editors), Afghanistan’s Drug Industry: Structure, Functioning, Dynamics, and Implications for Counter-Narcotics Policy. UNODC and World Bank, https://www.unodc.org/pdf/afg/publications/afghanistan_drug_industry.pdf.
- McCoy, Alfred W. 2003. The Politics of Heroin: CIA Complicity in the Global Drug Trade (Afghanistan, Southeast Asia, Central America, Colombia) (2nd Revised edn). Chicago, IL: Lawrence Hill Books.
- McDermott, Jeremy. 7 November 2008. “Revealed: The Secrets of Colombia's Murderous Castaño Brothers.” Daily Telegraph. http://www.telegraph.co.uk/news/worldnews/southamerica/colombia/3391789/Revealed-The-secrets-of-Colombias-murderous-Castano-brothers.html.
- Meehan, Patrick. 2011. “Drugs, Insurgency and State-Building in Burma: Why the Drugs Trade is Central to Burma’s Changing Political Order.” Journal of Southeast Asian Studies 42 (3): 376–404. doi:10.1017/s0022463411000336.
- Meehan, Patrick. March 2021. “‘Precarity, Poverty, and Poppy: Encountering Development in the Uplands of Shan State, Myanmar.” International Journal of Drug Policy 89. doi:10.1016/j.drugpo.2020.103064.
- New York Times. 2 March 1996. “Clinton Declares that Colombia Has Failed to Curb Drug Trade”, by Christopher S. Wren. https://www.nytimes.com/1996/03/02/world/clinton-declares-that-colombia-has-failed-to-curb-drug-trade.html.
- New York Times. 20 December 1994. ‘Drug Trafficker Convicted of Blowing Up Jetliner’, by Robert D. McFadden http://www.nytimes.com/1994/12/20/nyregion/drug-trafficker-convicted-of-blowing-up-jetliner.html.
- New York Times. 27 June 1995. “Crackdown Has Cali Drug Cartel on the Run”, by James Brooke. http://www.nytimes.com/1995/06/27/world/crackdown-has-cali-drug-cartel-on-the-run.html?pagewanted = all.
- New York Times. 6 August 1995. “Cali Drug Leader Caught, Making it 6 Now in Jail.” Associated Press report. http://www.nytimes.com/1995/08/07/world/cali-drug-leader-caught-making-it-6-now-in-jail.html.
- Pain, Adam. 2008. “Opium Poppy and Informal Credit.” Issue Paper Series, Afghanistan Research and Evaluation Unit. https://www.ecoi.net/en/file/local/1231617/1002_1225125226_afghanistan-poppy.pdf.
- Painter, James. 1994. Bolivia and Coca: A Study in Dependency. Boulder, CO and London: Lynne Rienner Publishers.
- Ramirez, Maria Clemencia. 2011. Between the Guerrillas and the State: The Cocalero Movement, Citizenship, and Identity in the Colombian Amazon (translated from Spanish by Andy Klatt). Durham, NC and London: Duke University Press. Kindle edition.
- Reuter, Peter, ed. 2010. “Understanding the Demand for Illegal Drugs.” Committee on Understanding and Controlling the Demand for Illegal Drugs, National Research Council. Washington DC: The National Academies Press.
- Reuter, Peter, and Franz Trautmann, eds. 2009. A Report on Global Illicit Drug Markets 1998–2007. Trimbos Institute, Rand Corporation, and the European Commission. 74 pages, Accessed 19 July 2019. https://exilope.files.wordpress.com/2010/03/report_short_10_03_09_en.pdf.
- Salgado Ruiz, Henry. 2012. “El campesinado de la Amazonia colombiana: Contruccion territorial, colonizacion forzada y resistencias.” PhD dissertation, Department of Anthropology, Faculty of Arts and Sciences, University of Montreal.
- Semana. 9 August 2007. “El Plan Birmania.” https://www.semana.com/nacion/recuadro/el-plan-birmania/131546-3.
- Storti, Claudia Costa, and Paul de Grauwe. 2009. “Globalization and the Price Decline of Illicit Drugs.” International Journal of Drug Policy 20: 48–61. doi:10.1016/j.drugpo.2007.11.016.
- Transnational Institute. 2001. “Afghanistan, Drugs, and Terrorism: Merging Wars.” Amsterdam: TNI, https://www.tni.org/files/download/debate3.pdf.
- UPI Español. 3 February 2007. “Los secretos del Plan Birmania.” https://espanol.upi.com/Politica/2007/02/03/Los-secretos-del-Plan-Birmania/35721170530340/.
- International Narcotics Control Strategy Reports of the US government
- INCSR. 1986. https://www.ncjrs.gov/pdffiles1/Digitization/106094NCJRS.pdf
- INCSR. 1987. US General Accounting Office (GAO. https://www.gao.gov/assets/80/76236.pdf
- INCSR. 1988. https://www.ncjrs.gov/pdffiles1/Digitization/111299NCJRS.pdf
- INCSR. 1989. https://www.ncjrs.gov/pdffiles1/Digitization/116112NCJRS.pdf
- INCSR. 1990. https://www.ncjrs.gov/pdffiles1/Digitization/126990NCJRS.pdf
- INCSR. 1991. https://www.ncjrs.gov/pdffiles1/Digitization/129434NCJRS.pdf
- INCSR. 1994. https://www.ncjrs.gov/pdffiles1/Digitization/153965NCJRS.pdf
- INCSR. 1996. http://www.hri.org/docs/USSD-INCSR/96/
- INCSR. 1997. https://www.hsdl.org/?view&did=234182
- INCSR. 1998. https://www.hsdl.org/?view&did=437657
- INCSR. 1999. https://www.hsdl.org/?view&did=437656
- INCSR. 2000. https://2009-2017.state.gov/j/inl/rls/nrcrpt/2000/index.htm
- INCSR. 2001. https://2009-2017.state.gov/j/inl/rls/nrcrpt/2001/index.htm
- INCSR. 2002. https://2009-2017.state.gov/j/inl/rls/nrcrpt/2002/index.htm
- INCSR. 2003. https://2009-2017.state.gov/j/inl/rls/nrcrpt/2003/index.htm
- INCSR. 2004. https://securityassistance.org/sites/default/files/2004incsr.pdf (full report) and https://2001-2009.state.gov/p/inl/rls/prsrl/spbr/30042.htm
- INCSR. 2005. . https://securityassistance.org/sites/default/files/2005incsr.pdf
- INCSR. 2006. Vol. 1. https://securityassistance.org/sites/default/files/2006incsr.pdf
- INCSR. 2006. Vol. 2. https://2009-2017.state.gov/documents/organization/62393.pdf
- INCSR. 2007. https://securityassistance.org/sites/default/files/2007incsr.pdf
- INCSR. 2008. https://securityassistance.org/sites/default/files/2008incsr.pdf
- INCSR. 2009. Vol. 1. https://securityassistance.org/sites/default/files/2009incsr.pdf
- INCSR. 2009. Vol. 2. https://2009-2017.state.gov/documents/organization/120055.pdf
- INCSR. 2010. Vol. 1. https://securityassistance.org/sites/default/files/2010incsr.pdf
- INCSR. 2010. Vol. 2. https://2009-2017.state.gov/documents/organization/138451.pdf
- INCSR. 2011. Vol. 1. https://securityassistance.org/sites/default/files/2011incsr.pdf
- INCSR. 2011. Vol. 2. https://2009-2017.state.gov/documents/organization/156589.pdf
- INCSR. 2011. Database. https://2009-2017.state.gov/documents/organization/164239.pdf
- INCSR. 2012. Vol. 1. https://2009-2017.state.gov/documents/organization/187109.pdf
- INCSR. 2012. Vol. 2. https://2009-2017.state.gov/documents/organization/185866.pdf
- INCSR. 2012. Database. https://2009-2017.state.gov/documents/organization/191510.pdf
- INCSR. 2013. Vol. 1. https://2009-2017.state.gov/documents/organization/204265.pdf
- INCSR. 2013. Vol. 2. https://2009-2017.state.gov/documents/organization/204280.pdf
- INCSR. 2013. Database. https://2009-2017.state.gov/documents/organization/211396.pdf
- INCSR. 2014. Vol. 1. https://2009-2017.state.gov/documents/organization/222881.pdf
- INCSR. 2014. Vol. 2. https://2009-2017.state.gov/documents/organization/222880.pdf
- INCSR. 2014. Database. https://2009-2017.state.gov/documents/organization/222700.pdf
- INCSR. 2015. Vol. 1. https://2009-2017.state.gov/documents/organization/239560.pdf
- INCSR. 2015. Vol. 2. https://2009-2017.state.gov/documents/organization/239561.pdf
- INCSR. 2015. Database. https://2009-2017.state.gov/documents/organization/239329.pdf
- INCSR. 2016. Vol. 1. https://2009-2017.state.gov/documents/organization/253655.pdf
- INCSR. 2016. Vol. 2. https://2009-2017.state.gov/documents/organization/253983.pdf
- INCSR. 2016. Database. https://2009-2017.state.gov/documents/organization/258726.pdf
- INCSR. 2017. Vol. 1. https://www.state.gov/wp-content/uploads/2019/04/2017-INCSR-Vol.-I.pdf
- INCSR. 2017. Vol. 2. https://www.state.gov/wp-content/uploads/2019/04/2017-INCSR-Vol-II.pdf
- INCSR. 2018. Vol. 1. https://www.state.gov/wp-content/uploads/2019/04/2018-INCSR-Vol.-I.pdf
- INCSR. 2018. Vol. 2. https://www.state.gov/wp-content/uploads/2019/04/2018-INCSR-Vol.-II.pdf
- INCSR. 2019. Vol. 1. https://www.state.gov/wp-content/uploads/2019/04/INCSR-Vol-INCSR-Vol.-I-1.pdf
- INCSR. 2019. Vol. 2. https://www.state.gov/wp-content/uploads/2019/03/INCSR-Vol-INCSR-Vol.-2-pdf.pdf
- INCSR. 2020. Vol. 1. https://www.state.gov/wp-content/uploads/2020/03/Tab-1-INCSR-Vol.-I-Final-for-Printing-2-25-20-508.pdf
- INCSR. 2020. Vol. 2. https://www.state.gov/wp-content/uploads/2020/03/Tab-2-INCSR-Vol-2-508.pdf
- World Drug Reports of the UN Office on Drugs and Crime
- WDR. 1999. https://www.unodc.org/pdf/report_1999-06-01_1.pdf
- WDR. 2000. https://www.unodc.org/pdf/report_2000-09-21_1.pdf
- WDR. 2001. https://www.unodc.org/pdf/report_2001-06-26_1/report_2001-06-26_1.pdf
- WDR. 2002. https://www.unodc.org/pdf/report_2002-06-26_1/report_2002-06-26_1.pdf
- WDR. 2003. https://www.unodc.org/pdf/trends2003_www_E.pdf
- WDR. 2004. Vol. 1. http://www.unodc.org/pdf/WDR_2004/volume_1.pdf
- WDR. 2004. Vol. 2. http://www.unodc.org/pdf/WDR_2004/volume_2.pdf
- WDR. 2005. Vol. 1. https://www.unodc.org/pdf/WDR_2005/volume_1_web.pdf
- WDR. 2005. Vol. 2. https://www.unodc.org/pdf/WDR_2005/volume_2_web.pdf
- WDR. 2006. Vol. 1. https://www.unodc.org/pdf/WDR_2006/wdr2006_volume1.pdf
- WDR. 2006. Vol.2. https://www.unodc.org/pdf/WDR_2006/wdr2006_volume2.pdf
- WDR. 2007. https://www.unodc.org/pdf/research/wdr07/WDR_2007.pdf
- WDR. 2008. https://www.unodc.org/documents/wdr/WDR_2008/WDR_2008_eng_web.pdf
- WDR. 2009. https://www.unodc.org/documents/wdr/WDR_2009/WDR2009_eng_web.pdf
- WDR. 2010. https://www.unodc.org/documents/wdr/WDR_2010/World_Drug_Report_2010_lo-res.pdf
- WDR. 2011. https://www.unodc.org/documents/data-and-analysis/WDR2011/World_Drug_Report_2011_ebook.pdf
- WDR. 2012. https://www.unodc.org/documents/data-and-analysis/WDR2012/WDR_2012_web_small.pdf
- WDR. 2013. https://www.unodc.org/unodc/secured/wdr/wdr2013/World_Drug_Report_2013.pdf
- WDR. 2014. https://www.unodc.org/documents/wdr2014/World_Drug_Report_2014_web.pdf
- WDR. 2015. https://www.unodc.org/documents/wdr2015/World_Drug_Report_2015.pdf
- WDR. 2016. https://www.unodc.org/doc/wdr2016/WORLD_DRUG_REPORT_2016_web.pdf
- WDR. 2016. Methodology. https://www.unodc.org/doc/wdr2016/WDR-2016-Methodology-Report.pdf
- WDR. 2017a Booklet 1. https://www.unodc.org/wdr2017/field/Booklet_1_EXSUM.pdf
- WDR. 2017b Booklet 2. https://www.unodc.org/wdr2017/field/Booklet_2_HEALTH.pdf
- WDR. 2017c Booklet 3. https://www.unodc.org/wdr2017/field/Booklet_3_Plantbased_drugs.pdf
- WDR. 2017d Booklet 4. https://www.unodc.org/wdr2017/field/Booklet_4_ATSNPS.pdf
- WDR. 2017e Booklet 5. https://www.unodc.org/wdr2017/field/Booklet_5_NEXUS.pdf
- WDR. 2017f Methodology. https://www.unodc.org/wdr2017/field/WDR_2017_Methodology.pdf
- WDR. 2018a. Booklet 1. https://www.unodc.org/wdr2018/prelaunch/WDR18_Booklet_1_EXSUM.pdf
- WDR. 2018b) Booklet 2. https://www.unodc.org/wdr2018/prelaunch/WDR18_Booklet_2_GLOBAL.pdf
- WDR. 2018c) Booklet 3. https://www.unodc.org/wdr2018/prelaunch/WDR18_Booklet_3_DRUG_MARKETS.pdf
- WDR. 2018d) Booklet 4. https://www.unodc.org/wdr2018/prelaunch/WDR18_Booklet_4_YOUTH.pdf
- WDR (2018e) Booklet 5. https://www.unodc.org/wdr2018/prelaunch/WDR18_Booklet_5_WOMEN.pdf
- WDR. 2018f) Methodology. . https://www.unodc.org/wdr2018/prelaunch/WDR-2018-Methodology-web.pdf
- WDR. 2019a) Booklet 1. https://WDR.unodc.org/wdr2019/prelaunch/WDR19_Booklet_1_EXECUTIVE_SUMMARY.pdf
- WDR. 2019b) Booklet 2. https://WDR.unodc.org/wdr2019/prelaunch/WDR19_Booklet_2_DRUG_DEMAND.pdf
- WDR. 2019c) Booklet 3. https://WDR.unodc.org/wdr2019/prelaunch/WDR19_Booklet_3_DEPRESSANTS.pdf
- WDR. 2019d) Booklet 4. https://WDR.unodc.org/wdr2019/prelaunch/WDR19_Booklet_4_STIMULANTS.pdf
- WDR (2019e) Booklet 5. https://WDR.unodc.org/wdr2019/prelaunch/WDR19_Booklet_5_CANNABIS_HALLUCINOGENS.pdf
- WDR. 2019f) Methodology. https://WDR.unodc.org/wdr2019/prelaunch/WDR-2019-Methodology-FINAL.pdf
Letters and documents from http://scottshelmandvalleyarchives.org
(31 January 2000) Letter to Karl F. Inderfurth: ‘Unsolicited Comment on Narcotics in Afghanistan’. http://www.scottshelmandvalleyarchives.org/docs/nar-00-14.pdf
(17 December 2000) Letter to Karl F. Inderfurth, ‘Helmand Province, Afghanistan and Opium Production’. File includes a 14 December 2000 letter to Michael Sheehan with the same subject. http://www.scottshelmandvalleyarchives.org/docs/nar-00-15.pdf
(3 February 2001) Letter to Richard Adams: ‘Proposal to Support Opium Poppy Ban’. http://www.scottshelmandvalleyarchives.org/docs/nar-01-10.pdf
(10 February 2001) Letter to Alan Eastham: ‘Why the US Should Support a Poppy Ban’. http://www.scottshelmandvalleyarchives.org/docs/nar-01-06.pdf
(21 February 2001) Letter to Steven Casteel: ‘Why the DEA Should Support the (Taliban) Poppy Ban’. http://www.scottshelmandvalleyarchives.org/docs/nar-01-05.pdf
(20 December 2001) Email to Elisabeth Kvitashvili: ‘Poppy in Helmand’. http://www.scottshelmandvalleyarchives.org/docs/nar-01-04.pdf
Other US government documents consulted for validation of data
Bureau of International Narcotics Matters (1 February 1986) ‘INCSR, Vol. 1, 1986’. Submitted to the Committee on Foreign Relations, Committee on Foreign Affairs.
DEA (February 1991). ‘Coca Cultivation and Cocaine Processing: An Overview’. https://www.ojp.gov/pdffiles1/Digitization/132907NCJRS.pdf
DEA (Drugs Enforcement Administration) (August 1994) ‘Drugs Trafficking in Southwest Asia: Drugs Intelligence Report’. https://www.ncjrs.gov/pdffiles1/Digitization/151459NCJRS.pdf last accessed 25 February 2019.
DEA (5 December 2001) ‘Terrorism, Drug-trafficking Inextricably Linked, US Experts Say’. http://www.usembassy.it/file2001_12/alia/a1120508.htm accessed 8 October 2013.
ONDCP (1995) ‘National Drug Control Strategy 1995’. Washington DC: ONDCP.
House Judiciary Committee (December 13, 2000). ‘Statement of Michael A. Sheehan, Coordinator for Counterterrorism, US Department of State’. Sheehan’s statement from http://judiciary.house.gov/legacy/shee1213.htm is not anymore available online, but a copy has been retained for this study.
USAID (April 2014) ‘Afghanistan Country Profile’. https://www.usaid.gov/documents/1871/afghanistan-profile-april-2014 last accessed 22 May 2019.
USAID Colombia (13 June 2014) ‘Country Development Cooperation Strategy 2014–2018: A Path to Peace’. https://www.usaid.gov/sites/default/files/documents/1862/USAID-Colombia-CDCS.pdf accessed 23 May 2019.
Data tables and sources
Figure 3 data and sources
Data table
Sources of Figure 3 data:
INCSR 1986, https://ncjrs.gov/pdffiles1/Digitization/106094NCJRS.pdf, pp. 234 and 179
INCSR 1989, https://ncjrs.gov/pdffiles1/Digitization/116112NCJRS.pdf, p. 15
INCSR 1990, https://ncjrs.gov/pdffiles1/Digitization/126990NCJRS.pdf, p. 19
INCSR 1991, https://ncjrs.gov/pdffiles1/Digitization/129434NCJRS.pdf, p. 21
INCSR 1998 World Illicit Drug Cultivation Totals, https://1997-2001.state.gov/global/narcotics_law/1998_narc_report/wdcult98.xls
WDR 1999, https://www.unodc.org/pdf/report_1999-06-01_1.pdf, pp. 23 and 42
WDR 2000, https://www.unodc.org/pdf/report_2000-09-21_1.pdf, p. 160
WDR 2001, https://www.unodc.org/pdf/report_2001-06-26_1/report_2001-06-26_1.pdf, p. 60, 67
WDR 2002, https://www.unodc.org/pdf/report_2002-06-26_1/report_2002-06-26_1.pdf, p. 47
INCSR 2002, https://2009-2017.state.gov/j/inl/rls/nrcrpt/2002/index.htm, p.iii-22
INCSR 2004, Part 1, https://securityassistance.org/sites/default/files/2004incsr.pdf, p. 23; 60
INCSR, 2007, https://securityassistance.org/sites/default/files/2007incsr.pdf, p. 29
WDR 2010, https://www.unodc.org/documents/wdr/WDR_2010/World_Drug_Report_2010_lo-res.pdf, p. 137–138
WDR 2014, https://www.unodc.org/documents/wdr2014/World_Drug_Report_2014_web.pdf, p.vi
INCSR 2014, Vol. 1, https://2009-2017.state.gov/documents/organization/222700.pdf, p .25
WDR 2019, https://wdr.unodc.org/wdr2019/prelaunch/WDR19_Booklet_2_DRUG_DEMAND.pdf (Booklet 2), p. 62 and 67
INCSR 2019, Vol. 1, 1 https://www.state.gov/wp-content/uploads/2019/04/INCSR-Vol-INCSR-Vol.-I-1.pdf, p. 23 and 25.
WDR 2022, Statistical Annex, https://www.unodc.org/res/wdr2022/MS/Statistical%20Annex/6.2.1_-_Illicit_opium_poppy_cultivation.xlsx
Figure 4 data and sources
Data table
Sources of Figure 4 data:
INCSR 1986, https://ncjrs.gov/pdffiles1/Digitization/106094NCJRS.pdf
INCSR 1989, https://ncjrs.gov/pdffiles1/Digitization/116112NCJRS.pdf
INCSR 1990, https://ncjrs.gov/pdffiles1/Digitization/126990NCJRS.pdf
INCSR 1991, https://ncjrs.gov/pdffiles1/Digitization/129434NCJRS.pdf
INCSR 1998 World Illicit Drug Cultivation Totals, https://1997-2001.state.gov/global/narcotics_law/1998_narc_report/wdcult98.xls
WDR 2001, https://www.unodc.org/pdf/report_2001-06-26_1/report_2001-06-26_1.pdf
WDR 2002, https://www.unodc.org/pdf/report_2002-06-26_1/report_2002-06-26_1.pdf
INCSR 2002, https://2009-2017.state.gov/j/inl/rls/nrcrpt/2002/index.htm
INCSR 2004, Part 1, https://securityassistance.org/sites/default/files/2004incsr.pdf
INCSR, 2007, https://securityassistance.org/sites/default/files/2007incsr.pdf
WDR 2010, https://www.unodc.org/documents/wdr/WDR_2010/World_Drug_Report_2010_lo-res.pdf
WDR 2014, https://www.unodc.org/documents/wdr2014/World_Drug_Report_2014_web.pdf
INCSR 2014, Vol. 1, https://2009-2017.state.gov/documents/organization/222700.pdf
WDR 2019, https://wdr.unodc.org/wdr2019/prelaunch/WDR19_Booklet_2_DRUG_DEMAND.pdf (Booklet 2)
INCSR 2019, Vol. 1, 1 https://www.state.gov/wp-content/uploads/2019/04/INCSR-Vol-INCSR-Vol.-I-1.pdf
WDR 2022, Statistical Annex, https://www.unodc.org/res/wdr2022/MS/Statistical%20Annex/6.2.2_-_Potential_production_of_oven-dry_opium.xlsx
Figure 5 data and sources
WDR 1996 or UN IDCP (1996) Statistics and Analysis on Supply of and Trafficking in Narcotic Drugs and Psychotropic Substances, 1996. Vienna: UN International Drug Control Program. https://www.unodc.org/pdf/technical_series_1998-03-01_1.pdf
WDR (1999) Pdf sourced from https://www.unodc.org/pdf/report_1999-06-01_1.pdf
WDR (2001) Pdf sourced from https://www.unodc.org/pdf/report_2001-06-26_1/report_2001-06-26_1.pdf
WDR (2002) Pdf sourced from https://www.unodc.org/pdf/report_2002-06-26_1/report_2002-06-26_1.pdf
Figure 6 data and sources
WDR (1999) Pdf sourced from https://www.unodc.org/pdf/report_1999-06-01_1.pdf
WDR (2001) Pdf sourced from https://www.unodc.org/pdf/report_2001-06-26_1/report_2001-06-26_1.pdf
WDR (2002) Pdf sourced from https://www.unodc.org/pdf/report_2002-06-26_1/report_2002-06-26_1.pdf
Figure 7 data and sources
Data table:
Source of Figure 7 Data: WDR 1999, https://www.unodc.org/pdf/report_1999-06-01_1.pdf, p.42
Figure 8 data and sources
Data table:
Sources of Figure 8 data:
INCSR sources: INCSR 1986: 91; INCSR 1989: 15; INCSR 1990: 19; INCSR 1991: 21; INCSR 1995: 26; INCSR 1998: pdf; INCSR 1999: 76; INCSR 2000: 63; INCSR 2001: 99; INCSR 2002 II-2; INCSR 2004 Table; INCSR 2007: 29; INCSR 2008: 129; INCSR 2009; INCSR 2010, VOL. 1: 23; INCSR 2011, VOL. 1: 201; INCSR 2012, VOL. 1: 25; INCSR 2013, VOL. 1: 103; INCSR 2014, VOL. 1: 25; INCSR 2015, VOL. 1: 29; INCSR 2016, VOL. 1: 30; INCSR 2018, VOL. 1: 26; INCSR 2019, VOL. 1: 25; INCSR 2020, VOL. 1: 23
WDR sources: WDR 1999: 41; WDR 2000: 160; WDR 2001: 67; WDR 2001: 67b; WDR 2002: 55; WDR 2003: 23; WDR 2004, VOL. 1: 95; WDR2005: 207; WDR 2006 VOL. 1: 81; WDR 2007: 64; WDR 2010: 161; WDR 2012: 35; WDR 2015 Annex: iii; WDR 2018b: 52; UNODC 2019b: 12
Figure 9 data and sources
Data table
Data sources for Figure 9:
UNODC (2002) Afghanistan Opium Survey 2002. Vienna: UNODC and Afghanistan Counter Narcotics Directorate. https://www.unodc.org/pdf/afg/afg_opium_survey_2002.pdf
UNODC (2003) Afghanistan Opium Survey 2003. Vienna: UNODC and Afghanistan Counter Narcotics Directorate. https://www.unodc.org/pdf/afg/afghanistan_opium_survey_2003.pdf
Figure 10 data and sources
Data table:
Sources of data for Figure 10: WDR 1996 Statistical Analysis: 36; WDR 1999: 77; WDR 2001: 73; WDR 2002: 62; UNODC 2003; WDR 2003: 174; WDR 2004, VOL. 1: 74; WDR 2005 VOL 2: 15; WDR 2007: 201; UN Drug Statistics 2008: 30; WDR 2009: 193; WDR 2014: vi; and WDR 2019: 62–67.