Article title: How do institutional factors shape PhD completion rates? An analysis of long-term changes in a European doctoral program
Authors: J. Skopek, M. Triventi, H.-P. Blossfeld
Journal: Studies in Higher Education
DOI: https://doi.org/10.1080/03075079.2020.1744125
The article was originally published with wrong figure sequences. The correct figures are listed as below,
Figure 1. Heuristic model to understand the main drivers of PhD students’ academic outcomes.
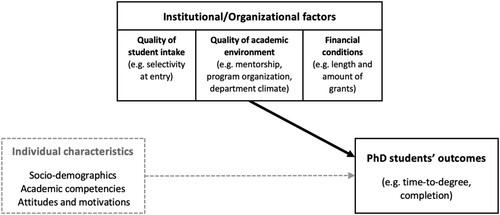
Figure 2. Entries to the PhD program from 1976 to 2012. Source: own calculations based on archival records.
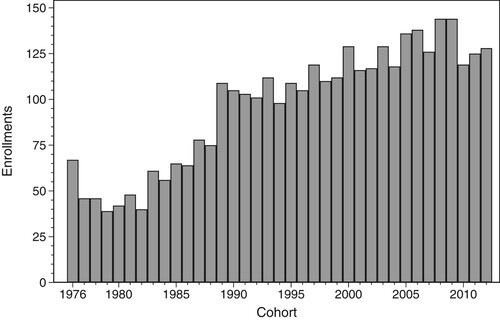
Figure 3. Probability of completion by entry cohort. Note: Proportion of admitted students who submitted their thesis up to a certain time. Estimated via non-parametric Kaplan–Meier estimation for each cohort.
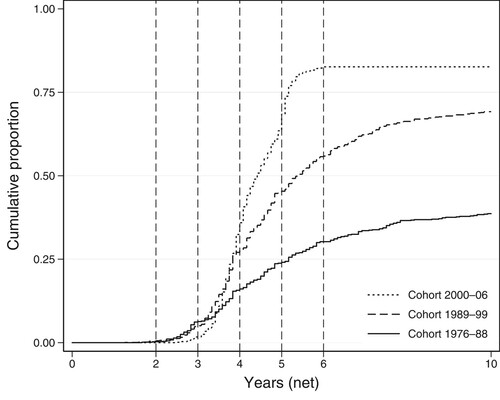
Figure 4. Time evolution of hazard rates of thesis submission for three student cohorts. Note: Smoothed hazard rates by cohort using Nelson–Aalen estimation. Hazard rate on yearly scale.
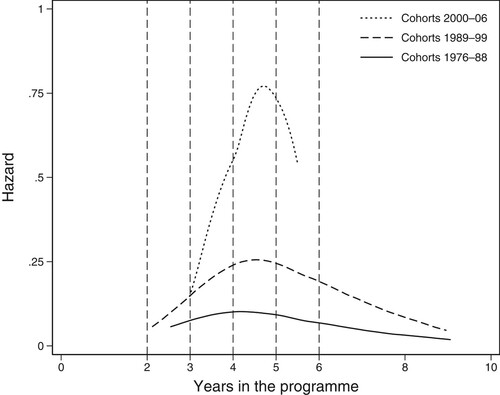
Figure 5. Changes of average completion hazard of entry cohorts shortly before and after the first reform in 1989 and the second reform in 2000. Note: Estimated for cohorts who entered immediately five years before and after the reforms in 1989 and 2000 using an exponential rate model. Hazard rate on yearly scale.
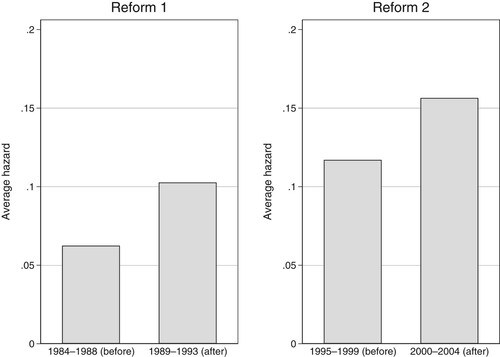
Figure 6. PhD completion by entry cohort unconditional (Model 4) and conditional on covariates (Model 5). Notes: Predictions of hazard rate (yearly) and cumulative probability based on Models M4 and M5. Covariate values fixed at sample mean.
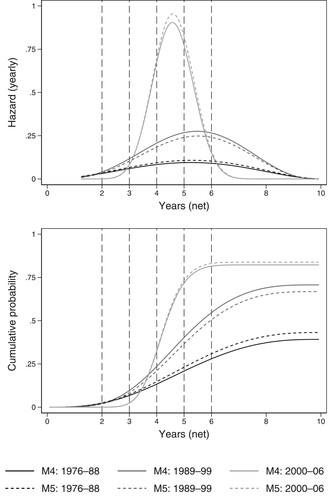
Figure 7. Covariate effects on cumulative probability of PhD completion (Model 5). Notes: Difference in predicted probabilities of completion based on Model 5. Effects evaluated at the sample average. Non-significant effects in grey. range = denotes range effect going from minimum to maximum sample values (see Table 1).
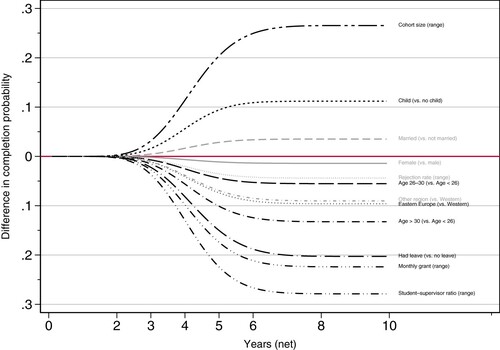
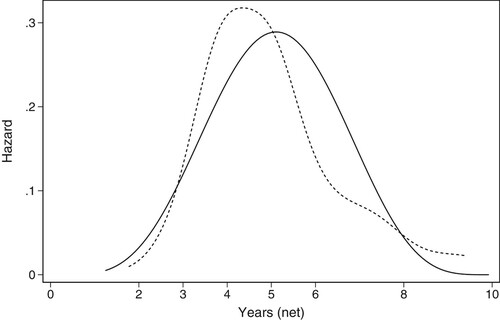
Figure A1. Smoothed non-parametric hazard estimates (dashed line) and hazard based on model prediction (solid line). Note: Non-parametric hazards estimated by Nelson–Aalen estimator with a kernel density smoothing (Gaussian kernel). Model predictions based on M0 in Table 2. Hazard rate on yearly scale.