
ABSTRACT
Around the world each year, large sums of money are expended in helping students access higher education institutions (HEIs), but there is remarkably little evidence to show whether this investment is effective or not. Here we use data from a UK university to investigate the relationship between financial support and the continuation of students beyond their first year of study. As a result of changing scholarship policies over the course of three years, a natural experiment was created that allowed us to investigate the effect of financial support on the rates of withdrawal of students from households with different incomes. Controlling for multiple demographic and attainment factors (age, gender, ethnic grouping, disability, nationality, household income, prior educational attainment, and local Higher Education participation rates), the data suggest that scholarships improved student retention, but principally for those students from households with low and intermediate incomes. Interestingly, the value of the scholarships, which varied from £500 to £3,000, did not have a measurable effect on withdrawal. We also found that some students who appeared to be eligible for a scholarship and would likely have benefited from it did not receive one, and we discuss the reasons why this might be so. These results have important implications for scholarship policies in Higher Education internationally; to maximise impact, scholarships should be awarded to those most in financial need.
GRAPHICAL ABSTRACT
Introduction
Scholarships and financial aid packages for students are offered by higher education institutions (HEIs), governments and charities internationally. Their reasons for doing so are various; for some, offers of such support are mainly intended to attract new students, whilst for others these incentives are designed to support students once enrolled. Regardless of the purposes of offering this type of financial support, the expenditure is significant; in the UK alone, it is estimated that around £400million per year is spent on financial support for under-represented and disadvantaged students in Higher Education (OFFA Citation2015; Office for Students Citation2020). However, there is remarkably little evidence or agreement on what such support is intended to achieve, and whether it works.
Much of the research that has investigated the impact of financial support on student success has been conducted in the US. In a randomised controlled trial, Goldrick-Rab et al. (Citation2016) showed a positive impact of needs-based funding on the odds that students completed their studies. Similarly, Bettinger (Citation2015) took advantage of policy changes across cohorts of students to provide a comparison group and found that drop-out rates amongst students who received an extra $800 fell by 2% (see also Castleman and Long Citation2016; Denning, Marx, and Turner Citation2019). In contrast, Schudde and Scott-Clayton (Citation2016) reported that financial aid, awarded conditionally on satisfactory academic progress, had a negative effect on study persistence in one analysis, because, they argued, students feared losing that support in future years. Herbaut and Geven (Citation2019) provide a recent systematic review, dividing support into performance-based (i.e. with conditions on satisfactory academic performance once studying), merit-based (based on entry qualifications) and needs-based (based on income). They concluded that while needs-based grants consistently improved the completion rates of disadvantaged students, merit-based grants rarely did so.
The debate over the effectiveness of scholarships to enable students to access higher education is by no means restricted to the US. In Canada, for example, Day (Citation2008) reported a relatively small negative effect of financial aid on the persistence of students and suggested several other factors were more important. In a cross-institutional study from Australia, Zacharias and Ryan (Citation2021), whilst agreeing that ‘scholarships are no panacea’ (1), presented descriptive statistics to suggest that even small awards can have a positive effect on retention (see also e.g. Gross, Torres, and Zerquera Citation2013; Reed and Hurd Citation2016). In France, Fack and Grenet (Citation2015) reported that financial needs-based aid supported retention from first to second year, but not thereafter (see also Agasisti and Murtinu Citation2016 in Italy).
In the UK, the fee regime and support available in terms of student loans are different from the US and elsewhere, yet UK-based research into the effects of financial support is sparse. Harrison and McCaig (Citation2017, 304) argued that there was no clear definition of success for UK bursaries and that their original purpose of ‘bolstering demand’ had been transformed into a ‘generalised tool supporting retention and success’. Callender (Citation2010) presented a critical analysis of UK government scholarship policy, highlighting a mismatch between the original intentions and the way that universities have differentially awarded scholarships for different purposes. In 2014, the UK Office for Fair Access (OFFA, now Office for Students) published an interim report based on national level data, which tentatively suggested that there was no evidence for positive effects of financial support on student continuation rates in English Higher Education (see also OFFA Citation2015). However, whilst their analysis suggested no improvement in continuation for students in receipt of financial support, it also showed no detriment. This distinction is critical, because students in receipt of this support are often those students from more disadvantaged backgrounds and would typically be expected to have inferior outcomes. As Harrison and McCaig (Citation2017) argued, the purpose of these bursaries is to level the playing field between those disadvantaged students and their peers, rather than to confer advantage. Harrison and McCaig (Citation2017) also highlighted the challenges of selecting a suitable comparison group for analysis, because generally all students that meet a particular criterion in a particular institution will be awarded a scholarship. The second challenge for applying OFFA’s conclusions to the current UK context, is that they were based on data prior to the 2012 increase in tuition fees in England, which arguably has exerted greater financial pressures, possibly creating an environment more like that in the US. More recently, Kaye (Citation2021) reported a systematic review of the efficacy of financial support for improving participation or attainment in higher education, using evidence primarily relevant to HE in England, and concluded that ‘evidence for the effectiveness of bursaries is scarce and inconsistent’ (16).
Notwithstanding the significant issue of what should constitute appropriate evidence of effects of financial support, some research has suggested an impact. Ilie et al. (Citation2019), for example, at the University of Cambridge (UK), reported no differences in retention between more and less advantaged groups, suggesting that bursaries were effective; however, as is typical, they had no comparison group of disadvantaged students who had not received bursaries. We agree with Harrison and McCaig’s (Citation2017) thesis that finding a significant positive benefit in the context of an uncommon outcome (attrition) is a very high bar for the success of a scholarship. However, finding no significant difference between groups who are and who are not in receipt of a scholarship is arguably too low a bar, because to find no statistically significant difference between groups does not provide full reassurance that they are the same. A stronger line of evidence would be to show different outcomes between groups of students with similar characteristics when they do vs. when they do not receive a scholarship. Both Hoare and Lightfoot (Citation2015) and O’Brien (Citation2015) presented indicative findings for positive effects of support at their institutions and discussed some of the challenges of research in this area, including accessing appropriate comparison groups. Harrison et al. (Citation2018) present a qualitative analysis of the wider benefits to students from receiving a scholarship, including being able to participate more fully in the university experience. Hatt et al. (Citation2005) analysed data from two UK institutions and found amongst students from low-income backgrounds, those receiving bursaries were significantly more likely to continue than those without an award (see also Bowes et al. Citation2014; Hatt, Hannan, and Baxter Citation2005).
Here we report an analysis of three years of data post the 2012 tuition fee rise (2013–5) from Aston University (UK). The analysis compared students from households with different levels of income in terms of their withdrawal rates, and according to whether they received a scholarship. Because of the changes in criteria for scholarships over the years investigated, appropriate comparison groups to address this important question had been formed in a natural experiment. The amounts given also varied across the years, affording the opportunity to also investigate the effect of the size of bursary awarded.
Method
Dataset
We analysed the records of all 6,838 students who first enrolled at Aston University from 2013/4–2015/6, which included information on gender, disability status, prior educational attainment, the Higher Education participation rate in the area of student domicile, household income, age on entry, nationality, ethnicity, retention outcome and any scholarship support received. Aston University is a medium size, mid-tariff university in central Birmingham (UK) where approximately 40% of students meet at least one widening participation criterion and, in this sample, 62% of students reported a residual household income of under £25,000 per annum (which was the median household income in the UK at the start of this period). The University has a more ethnically diverse intake of students than the UK as a whole, with 50% of students identifying as South Asian (27% Indian; 18% Pakistani 5% Bangladeshi), 33% White, 11% Black (9% African; 2.3% Caribbean), 1.2% Chinese and 4.1% Mixed heritage.
Scholarship criteria
Across the three years analysed, the criteria for the award of university first-year scholarships and the amount awarded varied. In 2013/4, first-year scholarships were £3,000 for students with household incomes below £18,000 and £500 for students with household incomes between £18,000 and £42,000. Students achieving AAB or above equivalent in their ‘A’-levels (subject based qualifications typically taken at 18 years old which confer entry to University) also received £1,000. In 2013, approximately 20.3% of A level students achieved AAB grades or better in their A levels (Department for Education Citation2016) and students achieving ABB or better were exempt from government-imposed student number controls on the number of students that a university could recruit. In 2014/5, scholarships were £2,000 for students with household incomes below £18,000 and £500 for students with household incomes between £18,000 and £42,000. Students achieving AAB or above equivalent in their ‘A’-levels also received £1,000. In 2015/16, scholarships were in the form of accommodation discounts only: £1,000 for students with household incomes less than £25,000 and £500 for students with household incomes less than £35,000. Students achieving AAB or above equivalent in their ‘A’-levels also received £1,000. The variation in the criteria for awarding scholarships, including the mix of merit and need based scholarships, and the value of these across the three years provides a valuable opportunity to compare the effect of scholarships (both their award and value) on withdrawal rates in the first year of university in a sample of students from similar backgrounds.
In England, students usually have their place at university confirmed in the August before the start of their first term and that offer will include details of any scholarship they may be eligible for, subject to meeting all the conditions. Students start the academic year at the end of September, but the scholarships at Aston University are not paid until the end of November. The primary data analysis identifies those students with scholarships as those to whom a scholarship was paid. However, estimates of the impact of scholarships based on this definition risk over-inflating their true effect because some students, who knew they were to be awarded a scholarship, may have withdrawn from university before the scholarship was paid; we identified 18 students in this category. For this reason, we used two definitions of scholarship: (i) those who received a scholarship and (ii) those who received a scholarship plus those who were intended to receive at scholarship. In nearly all cases, the primary analysis will be reported alone except in cases where there was a discrepancy between the results of the two definitions.
Variables in the analysis
Some of the variables were re-coded in order to simplify the analysis; age into a categorical variable (young/mature), nationality into two categories (UK or other), ethnicity into eight categories (white/Black Caribbean/Black African/Indian/Pakistani/Bangladeshi/Chinese/Mixed), disability into three categories (None/receiving Disabled Students Allowance (DSA)/Disabled but not receiving DSA or unknown). Household income was divided into four categories (£0–£18,000, £18–25,000, £25,000–£42,000 and above £42,000). Local HE participation of people (18–19 years) was measured using POLAR3 (Participation of Local Areas) in the form of quintiles (1 = lowest 20% of participation, 5 = highest 20%) and UCAS entry tariff score, converted to a standard z-score, was used as a summary score of educational qualifications obtained between 16–18 years. For analyses addressing the effect of having a scholarship (both the primary analyses and the intention to give analyses), a binary coding, indicating whether any support had been received or not, was used; in analyses where the value of the scholarship was considered the bursaries were coded into six categories (£0, £500, £1,000, £1,500, £2,000, and £3,000). The primary outcome measure was student withdrawal (non-retention), defined as entry into the second year of study (yes/no).
Missing data
Small amounts of data were missing for the UCAS entry tariff (n = 287; 4.2%), POLAR3 quintiles (n = 3; 0.04%) and Ethnicity (n = 53; 0.1%) and, in 11 cases (0.2%), students were recorded as having received a scholarship, but the amount awarded was unknown and these were excluded, giving a total sample size for the analyses of 6,835 students.
The largest amount of missing data was for household income which was obtained from the Student Loans Company and was only available for students who had applied for loans. Most students who had not applied for a loan are likely to have come from wealthier households with incomes above £42,000 (n = 1374; 20.1%) but some may have come from families that hold religious beliefs prohibiting them from taking on interest-bearing debt, and these often have very much lower household incomes. Having such a large proportion of the data missing was problematic because, unless those participants with complete data was representative of the whole sample, then the results of any analysis might be biased. It would have been possible to impute the data using standard methods, but this was not done because the available variables did not predict income very well, so the imputed values would have been poor estimates of true income. Instead, we took the alternative approach of estimating boundaries on our results by performing two analyses: one where we assumed that all individuals with missing data were in the lowest income group and another where we assumed that they were all in the highest income group. The rationale for this was that these analyses would represent the extreme limits of the possible effects of household income on retention and, if the results from the logistic regression using only participants with complete data were similar to the results using both the high- and low-income assumptions, then we would be safe in assuming that those participants with complete data were broadly representative of the whole sample. Consequently, in one analysis, we assumed that all students with missing data belonged to the lowest household income group (<£18,000); in the other we assumed that they all belonged to the highest (which we believe is more likely to be the case). In fact, the results for the three analyses were similar suggesting that those participants with complete data were broadly representative of the complete sample so, except in cases where there was a discrepancy between the results of the three analyses (which we report), the results presented below are for students where the household income was known. The analyses using interpolated data are available from the authors upon request.
Analysis
The association between withdrawal (Yes/No) and scholarships (Yes/No) was assessed using Χ2 and reported as a relative risk (RR). The association between withdrawal (Yes/No) and the value of the scholarships, stratified by household income, was by Somers’ D.
In addition to scholarships, there are many other reasons that may influence withdrawal rates, including age, gender, ethnicity, prior educational attainment etc. and each of these factors needs to be considered. To this end, a logistic regression analysis was conducted with withdrawal (Yes/No) as the dependent variable and ethnicity, age, disability, gender, UCAS entry tariff, POLAR3 quintile, nationality, and the logarithm of household income as the independent variables, all coded as described above. For this analysis, scholarship was included as a binary independent variable (Yes/No). For scholarships, the reference category (to which all the other groups in each category were compared) was ‘No scholarship’ but in all other cases, the reference group was the majority group or, where no clear majority existed, the group with the highest retention rate. That is, the reference categories were: young, white, female, UK nationals, with no declared disability, from POLAR3 Quintile 5, in the highest household income category who did not receive a scholarship. The size of association between the independent and dependent variables was by odds ratio (OR). OR is a numerical expression of the odds of an outcome, familiar to many from their use in gambling but represented as a single number. So, for example, odds of 3:1 would be represented as an OR 3÷1, or 3. When the OR = 1, it means the independent variable has no effect on the dependent variable (i.e. the outcome). When the OR > 1, the independent variable increases the odds of the outcome (makes the outcome more likely) and when OR < 1, the independent variable with lowers the odds of the outcome (makes the outcome less likely). ORs are reported with 95% confidence intervals and are considered statistically significant if the bounds of the confidence intervals do not include 1.
Results
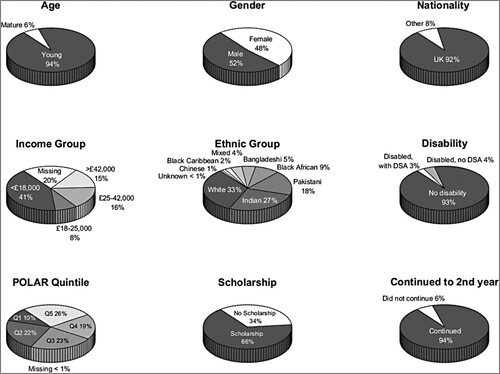
Demographic characteristics of the sample are shown in . Aston University is an ethnically diverse institution with a high population of Asian students in comparison to other United Kingdom Higher Education Institutions (35% vs. around 8% nationally) and – unusually – an overall white minority (36% vs. around 80% nationally: Equality Challenge Unit Citation2015). Over 50% of students would typically come from disadvantaged backgrounds (IMD quintiles 1 and 2) in comparison to English averages of around 40%. It typically enrols a relatively small proportion of mature students (around 7%) relative to the English average (around 30%). Continuation rates are typically slightly higher than the sector average. In the three-year period of this study, two thirds of students received some form of scholarship (68% in 2013/4, 69% in 2014/5 and 63% in 2015/6). Withdrawal rates averaged 6.0% and did not vary by more than 0.2% across the period.
Figure 1. Showing demographic characteristics of the sample.
There was a significant association between scholarships and withdrawal (Χ2(1) = 34.7, p < .001) with students without scholarships being 75% more likely to leave university before their second year (8.4%) than those with scholarships (4.8%) (RR = 1.75, 95% CI [1.45, 2.10]). This association was also significant in the intention to give group (Χ2(1) = 19.4, p < .001) although the relative risk of withdrawal was lower (RR = 1.52, 95% CI [1.26, 1.84]).
Next, we determined the impact of scholarships on withdrawal rates controlling for a range of other factors that we considered relevant including age, sex, ethnicity, and family income (for the full list see ). To do this, we performed a logistic regression analysis model in which student withdrawal (No/Yes) was the dependent variable; the results are shown in . The resulting model provided a significantly better fit to the data than a null model with no predictor variables (Χ2(25) = 187.0, p < .001) although the model was not strongly predictive of the outcome (Nagelkerke R2 = .097).
Table 1. Results of the Logistic Regression to predict student withdrawal.
Several independent variables were statistically significantly associated with withdrawal rates. These were gender (men were more likely to withdraw than women), ethnic group (Indian, Pakistani and Black African students were more likely to continue than white students), HE Participation Rate (students from local areas with low HE participation rates, POLAR Q1 to Q3, were significantly more likely to withdraw than those from areas with the highest rate of participation, Q5) and household income (students from higher income households were less likely to withdraw). There was also a trend towards statistical significance for prior educational attainment, but age, disability and nationality were not significantly related to withdrawal. The same pattern of results was found using the interpolated data, with the exception that prior educational attainment, which had been marginally non-significant, was significant (those with higher prior education were less likely to withdraw) for both imputed data sets. The results using the intention to give data were also very similar and so are not reported here.
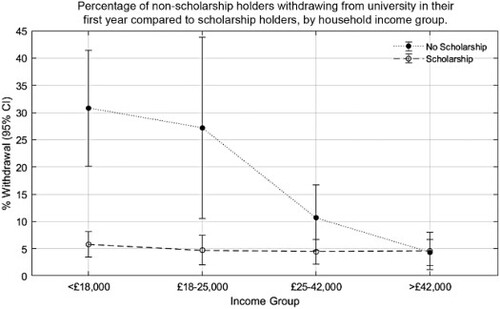
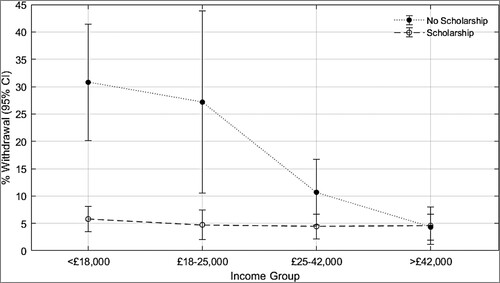
The effect of receiving a scholarship varied by household income () with the benefit being greatest for students from low-income families. For the two lowest income groups, students without scholarships were more than 5-times more likely to withdraw than students with scholarships (Income < £18,000, RR = 5.3, 95% CI [4.0, 6.9], p < .05 and income £18,000–£25,000, RR = 5.7, 95% CI [3.0,10.8]). The effect was also significant, although smaller, for students from intermediate household income families (Income £25,000–£42,000, RR = 2.5, 95% CI [1.5, 3.9], p < .05) and there was no evidence that scholarships had any effect on continuation at university for high income families, scholarships (RR = 0.9, 95% CI [0.5, 1.5], p > .05).
Figure 2. Percentage of non-scholarship holders withdrawing from university in their first year compared to scholarship holders, by household income group.
The result that scholarships were primarily effective for low-income households was also found in the intention-to-give group although the benefits were lower with the RR of withdrawal being 4.2, 4.5, and 1.7 times higher in those without scholarships for the £0–£18,000, £18–25,000 and £25,000–£42,000 income groups respectively and non-significant for the highest earning group.
Similarly, the result that scholarships were primarily effective for low-income households was also found in both imputed data sets. Most interesting in this context is for the data set where missing household income was imputed by the lowest household income, as this sets the lower boundary for the effect of household income on scholarships. Even in this case, for the lowest income group, students receiving no scholarship were 2.4 times more likely to withdraw (RR = 2.4, 95% CI [1.6, 3.5], p < .05).
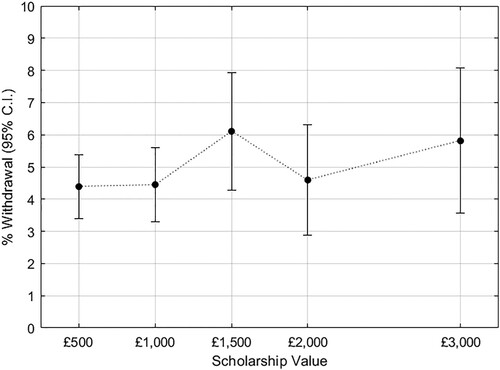
As the effect of scholarships depends upon students’ household income, it might also be expected that the monetary value of the awards would have a similar effect. However, the percentage of students who withdrew was unrelated to value of the bursary (Ordinal/binary correlation, Somers’ D = −.007, p < .16) () and this was true for each level of household income and for the imputed data.
Figure 3. Percentage of scholarship holders withdrawing before the start of second year at university by value of scholarship.
Discussion
Our first important finding demonstrates that whilst scholarships of £500–£3,000 in value had a positive effect on continuation, they did so principally for students from modest and (especially) lower income households. This is particularly important because household income was itself a significant predictor of continuation, with students from lower household income groups significantly more likely to withdraw. This result is in support of much of the extant qualitative and quantitative literature arguing for the benefits of financial scholarships. However, the novelty and addition this study offers, is that it shows the benefits of scholarships on retention (i) under a UK fee regime, (ii) whilst accounting for variables known to influence retention and (iii) using a comparison group who did not receive a scholarship (though also see Chetwyn and Diggle Citation2013, unpublished).
Our second main finding is that the value of the scholarship (within the parameters tested in the study) did not significantly influence retention. Given the limitations of a ‘natural experiment’ we have not been able to fully disentangle the relationship between household income and scholarship value and their combined effect on retention. However, at least for low-household income families, there was no relationship between scholarship value and retention.
Finally, prior educational attainment was a less consistently reliable predictor of retention. In contrast, OFFA (Citation2014) found no benefit (but also no detriment) of scholarships on retention with prior attainment the most significant factor in predicting continuation. However, their analyses were conducted under a different fee regime (pre-2012, so lower fees) and with sector-wide data, to include a greater variety of different entry tariffs. It is possible the variance in entry tariff in our single institution data was insufficient to detect similar effects.
The finding that scholarships aid retention mainly for students from households with lower incomes is intuitive, with the logical inference from that result alone being that the additional income is directly helping with course or living related expenses, thereby mitigating risks of non-continuation. However, in this context, the lack of a relationship between the scholarship amount and retention is counter intuitive. Reconciling these findings requires one of two (non-mutually exclusive) possibilities. The first, that it is the money itself that is having a direct effect on continuation, but that relatively small amounts of money are sufficient. The second, that it is not the money itself which affords the benefits, but the meaning of receiving a scholarship.
Given the values involved and the low-household incomes of some of these students, it seems unlikely that the financial benefit of the scholarships included in our analyses had fully peaked and therefore conferred no further financial benefit to the recipients. Reed and Hurd (Citation2016, 1236) ask whether equity scholarships in Australia have ‘a value beyond money’, including intangible benefits such as extra time resulting in more opportunity to participate in extracurricular opportunities, enhanced financial security and a greater sense of belonging and loyalty to the university (see also Thomas Citation2012, who highlighted the importance of student engagement and belonging in student retention). Hatt, Hannan, and Baxter (Citation2005) suggested that institution specific financial support can affect the way that students perceive the institution and that even a small amount of money to help with early expenses – such as course books and equipment – is likely to help retention. The observed effects therefore likely reflected a value of the scholarship beyond the financial benefit.
Much of the research literature divides scholarships into needs-based vs. merit- or performance-based. Many of our lower income students would have received merit-based scholarships as well as, or instead of, needs-based ones. We did not divide our scholarships in this way for the analyses, instead analysing the total sum of all scholarships received based only on their monetary value; instead, in our analyses, a students’ household income can be used to determine whether a scholarship was likely to be ‘more needed’ or ‘less needed’. If scholarships do have a value beyond money, it is possible that merit-based scholarships in this scenario have a greater meaning to the students than needs-based scholarships.
Overall, our findings therefore suggest that, if continuation in Higher Education is the goal, as has been found in other countries, scholarships should be awarded to those most in need rather than on the basis of academic achievement (see also Bettinger Citation2015; Castleman and Long Citation2016; Denning, Marx, and Turner Citation2019; Fack and Grenet Citation2015; Goldrick-Rab et al. Citation2016; Herbaut and Geven Citation2019; Zacharias and Ryan Citation2021). This conclusion can be argued to hold true even if prior attainment can be observed as a significant predictor of continuation; perhaps even more so since allocating scholarships to those who need it least has little merit. Higher Education providers should be clear whether their scholarships are designed to aid continuation, or to attract students. Callender (Citation2014) found that 59% of surveyed providers cited student retention and completion as one of the aims of their bursaries (with 81% citing widening participation of low income or under-represented students).
These conclusions come with caveats, limitations, and points to note for future research. First, it is important to note that – as in our case – university data sets may be coded according to whether a scholarship was actually received by each student, rather than according to whether or not they were eligible. In cases where a student withdraws from university prior to their receipt of a scholarship, any positive effects of scholarships may be exaggerated, because all those students who withdraw early do not receive a scholarship. In this study we additionally analysed the data including an ‘intention to give’ group in order to try to preclude such effects, but where national data sets are employed, based on data sets returned by HEIs, such actions are impracticable. Second, we are aware of some cases in our data where students were eligible for scholarships on most of the key eligibility criteria but did not receive one because they had not had their household income officially assessed via the student loans company. There are reasons – other than being in a strong financial position – why students may not apply for student loans (e.g. religious reasons, or difficulty navigating the loans and bursary system). It is therefore possible that a group of students without scholarship support also had no financial support from loans, thereby putting them in a challenging financial position; such a scenario could have also exaggerated the positive effects of scholarships. Furthermore, it is possible that such reasons are associated with other characteristics that may make retention in Higher Education more challenging in other ways (for example, first generation students). Third, in our analysis we did not investigate the method by which students received their support, treating all methods equally. Goldrick-Rab et al. (Citation2016) found that reducing short term ‘out of pocket’ costs – rather than reducing loans – had a greater impact on retention, particularly in case where those ‘out of pocket’ costs were high; so, ignoring these factors places some limitations on our conclusions. More specifically in terms of our data, in 2015/16 for example all scholarships were awarded only in terms of discounts for accommodation; this type of award could arguably be less helpful than more immediate ‘cash in the bank’, but that analysis was not undertaken. Future research could usefully examine the impact of the method and timing of any scholarships awarded as well as their value. Finally, we have only analysed retention at Aston University and did not have data on whether or not students moved to a different HEI, rather than ceasing their studies altogether.
In summary, these findings show the benefit of scholarships to students with lower incomes and reinforce the importance of targeting support for those who are (i) most likely to withdraw and (ii) most likely to benefit from it. Further research should investigate how the impact of scholarships compares to benefits from other types of support in relation to the costs involved for universities and how scholarships interact with the other ways in which disadvantaged students are supported at university. It might also be interesting to investigate how the framing of a scholarship as merit- vs. needs-based affects their impact.
Ethics statement
The data for this study were part of a larger dataset collected by the University for various functions including equal opportunities monitoring and enhancing the student experience. No new or additional data were collected and all data were anonymised. The analyses conducted were part of a project which monitors fair access and success. Student consent to their data being used for these purposes upon accepting their offer to study.
Acknowledgements
We are grateful to James Holmes and Ruth Hall for their help with data preparation.
Disclosure statement
No potential conflict of interest was reported by the author(s).
References
- Agasisti, T., and S. Murtinu. 2016. “Grants in Italian University: A Look at the Heterogeneity of Their Impact on Students’ Performances.” Studies in Higher Education 41 (6): 1106–32. doi:10.1080/03075079.2014.966670.
- Bettinger, E. 2015. “Need-Based Aid and College Persistence: The Effects of the Ohio College Opportunity Grant.” Educational Evaluation and Policy Analysis 37 (1_suppl): 102S–119S. doi:10.3102/0162373715576072
- Bowes, L., R. Morton, L. Thomas, A. Porter, J. Sheen, and B. Birkin. 2014. “Evaluation of the national scholarship programme – year 3.” Report to HEFCE by CFE Research and Edge Hill University.
- Callender, C. 2010. “Bursaries and Institutional aid in Higher Education in England: Do They Safeguard and Promote Fair Access?” Oxford Review of Education 36: 45–62. doi:10.1080/03054980903518910.
- Callender, C. 2014. “Strategies undertaken by Higher Education Institutions in England to increase awareness, knowledge, and take-up of their bursaries and scholarships.” Accessed 9 July 2022. https://core.ac.uk/download/pdf/141221974.pdf.
- Castleman, B. L., and B. T. Long. 2016. “Looking Beyond Enrollment: The Causal Effect of Need-Based Grants on College Access, Persistence, and Graduation.” Journal of Labor Economics 34 (4): 1023–73. doi:10.1086/686643.
- Chetwyn, A. G., and P. J. Diggle. 2013. “Bursaries negate effect of social class on probability of Dropout.” Accessed 6 March 2021. www.lancaster.ac.uk/staff/diggle/bursaries.pdf.
- Day, K. 2008. “The effect of financial aid on the persistence of university and college students in Canada.” Accessed 6 March 2021. http://higheredstrategy.com/mesa/pub/pdf/mesa_day_2008jul20.pdf.
- Denning, J. T., B. M. Marx, and L. J. Turner. 2019. “ProPelled: The Effects of Grants on Graduation, Earnings, and Welfare.” American Economic Journal: Applied Economics 11 (3): 193–224. doi:10.1257/app.20180100.
- Department for Education. 2016. “Revised a level and other level 3 results in England, 2014/2015.” Accessed 24 November 2021. https://assets.publishing.service.gov.uk/government/uploads/system/uploads/attachment_data/file/502158/SFR03_2016__A_level_and_other_level_3_results_in_England_SFR_revised.pdf.
- Equality Challenge Unit. 2015. Equality in Higher Education: Statistical Report 2013. London: Equality Challenge Unit.
- Fack, G., and J. Grenet. 2015. “Improving College Access and Success for Low-Income Students: Evidence from a Large Need-Based Grant Program.” American Economic Journal: Applied Economics 7 (2): 1–34. doi:10.1257/app.20130423.
- Goldrick-Rab, S., R. Kelchen, D. N. Harris, and J. Benson. 2016. “Reducing Income Inequality in Educational Attainment: Experimental Evidence on the Impact of Financial Aid on College Completion.” American Journal of Sociology 121 (6): 1762–817. doi:10.1086/685442.
- Gross, J. P. K., V. Torres, and D. Zerquera. 2013. “Financial Aid and Attainment Among Students in a State with Changing Demographics.” Research in Higher Education 54: 386–406. doi:10.1007/s11162-012-9276-1.
- Harrison, N., S. Davies, R. Harris, and R. Waller. 2018. “Access, Participation and Capabilities: Theorising the Contribution of University Bursaries to Students’ Well-Being, Flourishing and Success.” Cambridge Journal of Education 48: 677–95. doi:10.1080/0305764X.2017.1401586.
- Harrison, N., and C. McCaig. 2017. “Examining the Epistemology of Impact and Success of Educational Interventions Using a Reflective Case Study of University Bursaries.” British Educational Research Journal 43: 290–309. doi:10.1002/berj.3263.
- Hatt, S., A. Hannan, and A. Baxter. 2005. “Bursaries and Student Success: A Study of Students from Low-Income Groups at Two Institutions in the South West.” Higher Education Quarterly 59: 111–26. doi:10.1111/j.1468-2273.2005.00285.x.
- Hatt, S., A. Hannan, A. Baxter, and N. Harrison. 2005. “Opportunity Knocks? The Impact of Bursary Schemes on Students from low-Income Backgrounds.” Studies in Higher Education 30: 373–88. doi:10.1080/03075070500160038.
- Herbaut, E., and K. M. Geven. 2019. “What Works to Reduce Inequalities in Higher Education? A Systematic Review of the (Quasi-) Experimental Literature on Outreach and Financial Aid (No. 8802).” Policy Research Working Papers. doi:10.1596/1813-9450-8802.
- Hoare, T., and J. Lightfoot. 2015. “Student Funding, Student Retention and Student Experiences: Perspectives from Bristol.” Widening Participation and Lifelong Learning 17: 110–25. doi:10.5456/WPLL.17.3.110.
- Ilie, S., A. Horner, N. Kaye, and S. Curran. 2019. “Financial support and undergraduate outcomes in the University of Cambridge.” Accessed 6 March 2021. www.cao.cam.ac.uk/admissions-research.
- Kaye, N. 2021. “Evaluating the Role of Bursaries in Widening Participation in Higher Education: A Review of the Literature and Evidence.” Educational Review 73: 775–797. doi:10.1080/00131911.2020.1787954.
- O’Brien, M. 2015. “Student Finance, Progression and ‘Inclusivity’: Indicative Data from the University of Liverpool.” Widening Participation and Lifelong Learning 17: 74–88. doi:10.5456/WPLL.17.3.74.
- OFFA (Office for Fair Access). 2014. “An interim report: Do bursaries have an effect on retention rates?” https://dera.ioe.ac.uk//19608/.
- OFFA (Office for Fair Access). 2015. “What do we know about the impact of financial support on access and student success? Review of the research and evaluation of the impact of institutional financial support on access and student success.” Report to the Office for Fair Access (OFFA) by Nursaw Associates (March 2015).
- Office for Students. 2020. “Understanding the impact of the financial support evaluation kit: analysis and findings.” Accessed 1 November 2021. https://www.officeforstudents.org.uk/publications/financial-support-evaluation-toolkit-analysis/.
- Reed, R. J., and B. Hurd. 2016. “A Value Beyond Money? Assessing the Impact of Equity Scholarships: From Access to Success.” Studies in Higher Education 41: 1236–50. doi:10.1080/03075079.2014.968541.
- Schudde, L., and J. Scott-Clayton. 2016. “Pell Grants as Performance-Based Scholarships? An Examination of Satisfactory Academic Progress Requirements in the Nation’s Largest Need-Based Aid Program.” Research in Higher Education 57 (8): 943–67. doi:10.1007/s11162-016-9413-3.
- Thomas, L. 2012. “Building student engagement and belonging in Higher Education at a time of change: final report from the What Works?” Student Retention & Success programme.
- Zacharias, N., and J. Ryan. 2021. “Moving Beyond ‘Acts of Faith’: Effective Scholarships for Equity Students.” Journal of Higher Education Policy and Management 43: 147–165. doi:10.1080/1360080X.2020.1777499.