Abstract
In poultry rearing, medicated drinking water is a commonly used administration route, but drug uptake can be affected by many factors. In this study, the influence of two important parameters, the photoperiod and feeding schemes, on florfenicol uptake in turkeys was tested. First, the uptake was determined as the pharmacokinetic/pharmacodynamic profile of florfenicol; and second, we evaluated the clinical efficacy of florfenicol against Ornithobacterium rhinotracheale. Both experiments were conducted during a 5-day treatment of 30 mg/kg body weight florfenicol administered via drinking water and considering different photoperiods and feeding schemes (group 20/4L: photoperiod of 20 h, fed ad libitum; group 16/8L: photoperiod of 16 h, fed ad libitum; group 16/8R: photoperiod of 16 h, fed ad libitum but feed was withdrawn during the dark period and replaced 1 h after lighting). On day 1 of treatment, all groups showed plasma concentrations above the minimum inhibitory concentration (both MIC50 and MIC90, 1 mg/l) of 37.7%, 63.5% and 53.1% of a 24-h interval for 20/4L, 16/8L and 16/8R, respectively. Only in the 16/8L and 16/8R groups was the MIC also exceeded on day 5 (47.9% and 21.5% of a 24-h interval, respectively). In all groups, a clinical improvement could be noticed, resulting in reduction of the clinical score. However, only the 16/8L and 16/8R groups showed significant differences from the control group. The results demonstrated an important influence of the photoperiod on the pharmacokinetics of florfenicol as well as the clinical outcome in an infection model. It can be advised that the photoperiod should be <20 h to have sufficient drug intake. Nevertheless, there was no effect between fed and fasted turkeys for both the pharmacokinetics and the clinical outcome.
Introduction
Viral and bacterial respiratory diseases often affect turkeys during the rearing period, resulting in economic losses due to an increased mortality and feed conversion rate, a reduction in growth rate and high medical costs (Van Empel & Hafez, Citation1999).
Ornithobacterium rhinotracheale (ORT) is a Gram-negative bacterium that affects the respiratory tract causing severe respiratory signs, depression, reduction in feed uptake and growth rate. To exert its pathogenic action, this bacterium needs the association with a predisposing factor that primarily affects the respiratory tract, like viral infections (avian pneumovirus [APV], influenza virus, turkey rhinotracheitis virus, Newcastle disease virus) or environmental factors, such as poor management, inadequate ventilation, poor hygiene, high stocking density, high ammonia level, simultaneous infections, incorrect temperature and relative humidity, which can affect bird immunity (Van Empel & Hafez, Citation1999).
To control ORT infections in poultry-rearing, a strict biosecurity level and optimal environmental conditions are required. An effective vaccine is available but not commonly used in the field (Van Empel & Hafez, Citation1999; Murthy et al., Citation2007). Antimicrobial therapy can be applied during outbreaks but a careful evaluation has to be made on the antimicrobial agent choice as a high resistance level against a wide range of antimicrobial classes employed in aviculture has been reported (Van Veen et al., Citation2001; Soriano et al., Citation2003; Zaini et al., Citation2008). This choice is hampered by the absence of a commercial screening method for the evaluation of antimicrobial sensitivity. A study evaluated the efficacy of three antimicrobial drugs in an in vivo infection model against ORT in turkeys—that is, enrofloxacin (10 mg/kg), amoxicillin and florfenicol (FF) (both 20 mg/kg)—and enrofloxacin was found the most successful drug, followed by FF (Marien et al., Citation2006). However, in this research, plasma concentrations of FF were not measured and no correlation was made with the clinical outcome. Also no stability examinations of FF in the medicated drinking water were considered. A recent study proved the stability of FF during a 10-day period at concentrations of 10 and 100 µg/ml (Muijsers et al., Citation2012).
FF is a broad spectrum synthetic antibiotic developed for veterinary use. It is a structure analogue of thiamphenicol (TAP), with a fluorine atom at the 3′ carbon position. This antibiotic acts as an inhibitor of the protein synthesis at the 50S ribosomal subunit by blocking peptidyltransferase, and has a bacteriostatic action (Liu et al., Citation2003; Papich & Riviere, Citation2009). Efficacy of FF has been demonstrated against many animal diseases (Marien et al., Citation2007; Roiha et al., Citation2011; Thiry et al., Citation2011; Del Pozo Sacristan et al., Citation2012) and FF has been approved in Europe for treatment of fish, cattle, pigs and chickens (EMA, Citation2002). In pig and poultry farming it is current practice to administer antimicrobials via medicated feed or drinking water (Vermeulen et al., Citation2002). Drinking water medication is the most commonly used route of drug administration in intensively reared poultry, treating contemporaneously sick animals, but it can also give rise to some disadvantages. Drug intake between animals can vary dramatically due to both animal factors (hierarchy, flock size, sex, age, weight, species, breed, health status, etc.) and environmental factors (temperature, humidity, feed and water availability, photoperiod, etc.) (Vermeulen et al., Citation2002). Moreover, the solubility and stability of the drug is of utmost importance. Especially for FF, information about its stability in drinking water is scarce (Hayes et al., Citation2003).
Besides drug intake variabilities, there can be differences in pharmacokinetic (PK) properties of FF after oral administration in fasted and non-fasted broiler chickens (Shen et al., Citation2003; Baert & De Backer, Citation2006). These authors reported differences in bioavailability, maximum plasma concentration and time to maximum plasma concentration. Moreover, another study showed the influence of the applied photoperiod on the PKs of drugs during drinking water administration in turkeys (Santos et al., Citation1997). The eating and drinking patterns alter depending on the light scheme (Classen et al., Citation1994), which could have a huge influence on the uptake of drinking water medication. As FF is a time-dependent antibiotic (Hesje et al., Citation2007), it is important to have a frequent drug intake. Accordingly, a study with different housing conditions based on photoperiod and feeding schemes is mandatory for the establishment of an efficient treatment protocol.
The first aim of this research was to determine the minimum inhibitory concentration (MIC) of FF for ORT. Subsequently, we wanted to relate this to the plasma concentration–time curves, obtained after a continuous administration via the drinking water (30 mg/kg body weight [BW]) during a 5-day period, taking into account different photoperiods and feeding schemes. The last objective was to evaluate the efficacy of continuous water medication with 30 mg/kg BW of FF in turkeys against ORT infection in an in vivo infection model.
Materials and Methods
Micro-organisms
Thirty-eight ORT strains isolated from poultry affected by clinical disease were used. The MICs of FF were determined using the procedure described by Devriese et al. (Citation2001). The concentrations tested ranged between 0.0016 and 32 mg/l. Escherichia coli ATCC 25922 and Staphylococcus aureus ATCC 29213 were used as control strains, as indicated by the Clinical and Laboratory Standards Institute (Citation2008) guidelines.
The ORT strain LMG 9086T, used for the clinical infection experiment, was originally isolated from a turkey with a respiratory tract infection. The strain was serotyped as type A in an agar gel precipitation test, kindly performed by Prof. Hafez (Institute of Poultry Diseases, Free University of Berlin, Germany; Hafez & Sting, Citation1999). The strain was cultured for 48 h at 37 °C on Columbia agar (Oxoid Ltd, Basingstoke, UK) with 5% sheep blood in a 5% CO2 atmosphere, followed by growing into brain heart infusion broth (Oxoid) for 24 h at 37 °C with agitation. The cultured bacteria were washed twice in phosphate-buffered saline (PBS) followed each time by 5 min of centrifugation at 1509×g at 4°C. The bacterial challenge inoculum was prepared by resuspending the pellet in PBS to obtain a final concentration of 108 colony-forming units (CFU)/ml. To confirm the titre, 10-fold dilutions in PBS were inoculated on sheep blood agar and the number of colonies was counted.
The APV strain A/T6/96 (subtype A) was kindly donated by Prof. Nauwynck (Laboratory of Virology, Faculty of Veterinary Medicine, Ghent University, Belgium). The strain was isolated during a respiratory outbreak on a Belgian turkey farm (Van de Zande et al., Citation1998).
Birds
Seventy-four 1-day-old female turkeys (Moorgut Kartzfehn, Bösel, Germany) were housed according to the requirements of the European Union (Anonymous, Citation2007a). They were kept together in an isolation room with HEPA-filtered air on wood shavings, had free access to feed and water, and received 15 h of light/day. At 2 weeks of age they were divided into two groups, for the PK/pharmacodynamic (PD) study (18 birds) and for the clinical trial (56 birds). The birds were acclimatized for 8 days.
The PK/PD study and the clinical trial were approved by the Ethical Committee of Ghent University (Project numbers EC2011/001, EC2011/027 and EC2011/096).
Veterinary drug, chemicals and solutions
The veterinary drug used was a water-soluble granulated formulation of FF (not yet commercialized). These granules are composed of 200 mg FF and excipients (such as maltodextrin and polyethylene glycol 400) up to 1 g (20% FF).
FF analytical standard (99.0%) was obtained from Dr. Ehrenstorfer GmbH (Augsburg, Germany) and TAP (>97.5%) was purchased from Sigma-Aldrich (Bornem, Belgium).
All products (sodium hydroxide and acetic acid) and reagents (high-performance liquid chromatography-grade methanol and water, analytical-grade ethyl acetate) were purchased from VWR (Leuven, Belgium). Ultra-performance liquid chromatography water and acetonitrile were obtained from Biosolve (Valkenswaard, the Netherlands).
Millex®-GV PVDF filter units (0.22 µm) were obtained from Millipore (Brussels, Belgium).
Stock solutions (1 mg/ml) of each analyte were prepared in methanol. By diluting the stock solutions with methanol, working solutions of 0.1, 0.2, 0.5, 1, 2, 5, 10, 20, 50, 100, 200 and 400 µg/ml FF and of 50 µg/ml TAP were obtained. The FF stock and working solutions were stable for 9 months at 2 to 8°C and TAP solutions were stable for 111 days at 2 to 8°C.
Pharmacokinetic/pharmacodynamic study
Eighteen turkeys, with a mean±standard deviation (SD) BW of 573±52 g were randomly divided into three groups (six birds/group) with different environmental conditions. The first group received 20 h light (between 08:00 and 04:00 h)/4 h dark and was fed ad libitum (20/4L). The second group received 16 h light (between 08:00 and 0:00 h)/8 h dark and was fed ad libitum (16/8L), and the third group had the same light cycle and was fed ad libitum except during the dark period in which feed was taken away (16/8R). These birds received feed again 1 h after the light was put on.
FF was administered continuously to the three groups via the drinking water during a 5-day period (target dose: 30 mg/kg BW). In order to determine the inclusion rate of the drug in the drinking water and to evaluate the real amount of drug ingested, all birds were weighed before the treatment and the water uptake was measured daily from 3 days before until the end of the treatment.
Blood (1 ml) was collected by venipuncture from the medial metatarsal vein into heparinized tubes (Vacutest Kima; Novolab, Geraardsbergen, Belgium) at different time points: immediately before (time 0), at 1, 2.5, 5, 7.5, 10, 15 and 24 h on day 1 and day 5, and on day 5 also at 26, 28 and 32 h. Plasma was separated by centrifugation and stored at −70°C, pending analysis.
Water samples of the medicated drinking water were collected daily immediately after its preparation and after 24 h, in order to evaluate the homogeneity and stability, respectively. Medicated drinking water was replaced every 24 h by a freshly prepared solution. The medicated drinking water samples were stored at −70°C pending assay.
Florfenicol analyses in plasma and drinking water
Quantification of FF in the plasma samples was performed using an in-house developed and validated liquid chromatography–tandem mass spectrometry method.
The plasma samples (250 µl) were spiked with 12.5 µl of the internal standard (IS) TAP (50 µg/ml), followed by vortexing (15 sec) and an equilibration period (5 min). Subsequent to the addition of 100 µl sodium hydroxide 1 M, the samples were vortexed (15 sec), mixed with 4 ml ethyl acetate, and again vortexed (15 sec). The samples were extracted by horizontal rolling for 20 min, followed by centrifugation (3725×g, 10 min). The supernatant was transferred to a glass tube and evaporated to dryness using a nitrogen stream (40°C). The residue was redissolved into 250 µl of 0.1% acetic acid in water and acetonitrile (80:20, v/v), filtered through a 0.22 µm Millex®-GV PVDF filter and transferred to an autosampler vial.
The water samples were diluted 500 times with high-performance liquid chromatography water. An aliquot of 250 µl was spiked with 12.5 µl of the IS TAP working solution (50 µg/ml), followed by vortexing (15 sec), and was transferred to an autosampler vial.
The liquid chromatography system consisted of a quaternary, low-pressure mixing pump with vacuum degassing, type Surveyor MSpump Plus and an autosampler with temperature-controlled tray and column oven, type Surveyor Autosampler Plus, from Thermo Scientific (Breda, the Netherlands).
The chromatographic separation was achieved on a Hypersil Gold column (50×2.1 mm internal diameter, particle size 1.9 µm) with a guard column of the same type (Hypersil Gold; 10×2.1 mm internal diameter, particle size 3 µm), both from Thermo Scientific.
The column temperature was maintained at 45°C. The injection volume was 10 µl and the analysis was carried out with gradient elution using (A) 0.1% acetic acid in ultra-performance liquid chromatography water and (B) ultra-performance liquid chromatography acetonitrile as the mobile phases at a flow rate of 0.30 ml/min. The gradient conditions were as follows: 0 to 2.2 min: 85% A, 15% B; 2.2 to 2.5 min: linear gradient to 20% A; 2.5 to 3.8 min: 20% A, 80% B; 3.8 to 4.0 min: linear gradient to 85% A; and 4.0 to 6.0 min: 85% A, 15% B.
The liquid chromatography column effluent was interfaced to a TSQ Quantum Ultra triple quadrupole mass spectrometer, equipped with a heated electrospray ionization probe (all from Thermo Scientific). The analysis of FF and TAP was performed in negative ionization mode.
Instrument parameters were optimized for the analytes. For each compound, the two most intense precursor ion > product ions transitions were selected and monitored in the selected reaction monitoring mode. The most intense product ion was used for quantification (i.e. FF: m/z 356.1 > 336.0, TAP: m/z 354.1 > 185.0).
Prior to routine application, the method was validated in-house by a set of parameters (linearity, within-run and between-run accuracy and precision, limit of quantification, limit of detection, selectivity) that were in compliance with the recommendations as defined by the European Community (Anonymous, Citation2002) and with reference guidelines defined in other European Union and US Food and Drug Administration documents (Knecht & Stork, Citation1974; Heitzman, Citation1994; VICH GL 49, Citation2012). Quadratic calibration curves were constructed using matrix-matched calibrator samples (concentration range: 10 to 5000 ng/ml) and the correlation coefficients (r=0.9983±0.0003, n=6) and goodness-of-fit coefficients (g=13.25±1.75%, n=6) fell within the accepted ranges; that is, r≥0.99 and g<20%, respectively.
Within-day precision (repeatability) and accuracy were determined by analysing blank samples that were spiked at 25 (n=5), 250 (n=6) and 2500 (n=5) ng/ml on the same day. The between-day precision and accuracy were determined by analysing quality control samples (concentration level: 100 (n=10), 250 (n=6) and 2500 (n=7) ng/ml) together with each analytical batch of samples, run on different days. The following mean results were obtained: within-run accuracy and precision 22.2±2.0, 264.6±26.3 and 2632.8±100.5 ng/ml; and between-run accuracy and precision 94.9, 200.8 and 2490.0 ng/ml. The results fell within the accepted ranges for accuracy (−20% to + 10% of the theoretical concentration) and precision (within-run precision: relative standard deviation [RSD] ≤ RSDmax with RSDmax= 2(1−0.5logConc)×2/3, i.e. 18.6%, 13.1% and 9.3% at 25, 250 and 2500 ng/ml, respectively; between-run precision: RSD ≤ RSDmax with RSDmax= 2(1−0.5logConc), i.e. 22.6%, 19.7% and 13.9% at 100, 250 and 2500 ng/ml, respectively).
A limit of quantification of 25 ng/ml was obtained. All values below the limit of quantification were not included in the plasma concentration–time curves and the PK analysis. The limit of detection was defined as the concentration corresponding with a signal-to-noise ratio of 3 and was found to be 0.013 ng/ml. The specificity of the method was shown, since no interferences from endogenous compounds were observed.
Clinical experiment
The birds were randomly divided into four groups (14 birds each) with different environmental conditions for the light scheme and the feeding period (groups 20/4L, 16/8L, 16/8R and control [C, with the same conditions as 16/8L]).
All birds were negative for maternally-derived antibodies to APV and ORT at 2 weeks, by analysing the blood using commercially available enzyme-linked immunosorbent assay kits (Biochek, Gouda, the Netherlands). Tracheal swabs from all birds were collected and analysed to verify the absence of ORT.
At 23 days of age all birds were infected oculonasally with APV at a dose of 4.4 log10 median ciliostatic dose, using a virus stock titre of 5.5 log10 median ciliostatic dose/ml after the third passage in tracheal organ cultures.
Three days post viral infection, all birds were infected with ORT at a dose of 8.5 log10 CFU by dividing a total of 250 µl inoculum equally over the nostrils and eyes.
Group C was not treated with FF, while the three other groups (20/4L, 16/8L and 16/8R) received FF continuously via the drinking water during a 5-day period (target dose: 30 mg/kg BW) starting 1 day post bacterial inoculation (p.b.i.). Birds were all weighed on the day of APV inoculation, and again on the day of ORT inoculation. The water uptake was measured daily from 3 days before until the end of the treatment. These data were used to determine the inclusion of FF in the medicated drinking water and to evaluate the exact amount of drug received daily (based on BW and drinking water intake).
A clinical examination of all turkeys was made daily until 14 days p.b.i., and the clinical signs of birds were scored as follows: 0, no clinical signs; 1, clear nasal exudates; 2, turbid nasal exudates; 3, nasal exudates with mild swollen infra-orbital sinuses; 4, nasal exudates with extreme swollen infra-orbital sinuses; 5, nasal exudates with extreme swollen infra-orbital sinuses and frothy eyes; and 6, death.
Tracheal swabs were collected from all groups for quantification of ORT using cotton-tipped aluminium shafted swabs (Copan Diagnostics Inc., Corona, California, USA) at 1, 2, 4, 6, 8, 10 and 14 days p.b.i. Swabs were processed immediately after collection and the quantification (CFU/mg mucus) was performed as described by Marien et al. (Citation2005).
Six birds of each group were sacrificed at 6 days p.b.i. and the remaining birds were sacrificed at 14 days p.b.i. Euthanasia was performed by intravenous injection of 0.3 ml/kg BW of T61® (Intervet, Brussels, Belgium). Necropsy of all birds was performed to evaluate the presence of gross lesions. At 6 days p.b.i., samples of the trachea and lungs were collected for ORT quantification. A 10% tissue suspension in PBS was prepared from these samples. The air sacs were sampled with cotton swabs for bacterial isolation. At day 14 p.b.i. the trachea, lungs and air sacs were sampled with cotton swabs for ORT isolation. All samples were processed immediately after collection following the procedure described by Garmyn et al. (Citation2009a, Citationb).
Pharmacokinetic/pharmacodynamic modelling and statistical analyses
The PK/PD index calculated was the time that the plasma concentration remained above the MIC, defined as the cumulative percentage of time over a 24-h period that the drug concentration exceeds the MIC. This is expressed as a percentage of 24 h, which is the PK/PD breakpoint and should be more than 40% (Hesje et al., Citation2007).
Normality of the data in the clinical trial was assessed by the Kolmogorov–Smirnov test. The pharmacokinetics and the parameters evaluated as a part of the clinical trial were statistically analysed by means of single-factor analysis of variance with Bonferroni correction. The area under the curve (AUC) and AUCday 1 to 6 p.b.i. of the bacterial titre and the isolation of ORT in trachea and lung were analysed by the Kruskal–Wallis test. P < 0.05 was considered statistically significant.
For the analysis of clinical score and tracheal swabs, both the mean score and the AUC were considered. The AUC was calculated by the linear trapezoidal rule. These statistical analyses were performed using SPSS Statistics 20 (IBM SPSS Software, New York, USA).
Results
Minimum inhibitory concentration evaluation
The in vitro activity of FF against 38 field ORT strains was tested. The MIC50 and MIC90 values were both 1 mg/l. The following MIC values were obtained: 0.5, 1.0, 2.0 and 4.0 mg/l in respectively three (7.9%), 32 (84.2%), two (5.3%) and one (2.6%) of the 38 strains tested.
Pharmacokinetic/pharmacodynamic study
The inclusion rate of FF in the medicated drinking water was determined on the basis of mean BW and water uptake per group and it was between 67.5 and 144.3 mg/l. The daily water intake remained constant before, during and after the treatment in the three groups (mean±SD: 1.69±0.13 l). The mean effective drug intake ranged from 28.2 to 33.1 mg/kg BW/day for all groups, with the exception of group 16/8R that drank less on day 5 and therefore received only 24.4 mg/kg BW.
The mean (±SD) FF concentration in the medicated drinking water just after preparation was 100.16 (±0.50)% of the theoretical concentration, indicating a good homogeneity. After 24 h, the FF concentration was 100.41 (±0.96)% of the initial concentration (t=0 h), confirming the excellent stability of FF in the medicated drinking water.
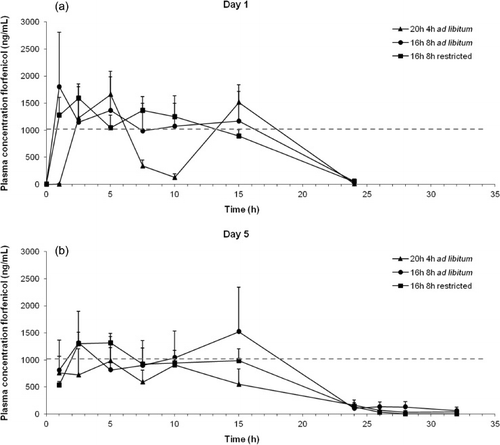
The mean plasma concentration–time profiles of FF and the MIC value are depicted in for day 1 and day 5, respectively. Remarkably, on day 1 almost all birds of the 20/4L group had a drop in their FF plasma concentration (<400 ng/ml) between 5 and 10 h after the start of medication (5/6 turkeys), while none of the other groups presented these low FF concentrations. On day 1, plasma concentrations above the MIC of 37.7%, 63.5% and 53.1% of a 24 h interval for the 20/4L, 16/8L and 16/8R groups, respectively could be seen. However, on day 5 group 20/4L never reached the MIC and groups 16/8L and 16/8R exceeded the MIC for 47.9% and 21.5% of a 24-h interval, respectively.
Clinical experiment
During the experiments, mortalities did not take place in any of the experimental groups.
Tracheal swabs before infection were all negative for ORT. All turkeys received between 28.8 and 32.1 mg FF/kg BW/day during the treatment period.
The mean BW (±SD) for each group of turkeys on the day before the bacterial infection and 6 and 14 days p.b.i. are reported in . At all occasions, there was no significant difference in BW between groups.
Table 1. Clinical score, tracheal ORT titres, isolation of ORT from several organs and mean body weight of turkeys inoculated with APV and ORT with an interval of 3 days and treated with 30 mg/kg FF via drinking water for 5 days, with different photoperiods.
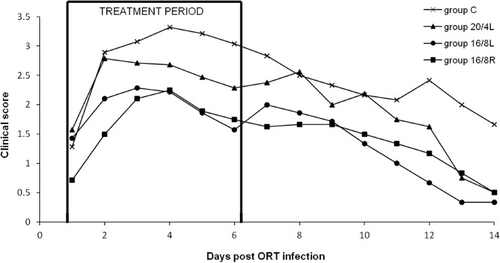
As can be seen in , respiratory signs were observed in the four experimental groups, starting from day 1 p.b.i., followed by a decrease of the clinical score around day 4 p.b.i. There were statistically significant differences between groups 16/8L and C, with P<0.01, and between groups 16/8R and C with P<0.01 for AUCday 1 to 14 p.b.i. (mean±SD) of the clinical score.
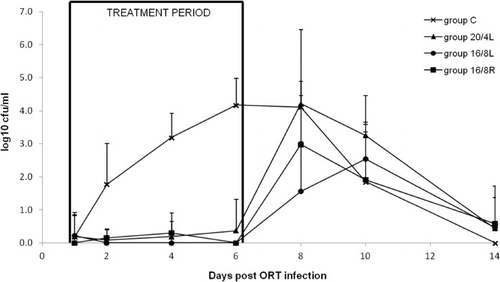
shows ORT titres in tracheal swabs over a period of 14 days. Up to 6 days p.b.i. no increase in titres could be observed in the groups treated with FF. This resulted in significant differences for the AUCday 1 to 14 p.b.i. (mean±SD) between group C and all treated groups ().
Results of necropsy are depicted in . Bacterial titres of trachea and lung samples collected 6 days p.b.i. showed a significant difference between the non-treated group (group C) and all other groups. Samples collected 14 days p.b.i. showed no statistical difference between groups. Almost all tissues were negative for ORT.
Discussion
Medicated drinking water is a commonly used administration route to treat intensively reared poultry. As already reported, however, drug intake can be affected by many factors using this way of oral medication. In this study, the influence of two important parameters, namely the photoperiod and feeding schemes, on FF uptake using drinking water administration has been tested. The results demonstrated an important influence of the photoperiod on the PK of FF as well as the clinical outcome in an ORT infection model. Nevertheless, there was no effect of the feeding schemes.
To the authors' knowledge, this is the first study to evaluate the in vitro susceptibility of several ORT strains to FF. Also no susceptibility breakpoints have yet been defined. The very strict range of ORT MIC values reported for the 38 field strains suggested that 1 mg/l might be the MIC value of the wild type of this bacterium. The unimodal distribution of the MIC values suggests there is no indication for acquired antimicrobial resistance. As the evaluated bacterial population is perhaps not large enough, further studies are necessary to confirm these data.
FF is considered mainly a time-dependent drug, in which the time above the MIC must be a minimum 40% (Hesje et al., Citation2007). The two groups with 16 h of light fulfilled this criterion on day 1 (63.1% and 53.1% for 16/8L and 16/8R, respectively). The group 20/4L displayed a very irregular plasma concentration versus time curve on day 1, with a limited time period above MIC (37.7%) and a very low plasma concentration until 1 h post administration (<5ng/ml). On day 5, the group 16/8R did not achieve 40% (only 21.5%), but this seems to be related to a reduced water uptake of unknown reason. From these plasma concentration–time curves, it is obvious that the photoperiod for group 20/4L is unfavourable to reach sufficient plasma levels. Furthermore, it has to be mentioned that this light scheme is no longer allowed in poultry rearing; a minimum of 6 h of light is required nowadays (Anonymous, Citation2007b). Classen et al. (Citation1994) demonstrated that turkeys given a gradually increased light pattern ate and drank more frequently compared with turkeys given constant light. Also other studies in chickens and turkeys have already related extreme photoperiods to a change in feeding cycles (Newberry, Citation1992; Brown et al., Citation2008; Lewis et al., Citation2009). Birds with a very short (<6h light) as well as a continuous photoperiod seemed to have a reduced feed intake. The former can be due to too short a photoperiod for the higher diurnal rate of feeding to compensate for reduced nocturnal feeding rate. A second reason could be the absence of the need to store feed for a dark period in the case of a continuous photoperiod (Lewis et al., Citation2009). As feeding uptake in birds is strongly connected with water uptake, changes in photoperiod can easily affect also the drinking water uptake. Santos et al. (Citation1997) have reported the same effect during the administration of doxycycline, and underlined the importance of photoperiod during continuous water administration of drugs, especially if the applied drug has a short half-life of elimination. The unusual plasma concentration-time curve in our 20/4L group could be related to an atypical water uptake, as a result of a too short a dark period.
Baert & De Backer (Citation2006) reported a distinct difference between the PK properties of FF administered by oral bolus to fed and non-fed broilers; in particular, the latter showed higher maximum plasma concentrations and AUC. A bolus administration of FF in fed chickens can show a flip-flop mechanism with a good bioavailability. This is probably due to the presence of the crop, which can act as a reservoir when it is filled with food. This effect could also be important in continuous administration, because birds tend to drink after eating (Baert & De Backer, Citation2006). Other studies in birds confirm these findings (Shen et al., Citation2003; Chang et al., Citation2010). These authors obtained the same values as Baert & De Backer (Citation2006) for the maximum plasma concentration in fasted birds, which was 10-fold higher in comparison with our results. However, no differences in plasma concentrations between groups 16/8L and 16/8R have been pointed out in our study. There could be several reasons for these findings. First of all, the experiments were performed in different species (chicken vs. turkey). Also, the route of administration is very important. In contrast to previous studies whereby the chickens received a bolus of FF, we administered the drug via continuous drinking water medication. Finally, the restricted and the ad libitum group both received 16 h of light, which was demonstrated as a good photoperiod. Consequently, all turkeys showed a rest period before the light switched on (24 h), suggesting that they did not eat in the dark period.
In PK studies in poultry, it has been showed that FF has a high extravascular distribution in the kidney, lung, bile, muscle, gut, heart, liver and spleen, which may be responsible for the reduced circulating concentrations of the drug (Afifi & El-Sooud, Citation1997; El-Banna, Citation1998; Anadon et al., Citation2008). Switala et al. (Citation2007) reported a rather short half-life of elimination (3.76 h) in turkeys after an oral bolus of 30 mg/kg. This corresponds to our results, where no FF could be detected in the plasma at the 24 h time point.
The clinical scores highlight a difference between the two photoperiods, the 20/4L group has a score that is intermediate between the other two treated groups and the untreated group C. This is in accordance with our findings as previously discussed. The replication degree of ORT in the trachea at the end of the therapy confirms this difference. The decreased efficacy of the therapy in group 20/4L is most probably related to the irregular and too low plasma concentration of the drug as mentioned in the PK/PD study. No differences were seen between groups 16/8L and 16/8R. Therefore, we can conclude that there was no effect of feed restriction on the therapeutic results.
Marien et al. (Citation2006) tested FF (20 mg/kg BW) in the same in vivo infection model (ORT and APV) and reported no significant reduction in clinical signs. FF did reduce the bacterial titre, but only to 3 log10 CFU/g mucus. However, during our clinical trial, the administration of a higher dose of 30 mg FF/kg BW via the drinking water for a 5-day period did allow us to reduce the bacterial titre in tracheal swabs 6 days p.b.i. to less than 1 log10 CFU/ml in all treated groups. This discrepancy between the two studies could be related to the different dose of the drug and a totally different formulation of FF, which leads to a high homogeneity and stability of the antibiotic in the drinking water.
In general, drug therapy directed to secondary bacterial infections causes a substantial reduction in bacterial titres. This allows the animal to recover fairly easily from viral infections that enhance the pathogenic action of ORT (Hafez, Citation2005; Marien et al., Citation2007). For every treated group, the bacterial titre remained below 0.5 log10 CFU/ml during the administration of the drug. A few days after the end of the treatment, there was an increase of the bacterial growth to 3 and 4 log10 CFU/ml for the groups with 16 and 20 h of light, respectively. However, the mean clinical score in the first 3 days of antibiotic administration was high, in which group C had the highest score, followed by respectively the groups with 20 and 16 h of light. The presence of the clinical signs in the treated groups seems to be rather associated with APV infection alone, as already reported by other investigators (Van de Zande et al., Citation2001). From day 4 of treatment onward, these clinical scores were strongly reduced. Accordingly, it can be stated that the administration of FF at the onset of the viral respiratory infection can significantly reduce clinical signs caused by secondary bacterial infections, such as ORT.
In conclusion, this study confirms the negative influence of a light scheme with 20 h of light in drug administration as reported by Santos et al. (Citation1997). The continuous administration of 30 mg FF/kg BW via the drinking water for 5 days at a photoperiod of 16 h seems to be effective to cure an ORT infection in turkeys. Replacing the drinking water once daily would be sufficient because FF is stable over a 24-h period.
Acknowledgements
The authors wish to thank A. Van de Kerckhove and A. Van den Bussche for their excellent technical assistance, and M. Devreese, J. Goossens, J. Lambrecht and E. Plessers for their aid in the bird experiments.
References
- Afifi, N.A. & El-Sooud, K.A. (1997). Tissue concentrations and pharmacokinetics of florfenicol in broiler chickens. British Poultry Science, 38, 425–428.
- Anadon, A., Martinez, M.A., Martinez, M., Rios, A., Caballero, V., Ares, I. & Martinez-Larranaga, M.R. (2008). Plasma and tissue depletion of florfenicol and florfenicol-amine in chickens. Journal of Agricultural and Food Chemistry, 56, 11049–11056.
- Anonymous. (2002). Commission Decision 2002/657/EC. Implementing Council Directive 96/23/EC Concerning the Performances of Analytical Methods and the Interpretation of Results. Official Journal of the European Communities, No. L221, 17/08/2002. Brussels: European Commission, Directorate General for Public Health and Consumers Protection.
- Anonymous. (2007a). Appendix A to the European Conventions for the Protection of Vertebrate Animals used for Experimental and Other Scientific Purposes (ETS No. 123). Guidelines for Accommodation and Care of Animals ( Art. 5 of the Convention). Strasbourg: Council of Europe.
- Anonymous. (2007b). Council Directive 2007/43/EC. Laying down minimum rules for the protection of chickens kept for meat production. Official Journal of the European Union, No. L182/19-28, 28/06/2007.
- Baert, K. & De Backer, P. (2006). Pharmacokinetics and bioavailability of oral florfenicol in fasted and fed broiler chickens. Journal of Veterinary Pharmacology and Therapeutics, 29(Suppl. 1), 279.
- Brown, A.J., Webster, A.B., Fairchild, B.D. & Buhr, R.J. (2008). Photoperiod effects on broiler behaviour. Poultry Science Association Meeting Abstract, 87(Suppl. 1), 191.
- Chang, S.K., Davis, J.L., Cheng, C.N., Shien, R.H., Hsieh, M.K., Koh, B.W. & Chou, C.C. (2010). Pharmacokinetics and tissue depletion of florfenicol in Leghorn and Taiwan Native chickens. Journal of Veterinary Pharmacology and Therapeutics, 33, 471–479.
- Classen, H.L., Riddell, C., Robinson, F.E., Shand, P.J. & McCurdy, A.R. (1994). Effect of lighting treatment on the productivity, health, behaviour and sexual maturity of heavy male turkeys. British Poultry Science, 35, 215–225.
- Clinical and Laboratory Standard Institute. (2008). Performance Standards for Antimicrobial Disk and Dilution Susceptibility Test for Bacteria Isolated from Animals: Approved Standard – Thirth edition M31-A3. Wayne, PA: CLSI.
- Del Pozo Sacristan, R., Thiry, J., Vranckx, K., Lopez Rodriguez, A., Chiers, K., Haesebrouck, F., Thomas, E. & Maes, D. (2012). Efficacy of florfenicol injection in the treatment of Mycoplasma hyopneumoniae induced respiratory disease in pigs. Veterinary Journal, 194, 420–422.
- Devriese, L.A., De Herdt, P. & Haesebrouck, F. (2001). Antibiotic sensitivity and resistance in Ornithobacterium rhinotracheale strains from Belgian broiler chickens. Avian Pathology, 30, 197–200.
- El-Banna, H.A. (1998). Pharmacokinetics of florfenicol in normal and Pasteurella-infected Muscovy ducks. British Poultry Science, 39, 492–496.
- EMA. (2002). The European Agency for the Evaluation of Medicinal Products. Florfenicol (Extension to all food producing species). Summary Report (6). EMEA/MRL/822/02-FINAL January 2002. London: Committee for Veterinary Medicinal Products.
- Garmyn, A., Martel, A., Froyman, R., Ludwig, C., Nauwynck, H., Haesebrouck, F. & Pasmans, F. (2009a). The effect of reduced treatment time and dosage of enrofloxacin on the course of respiratory disease caused by avian metapneumovirus and Ornithobacterium rhinotracheale. Poultry Science, 88, 2315–2323.
- Garmyn, A., Martel, A., Froyman, R., Nauwynck, H., Duchateau, L., Haesebrouck, F. & Pasmans, F. (2009b). Efficacy of four enrofloxacin treatment regimens against experimental infection in turkey poults with avian pneumovirus and Ornithobacterium rhinotracheale. Avian Pathology, 38, 287–292.
- Hafez, H.M. (2005). Current knowledge and prospective risk analysis related to the ongoing turkey diseases. In Proceedings of the 14th Veterinary Poultry Congress (pp. 138–149). Istanbul, Turkey.
- Hafez, H.M. & Sting, R. (1999). Investigations on different Ornithobacterium rhinotracheale “ORT” isolates. Avian Diseases, 43, 1–7.
- Hayes, J.M., Eichman, J., Katz, T. & Gilewicz, R. (2003). Stability of florfenicol in drinking water. Journal of AOAC International, 86, 22–29.
- Heitzman, R.J.. (1994). Veterinary Drug Residues, Report Eur. 14126-EN. Brussels-Luxembourg: Commission of the EC.
- Hesje, C.K., Tillotson, G.S. & Blondeau, J.M. (2007). MICs, MPCs and PK/PDs: a match (sometimes) made in hosts. Expert Review of Respiratory Medicine, 1, 7–16.
- Knecht, J. & Stork, G. (1974). Percentage and logarithmic procedures for calculation of calibration curves. Fresenius' Zeitschrift für Analytische Chemie, 270, 97–99.
- Lewis, P.D., Danisman, R. & Gous, R.M. (2009). Photoperiodic responses of broilers. I. Growth, feeding behaviour, breast meat yield, and testicular growth. British Poultry Science, 50, 657–666.
- Liu, J., Fung, K.F., Chen, Z., Zeng, Z. & Zhang, J. (2003). Pharmacokinetics of florfenicol in healthy pigs and in pigs experimentally infected with Actinobacillus pleuropneumoniae. Antimicrobial Agents and Chemotherapy, 47, 820–823.
- Marien, M., Decostere, A., Duchateau, L., Chiers, K., Froyman, R. & Nauwynck, H. (2007). Efficacy of enrofloxacin, florfenicol and amoxicillin against Ornithobacterium rhinotracheale and Escherichia coli O2:K1 dual infection in turkeys following APV priming. Veterinary Microbiology, 121, 94–104.
- Marien, M., Decostere, A., Martel, A., Chiers, K., Froyman, R. & Nauwynck, H. (2005). Synergy between avian pneumovirus and Ornithobacterium rhinotracheale in turkeys. Avian Pathology, 34, 204–211.
- Marien, M., Nauwynck, H., Duchateau, L., Martel, A., Chiers, K., Devriese, L., Froyman, R. & Decostere, A. (2006). Comparison of the efficacy of four antimicrobial treatment schemes against experimental Ornithobacterium rhinotracheale infection in turkey poults pre-infected with avian pneumovirus. Avian Pathology, 35, 230–237.
- Muijsers, M., Martel, A., Van Rooij, P., Baert, K., Vercauteren, G., Ducatelle, R., De Backer, P., Vercammen, F., Haesebrouck, F. & Pasmans, F. (2012). Antibacterial therapeutics for the treatment of chytrid infection in amphibians: Columbus's egg? BMC Veterinary Research, 8, 175.
- Murthy, T.R., Dorairajan, N., Balasubramaniam, G.A., Dinakaran, A.M. & Kalaimathi, R. (2007). The effect of vaccination of pullets against Ornithobacterium rhinotracheale infection. Avian Pathology, 36, 481–485.
- Newberry, R.C. (1992). Influence of increasing photoperiod and toe clipping on breast buttons of turkeys. Poultry Science, 71, 1471–1479.
- Papich, M.G. & Riviere, J.E. (2009). Chloramphenicol and derivatives, macrolides, lincosamides, and miscellaneous antimicrobials. In J.E. Riviere & M.G. Papich (Eds.) Veterinary Pharmacology and Therapeutics (9th ed.; pp. 945–982). Ames, IO: Wiley Blackwell.
- Roiha, I.S., Samuelsen, O.B. & Harboe, T. (2011). Efficacy of florfenicol in the treatment of bacterial infections in halibut, Hippoglossus hippoglossus (L.), larvae. Journal of Fish Diseases, 34, 927–930.
- Santos, M.D., Vermeersch, H., Remon, J.P., Schelkens, M., De Backer, P., Ducatelle, R. & Haesebrouck, F. (1997). Administration of doxycycline hydrochloride via drinking water to turkeys under laboratory and field conditions. Poultry Science, 76, 1342–1348.
- Shen, J., Hu, D., Wu, X. & Coats, J.R. (2003). Bioavailability and pharmacokinetics of florfenicol in broiler chickens. Journal of Veterinary Pharmacology and Therapeutics, 26, 337–341.
- Soriano, V.E., Vera, N.A., Salado, C.R., Fernandez, R.P. & Blackall, P.J. (2003). In vitro susceptibility of Ornithobacterium rhinotracheale to several antimicrobial drugs. Avian Diseases, 47, 476–480.
- Switala, M., Hrynyk, R., Smutkiewicz, A., Jaworski, K., Pawlowski, P., Okoniewski, P., Grabowski, T. & Debowy, J. (2007). Pharmacokinetics of florfenicol, thiamphenicol, and chloramphenicol in turkeys. Journal of Veterinary Pharmacology and Therapeutics, 30, 145–150.
- Thiry, J., Rubion, S., Sarasola, P., Bonnier, M., Hartmann, M. & de Haas, V. (2011). Efficacy and safety of a new 450 mg/ml florfenicol formulation administered intramuscularly in the treatment of bacterial bovine respiratory disease. The Veterinary Record, 169, 526.
- Van de Zande, S., Nauwynck, H., Cavanagh, D. & Pensaert, M. (1998). Infections and reinfections with avian pneumovirus subtype A and B on Belgian turkey farms and relations to respiratory problems. Journal of Veterinary Medicine Series B, 45, 621–626.
- Van de Zande, S., Nauwynck, H. & Pensaert, M. (2001). The clinical, pathological and microbiological outcome of an Escherichia coli O2:K1 infection in avian pneumovirus infected turkeys. Veterinary Microbiology, 81, 353–365.
- Van Empel, P.C.M. & Hafez, H.M. (1999). Ornithobacterium rhinotracheale: a review. Avian Pathology, 28, 217–227.
- Van Veen, L., Hartman, E. & Fabri, T. (2001). In vitro antibiotic sensitivity of strains of Ornithobacterium rhinotracheale isolated in The Netherlands between 1996 and 1999. The Veterinary Record, 149, 611–613.
- Vermeulen, B., De Backer, P. & Remon, J.P. (2002). Drug administration to poultry. Advanced Drug Delivery Reviews, 54, 795–803.
- VICH GL 49. (2012-Final). Guidance for Industry, Studies to Evaluate the Metabolism and Residue Kinetics of Veterinary Drugs in Food Producing Animals: Validation of Analytical Methods Used in Residue Depletion Studies, February 2011. VICH Steering Committee.
- Zaini, M.Z., Tan, L.J. & Kamaruzaman, J. (2008). Phenotypic characteristics, antibiotic susceptibility and pathogenicity of Ornithobacterium rhinotracheale. WSEAS Transaction on Biology and Biomedicine, 7, 133–142.