
ABSTRACT
Serum resistance is a poorly understood but common trait of some systemic disease pathogenic strains of bacteria. In this study, we analysed the role Escherichia coli type III secretion system 2 (ETT2) of avian pathogenic Escherichia coli (APEC) in serum resistance by bacteria survival number in serum culture, mRNA Seq and Tandem Mass Tag™ (TMT™) detection, lipopolysaccharide (LPS) extraction, and biofilm formation detection. We found that the ETT2 gene cluster deletion strain (ΔETT2) is more resistant to the killing effect of serum than wild-type APEC40. The analysis of ΔETT2 compared to APEC40 in the transcriptomics and proteomics data showed that ETT2 has a negative effect in the ATP-binding cassette (ABC) translator system and quorum sensing system and a positive effect in purine metabolism. ETT2 may affect the LPS, biofilm, flagella, and fimbriae which may affect the serum resistance. These results could lead to effective strategies for managing the infection by APEC. The mRNA Seq data of this study are available in the Sequence Read Archive of the National Center for Biotechnology Information under the BioProject PRJNA757182, and proteomic raw data have been deposited under the accession number IPX0003420000 at iProX.
Introduction
In order to survive and multiply in the host’s body, bacteria have evolved a variety of secretion systems with special functions to create a “reproduction place” suitable for their growth and adapt to the complex environment in the host’s body. The type III secretion system, which is widely present in various animal and plant pathogenic bacteria, is one of several representative secretion systems that are universally coded in the bacteria’s genome and plays an important role.
Escherichia coli type III secretion system 2 (ETT2) is different from the locus of enterocyte effacement (LEE). For example, in terms of the prevalence of different E. coli and the integrity of gene clusters, LEE mostly exists in the form of complete gene clusters in the plasmids or chromosomes of enteropathogenic Escherichia coli (EPEC). While ETT2 exists in EPEC and extraintestinal pathogenic Escherichia coli (ExPEC), there is generally fragment deletion. In terms of function, LEE is combined into a complete needle tip injection device, which can help pathogenic bacteria to secrete virulence effector proteins into host cells, trigger changes in the host tissue structure at the colonization site, cytoskeleton rearrangement, and actin aggregation formation of the pedal structure, which is called attaching and effacing lesions (A/E lesions) (Sheng et al., Citation2017). ETT2 is mostly unable to form a complete secretion device due to its lack of gene sequence and cannot export bacterial virulence effector proteins (Slater et al., Citation2018).
Multiple research reports have shown that ETT2 has a certain correlation with the pathogenicity of E. coli (Zhang et al. Citation2004; Ideses et al. Citation2005; Wang et al. Citation2016; Shulman et al. Citation2018). Our laboratory research has shown that the transcriptional regulator YqeI located at ETT2 can affect the pathogenic properties such as motility, cell adhesion, and bacterial colonization by regulating the structure of fimbriae and flagella on avian pathogenic Escherichia coli (APEC) (Xue et al., Citation2020); ETT2 has a certain effect on the drug sensitivity, motility, extracellular protein secretion, and outer membrane vesicles of uropathogenic Escherichia coli (UPEC) O2 serotype, and this system has an important effect on the resistance of serum (Shulman et al., Citation2018). There are some research reports showing that ETT2 has a regulatory effect on serum sensitivity (serum resistance) (Wang et al., Citation2016; Shulman et al., Citation2018; Xue et al., Citation2020), one of the pathogenic characteristics of E. coli. However, as important avian pathogens, APEC cause serious systemic disease by resistance to poultry serum, although the mechanism has not been identified yet.
In the study of the serum resistance mechanism of ExPEC, it was found that its resistance effect to serum was mainly related to a variety of transcriptional regulatory factors and the extracellular structure components of bacteria. For example, K-capsule (Ma et al., Citation2018), colanic acids (Miajlovic et al., Citation2014), extracellular polysaccharides (ECPS) (Ma et al., Citation2018), and outer membrane protein OmpA (Weiser & Gotschlich, Citation1991) provide a thicker external structure for the serum resistance, or change the structure of the complement-binding site to resist the perforation of serum complement. Also the plasmid-encoded proteins TraT (Pramoonjago et al., Citation1992), Iss (Xu et al., Citation2018), and some transcriptional regulators such as Fur (Huja et al., Citation2014), RcsB (Miajlovic et al., Citation2014), FNR (Huja et al., Citation2014), BasR (Miajlovic et al., Citation2014), and CysB (Miajlovic et al., Citation2014) help bacteria to be more vigorous in the serum environment by regulating the growth, metabolism and the external structure components of the bacteria.
However, how ETT2 contributes to the serum resistance of APEC has not been identified yet. In this study, analysis was performed through mRNA Seq and Tandem mass tag (TMT™) labelling detection to screen the serum resistance pathways that involved APEC-ETT2 in regulation. We found ΔETT2 is more resistant than wild-type (WT) to the killing effect of serum. The analysis also showed that ETT2 has a negative effect in the ABC translator system and quorum sensing system and a positive effect in purine metabolism. These systems may affect the lipopolysaccharide (LPS), biofilm, flagella, and fimbriae.
Materials and methods
Bacterial strains and culture conditions
The Escherichia coli strains utilized for this study were APEC40 and an APEC40 mutant strain with a full ETT2 deletion (ΔETT2) constructed and saved by Anhui Province Key Laboratory of Veterinary Pathobiology and Disease Control (). The strains were inoculated on Luria Bertani (LB) agar medium from the cryotube then cultured in LB to the logarithmic phase. In RNA-Seq and TMT™ detection, the resistance difference between APEC40 and ΔETT2 in chicken serum was tested. The serum used in this study came from customized SPF adult chicken blood and was not vaccinated; Gibco, Grand Island, New York City.
Table 1. Strains and plasmids used in this study.
Survival number of bacteria in serum
The WT and ΔETT2 were aspirated from the LB medium and the overall optical density (OD600) value of the bacterial solution was adjusted to 1.0. The bacterial suspension was inoculated into LB or chicken serum at a ratio of 1:100 and cultured to the growth plateau. Two, 4, 6, 8, 12, and 13 h after inoculating the bacteria, the OD600 value of the bacterial culture solution was measured and 1 ml of the bacterial solution set aside for further analysis. The bacteria were washed three times with PBS, resuspended in 1 ml of PBS, diluted by 1.0 × 10³ times, and 100 μl were spread on LB agar and cultured overnight for 12 h. The serum was heated in a water bath at 65°C for 30 min, shaken and mixed every 10 min to inactivate the serum. Inactivated serum was used as a negative control for serum immune factors. The surviving WT and ΔETT2 bacteria were counted after culture in serum and inactivated serum for 2, 4, 6, 8, 12, and 13 h, and the culture time with the greatest differential survival number was selected for RNA-Seq and proteomics sequencing. This experiment was performed three times independently.
RNA-Seq and proteomics sequencing sample preparation
The WT and ΔETT2 were cultured and washed three times with PBS, and then were inoculated into chicken serum at a ratio of 1:100. After inoculating the bacteria for 6 h, 5 ml of the bacterial solution was washed three times with PBS. After centrifugation at 7000 × g, the supernatant was discarded and the cells were quickly frozen in liquid nitrogen. Prokaryotic chain-specific transcriptome sequencing and proteomics sequencing were completed by Shanghai Meiji Biomedical Technology Co., Ltd., Pudong New Area International Medical Park, Shanghai, China.
Prokaryotic strand-specific transcriptome sequencing
Total RNA samples (200 ng in 40 μl per replicate) were sent to Shanghai Meiji Biomedical Technology Co., Ltd. for quality control, library preparation, and sequencing by Illumina HiSeq. Demultiplexed raw sequencing reads were filtered with Sickle (https://github.com/najoshi/sickle) and SeqPrep (https://github.com/jstjohn/SeqPrep) to discard low-quality fragments (q = 20, p = 90; the reads with less than 90% base calls with quality above Qphred score ≥ 20 were removed). Next, after the raw data (reads) underwent quality control, it was compared to the reference genome E. coli O157:H7 str. Sakai (BA000007.3) to obtain mapped data (reads) for subsequent analysis. The software Bowtie2 (https://sourceforge.net/projects/bowtie-bio/files/bowtie2/2.3.5.1) was used to align and annotate the reads on the genome of E. coli O157:H7 str. Sakai. Comparative transcriptomic analysis of gene expression profiles was performed using the software RSEM (http://deweylab.biostat.wisc.edu/rsem/) and the quantitative index by DESeq (http://bioconductor.org/packages/stats/bioc/DESeq/). RSEM establishes a maximum likelihood abundance estimation model based on the maximum expectation algorithm and considers paired-end reads, read length, fragment length distribution, quality value, etc. to distinguish which transcripts are different subtypes of the same gene. A minimal 1.5-fold change threshold was applied to restrict downstream interpretations. Raw sequences were deposited to the Sequence Read Archive of the National Center for Biotechnology Information (http://www.ncbi.nlm.nih.gov/Traces/sra) under the BioProject PRJNA757182.
Proteome sequencing
Protein lysis solution (8 M urea + 1% SDS, containing protease inhibitors) was added to all samples in the frozen state. The samples were shaken for 40 s, three times, using a high-throughput tissue grinder and subsequently lysed on ice for 30 min while being vortexed and mixed for 5–10 s every 5 min. The sample was centrifuged at 16,000 × g for 30 min at 4°C. The supernatant was collected, BCA protein was used for quantification and the sample was separated by sodium dodecyl sulphate polyacrylamide gel electrophoresis (SDS-PAGE). Triethylammonium bicarbonate buffer (TEAB) was added to 100 μg of the protein sample until the final concentration of TEAB was 100 mM. After that, tris(2-carboxyethyl)phosphine (TCEP) was added until the final concentration of TCEP was 10 mM. The solution was then allowed to react at 37°C for 60 min. Iodoacetamide (IAM) was added until the final concentration of IAM was 40 mM then the solution was allowed to react for 40 min in the dark at room temperature. After reaction, pre-cooled acetone was added to each tube of sample (acetone: sample v/v = 6:1) and precipitated at −20°C for 4 h. The solutions were centrifuged at 10,000 × g for 20 min and the precipitate was collected. The sample was fully dissolved with 100 µl of 100 mM TEAB. According to enzyme: protein ratio (m/m) = 1:50, trypsin was added for digestion overnight at 37°C. The sample was centrifuged and acetonitrile was added. The sample was vortexed and centrifuged again, a tube of TMT™ reagent was added per 100 μg peptide, and the resulting solution was incubated at room temperature for 2 h. After 2 h, hydroxylamine was added and incubated at room temperature for 30 min. Each group of intermediate labelled products was mixed in a tube and drained with a vacuum concentrator. The peptide samples were reconstituted with ultra-high performance liquid chromatography (UPLC) loading buffer (2% acetonitrile [ammonia adjusted to pH 10]) and high pH liquid-phase separation was performed on a reversed-phase C18 column (see for parameters, for UPLC gradient). In total, 20 fractions were collected according to the peak type and time and combined into 10 fractions. After concentration by vacuum centrifugation, they were dissolved in mass spectrometry loading buffer (2% acetonitrile and 0.1% formic acid) for second-dimensional analysis.
Table 2. UPLC parameters.
Table 3. UPLC gradient.
Thermo Xcalibur 4.0 (Thermo, USA) software was used for liquid-phase tandem mass spectrometry for data collection. The reversed-phase column was a C18 column (75 μm×25 cm, Thermo); the chromatographic instrument and mass spectrometer were EASY-nLC 1200 (Thermo) and Q_Exactive HF-X (Thermo fisher, MA, USA). The chromatographic separation time was 120 min, the phase A was 2% acetonitrile and 0.1% formic acid, the phase B was 80% acetonitrile and 0.1% formic acid, and the flow rate was 300 nl/min (EASY-nLC liquid phase gradient is shown in ). The MS scan range was 350–1500 m/z. Sample signals were collected through data-dependent acquisition (DDA), and the 20 strongest precursor ions were selected for secondary fragmentation. The resolution of the primary mass spectrum is 60,000, the automatic gain control (AGC) target was 3e6, and the maximum injection time was 20 ms. The fragmentation method used was higher energy collision induced dissociation (HCD); the resolution of secondary mass spectrometry was 45,000, the AGC target was 2e5, and the maximum injection time was 96 ms. The fixed first mass was 100 m/z, the minimum AGC target was 8e3, the intensity threshold was 8.3e4, and the dynamic exclusion time was 30 s. Proteomic raw data have been deposited under the accession number IPX0003420000 at iProX (iProX – integrated Proteome resources).
Table 4. ETT2 genes have an interactive relation with the DEPS.
Database searching
The software used for protein database checking was ProteomeDiscoverer™ Software 2.4 (Thermo fisher, MA, USA). When searching the database, the raw file was submitted to the iProX (https://www.iprox.cn/, China), the O157:H7 database (GenBank: BA000007.3) was selected, and a database search was performed.
LPS detection of WT and ΔETT2
The LPS of WT and ΔETT2 were extracted according to the instructions of the LPS extraction kit (iNtRON, Zhongwon-gu, Seongnam-si, Gyeonggi-do, Korea). The WT and ΔETT2 were aspirated from the LB medium and cultured in a volume of 2 ml at OD600 of 1.0. Bacteria were centrifuged at 11,000 × g at room temperature to harvest 2–5 ml of bacteria, then 1 ml of lysis buffer was added and vortexed vigorously. After adding 200 ml of chloroform, samples were vortexed vigorously for 10–20s and incubated at room temperature for 5 min, then centrifuged at 11,000 × g for 10 min at 4°C. The supernatant (400 ml) was transferred to a new 1.5 ml tube, then 800 ml of purification buffer was added and mixed well. Samples were incubated for 10 min at −20°C. After centrifuging the solution at 11,000 × g for 15 min at 4°C, remove the upper layer was removed to obtain the LPS pellet. One ml of 70% EtOH was added and the LPS pellet was washed by inverting the tube 2–3 times. The mixtures were centrifuged for 3 min at 11,000 × g at 4°C. The upper layer was discarded and the remaining LPS pellet was dried. Then 30–50 ml of 10 mM Tris-HCl buffer (pH 8.0) was added to the LPS pellet and mixed by vortexing or pipetting. The LPS was dissolved completely by boiling it for 2 min. The LPS components were separated by SDS-PAGE, and silver staining was used for visual detection.
Biofilm detection of WT and ΔETT2
The WT and ΔETT2 were cultured in LB medium to OD600 = 1.0. The bacteria were collected by centrifugation at 3500 × g for 5 min at 4°C. The bacteria were resuspended after washing twice with LB, the OD600 was adjusted to 3.0 and then the LB medium that contained the bacteria was diluted 1:100 in fresh medium. Two hundred microlitres of dilution of each strain were transferred to three wells of 96-well plates (representative of three technical replicates). The three strains were incubated statically at 37°C for 15 h. Subsequently, the medium was withdrawn, and the wells were rinsed with water to remove any planktonic bacteria. Next, biofilm-forming cells were fixed with 100% methanol for 5 min. After removing the methanol, 200 μl 0.1% crystal violet (CV, Sangon, Shanghai, China) solution was added to each well and incubated for 15 min at room temperature. The solution was then removed, and the wells were washed with water to remove any unbound CV before the 96-well plates was air dried without a lid for 30 min. Finally, the CV remaining in the wells was dissolved in 33% glacial acetic acid (Sangon), 150 µl was added to the wells of 96-well microtitre plates and the plate was read in single wavelength mode at 620 nm using a MicroELISA automatic reader (Thermo Scientific, Pittsburgh, PA, USA). This experiment was repeated independently three times, stated previously (Li et al., Citation2020).
Statistical analysis
Each experiment was repeated in biological triplicate (n = 3). For each replicate, three samples were analysed. All data were presented as mean ± standard deviation. Statistical analysis was done using the software Prism 5 (GraphPad Software, Inc., San Diego, CA, USA). A difference was considered to be statistically significant when the confidence interval was lower than 5% (***P ≤ 0.001; **P ≤ 0.01; *P ≤ 0.05; Student’s t-test).
Results
Survival number of bacteria in serum culture
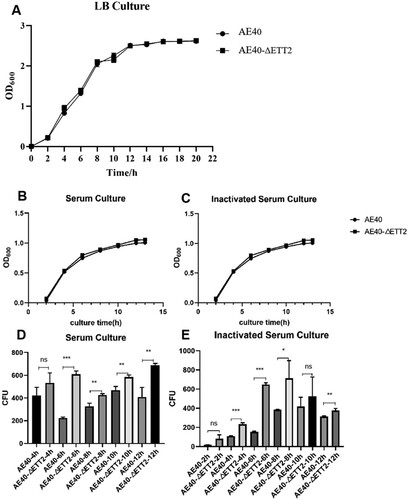
When WT and ΔETT2 were cultured in LB, there was no significant difference in growth between the two strains ((A)). In addition, when cultured in serum ((B)) and inactivated serum ((C)), there was no significant difference in the overall OD600 values of the two strains. However, before entering the growth plateau, the OD600 values of WT and ΔETT2 showed no difference after 6 h of culture. When the surviving bacteria of WT and ΔETT2 after different culture periods were counted, the results showed that the number of viable bacteria of ΔETT2 cultured in serum ((D)) and inactivated serum ((E)) at 6 and 12 h were more than that of APEC40.
Figure 1. Growth curve of WT and ΔETT2 in (A) LB, (B) serum, (C) inactivated serum. Surviving bacteria number in (D) serum and (E) inactivated serum. Abbreviations – AE40: the wild-type APEC40 (WT); AE40-ΔETT2: ETT2 deletion mutant in APEC40 (ΔETT2).
Global gene and protein expression profiles of APEC cultured in serum
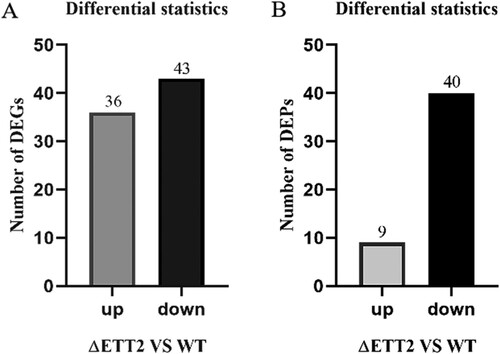
The impacts of serum culture on the transcriptomic and proteomic profiles of WT and ΔETT2 was determined for better understanding the serum resistance mechanisms relevant to ETT2 on APEC. Prokaryotic strand-specific transcriptome sequencing and proteomic methods were performed to investigate the global cellular changes of ΔETT2 versus WT (both cultured in serum for 6 h). In our analysis, the WT strain was set as the control group, and ΔETT2 strain was set as the experimental group. Prior to this, we have analysed the transcriptomic profiles of ΔETT2 versus WT (cultured in LB). The result was different from this study, which proved that non-serum culture factors did not interfere with this study (data not shown, manuscript in review). In total, culture in serum significantly changed the transcription of 79 genes of ΔETT2 versus WT, corresponding to 1.5% of the annotated 5252 genes. Among these genes, 36 (0.68% of the annotated genes) were up-regulated and 43 (0.82% of the annotated genes) were down-regulated ((A)). Proteins in ΔETT2 versus WT were assessed among all the 2854 proteins that were detected; nine (0.3% of the annotated genes) were up-regulated and 40 (1.4% of the annotated genes) were down-regulated. There were 49 differentially expressed proteins corresponding to 1.7% of the annotated proteins ((B)).
Figure 2. Differentially expressed genes (A) and differentially expressed proteins (B).
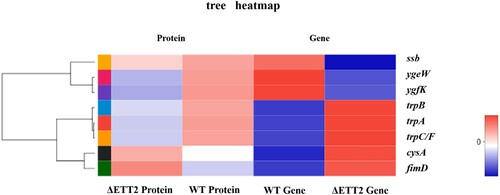
To understand functional associations among the differentially expressed genes (DEGS) and differentially expressed proteins (DEPS) regulated by ETT2, we performed analysis of sample differential mRNA and differential protein. The transcriptome and proteome were analysed through the free online platform of Majorbio Cloud Platform (www.majorbio.com), and eight genes or proteins were cross-linked, the coded genes being, trpA, trpB, trpC, cysA, ygeW, ygfK, fimD, and ssb (). We also found that 12 genes (yqeI, yqeJ, ygeH, ygeK, eprK, EprH, eprS, epaR1, escR, epaO, ygeP, and YgeQ) located at ETT2 have an interactive relation with the DEGS or DEPS (). We observed that proteins TrpA, TrpB, TrpC, YgeW, YgfK, and gene ssb interact with the 12 genes in ETT2 mentioned above.
Figure 3. Cross-linked heatmap of genes and proteins in differentially expressed genes (DEGS) and differentially expressed proteins (DEPS). Red represents up-regulation, blue represents down-regulation, and the darker the colour, the more up- or down-regulation. ssb, ygeW, ygeK have the same down-regulation in genes and proteins. cysA and fimD have the same up-regulation in genes and proteins. trpB, trpA and trpC/F are all up-regulated in genes and down-regulated in proteins.
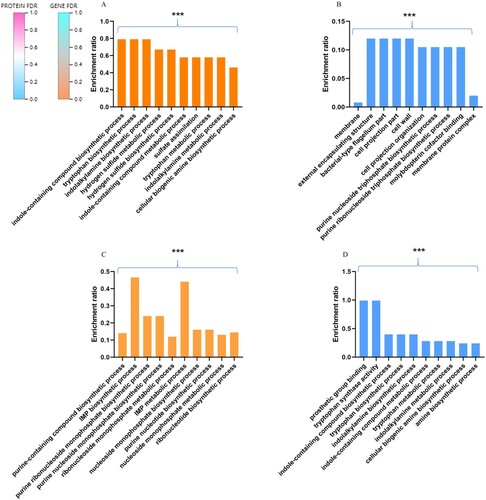
The genes and proteins annotated by Gene Ontology (GO) classification in biological process showed a difference in some function factors. There were high percentages at “cellular process”, “metabolic process”, “cellular anatomical entity”, “catalytic activity” and “binding” in GO classification (). For up-regulated DEGS, corrected P value under 0.5, the top 10 enriched GO Term is displayed. The “tryptophan biosynthetic process”, “indole-containing compound biosynthetic process”, and “Sulphide biosynthesis process” have significant enrichment ((A)). For up-regulated DEPS, corrected P value under 0.5, the top 10 enriched GO Term is displayed. The “external encapsulating structure”, “bacterial-type flagellum part”, and “purine nucleoside triphosphate biosynthetic process” have significant enrichment ((B)). For down-regulated DEGS, corrected P value under 0.5, the top 10 enriched GO Term is displayed. The “IMP biosynthetic and metabolic process”, and “purine nucleoside monophosphate biosynthetic process” have significant enrichment ((C)). For down-regulated DEPS, corrected P value under 0.5, the top 10 enriched GO Term is displayed. The “tryptophan synthase activity”, and “indole-containing compound biosynthetic process” have significant enrichment ((D)).
Figure 4. Total GO Classification Statistics. Note: the bars in the figure represent the secondary classification of a GO. The higher the bar, the more proteins or genes in this secondary classification; the abscissa represents the secondary classification terms of GO, and the ordinate (left) represents the secondary classification of GO. The percentage of proteins or genes in the second-level classification to the total number of proteins or genes in the second-level classification. The ordinate (right) represents the number of proteins or genes annotated to the second-level classification; the three colour blocks indicate the three branches of GO type.
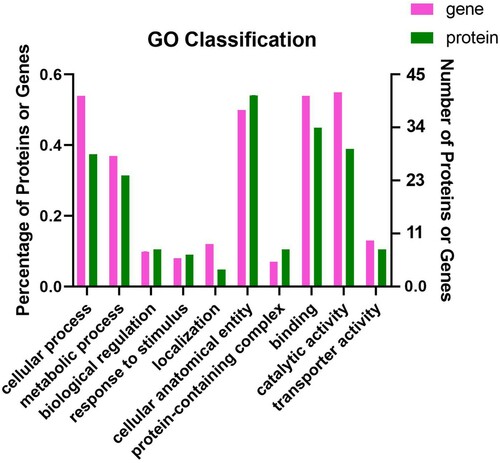
Figure 5. The DEGS and DEPS from ΔETT2 versus WT. (A) Up-regulated DEGS GO enrichment analysis. (B) Up-regulated DEPS GO enrichment analysis. (C) Down-regulated DEGS GO enrichment analysis. (D) Down-regulated DEPS GO enrichment analysis. The abscissa represents the GO term, and the ordinate represents the enrichment rate. The colour gradient of the column indicates the significance of enrichment, where P or FDR < 0.001 is marked as ***, P or FDR < 0.01 is marked as **, and P or FDR < 0.05 is marked as *.
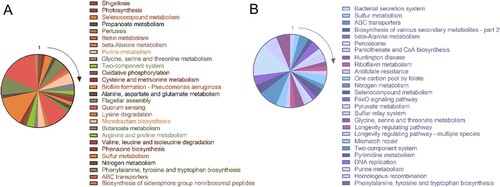
The KEGG pathways most affected by ETT2 were the up-regulated ABC transporter system and quorum sensing system and the down-regulated purine metabolism ().
Figure 6. KEGG enrichment analysis for (A) up-regulated pathway and (B) down-regulated pathway in ΔETT2. With the 1 mark as the starting point, follow the clockwise downward sequence for each KEGG pathway described in the figures.
ΔETT2 had more LPS components than WT
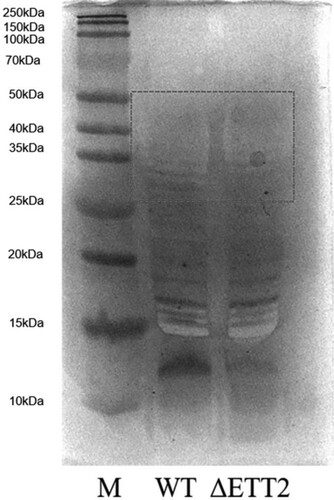
LPS is composed of O antigen, core polysaccharide, and lipid A. It is one of the main components of the APEC cell wall. The LPS components extracted from WT and ΔETT2 were separated by SDS-PAGE electrophoresis then the changes in LPS components of the two strains were detected by silver staining. The composition of LPS on the bacterial surface changed, and the protein band of ΔETT2 between 35-50 kDa was thicker and more intense than that of the WT ().
Figure 7. Extraction and detection of LPS. ΔETT2 has more than one component than WT at 35–50 kDa.
ΔETT2 formed more biofilm than WT
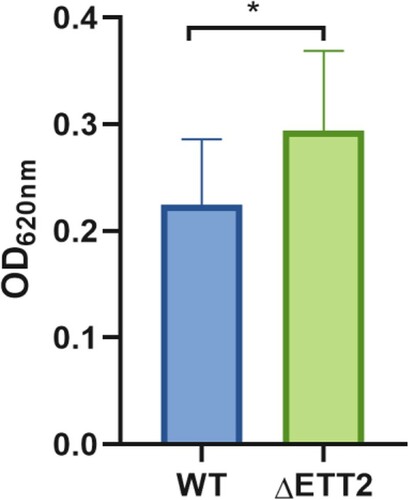
In order to evaluate how the ETT2 affects biofilm development, we compared WT APEC40 and ΔETT2 by CV staining to quantify biofilm formation. The results showed that ΔETT2 formed more biofilm than WT ().
Figure 8. Biofilm detection. Error bars represent the errors in three replicates of three samples. The t-test method was used to calculate the significance of the difference in the biofilm between the two groups of samples, where P < 0.001 is marked as ***, P < 0.01 is marked as **, and P < 0.05 is marked as *.
Discussion
Based on these results, serum treatment affects the transcription and translation of genes related to various functional categories and metabolic pathways.
When WT and ΔETT2 were cultured in LB or serum, there was no significant difference in the overall OD600 values of the two strains, indicating that there is no difference in the growth rates between the two strains. However, in this study, we found that ΔETT2 survives better than WT in serum after culture for 6–12 h. The growth curve reflects a certain situation of bacteria in the process of proliferation. Bacteria have the greatest growth activity during the exponential growth phase when their physiological, biochemical, and metabolic functions are the strongest, and they can best reflect the life status of the bacteria (Xu et al., Citation2019). In this study, there is a certain difference between the two strains in the serum culture after 6–12 h; we selected the time 6 h for further transcriptome sequencing and proteomic sequencing because it was the time at which the most significant difference was seen, and it was in the exponential growth phase of the bacteria, so it could better reflect the sensitivity of the two strains to the killing effect of the serum. The main active component in the serum that kills bacteria is complement. Generally, the complement attacks the bacteria on the surface to kill them (Berends et al., Citation2014). In addition, the lack of sufficient oxygen and nutrients in serum and inactivated serum may cause bacterial death (Huja et al., Citation2014). We suspect that the loss of ETT2 may cause changes in the metabolic pathways of ΔETT2 in serum and reduced resistance to complement, so the number of bacteria surviving is less than WT. There was no significant difference in the growth curve of the two bacteria in the serum, but the difference in the number of surviving bacteria was significant. The reason may be that the OD600 of the bacteria can only measure the change in the number of bacteria and the number of viable bacteria cannot be judged.
The cross-linked factors TrpA, TrpB, and TrpC had different up-regulated or down-regulated trends as genes or proteins, so they may have lower convincing power. They are involved in contributing to phenylalanine, tyrosine, and tryptophan biosynthesis and glycine, serine, and threonine metabolism. CysA was a sulphate/thiosulphate transporter subunit, up-regulated in gene and protein level, on which ETT2 may have some unknown effect. CysA had been proved to be involved in the survival of E. coli in the anaerobic environment (Matijasević et al., Citation1992; Sirko et al., Citation1995). In this study, the serum formed a natural host nutritional immune environment, where bacteria needed to overcome the lack of oxygen and various nutrients (Huja et al., Citation2014), and CysA was up-regulated in ΔETT2 versus WT, increased the survival ability of ΔETT2, which may explain why ΔETT2 survived more than WT in serum and inactivated serum. YgeW (carbamoyl transferase), YgfK (Fe-S subunit oxidoreductase subunit), and ssb (initiating replication protein) were down-regulated in gene and protein level, on which ETT2 may have some unknown effect. YgeW is involved in the purine metabolism in the anaerobic environment, for purine was utilized as the nitrogen source (Li et al., Citation2011). Compared with WT, the down-regulation of YgeW in ΔETT2 may be related to purine metabolism that we will discuss below. Fe-S subunit oxidoreductase subunit (YgfK related protein) participates in the transmission of the aerobic respiratory chain (Sinha et al., Citation2012), which may be down-regulated for surviving under serum anaerobic conditions. ssb is involved in the initial replication of bacteria (Antony & Lohman, Citation2019), and the down-regulation of ssb in ΔETT2 may reduce bacterial replication, repair and recombination for reducing the consumption of oxygen and various nutrients, thereby keeping bacteria alive. However, FimD was up-regulated at both gene and protein level, which may have a positive effect on the serum resistance of ΔETT2 (Cheng et al., Citation2019), which we will discuss below.
YqeI, yqeJ, ygeH, ygeK, eprK, EprH, eprS, epaR1, escR, epaO, ygeP, and YgeQ locus at ETT2 have an interactive relation with proteins TrpA, TrpB, TrpC, YgeW, and YgfK and gene ssb. These interactive relationships can be verified in future studies.
We observed that ΔETT2 has an up-regulation in ABC transporter pathways, which includes glnH, lsrB, lsrD, lsrA, cysA, cysP, and cysU, and this pathway connects with multiple compound efflux. It was proved that ABC transporter was required in synthesis of O antigen, which is required for the synthesis of O antigen-containing LPS glycoforms (Huszczynski et al., Citation2020). It is known that LPS contributes significantly to bacteria resistance to the killing effect of serum (Porat et al., Citation1992; Burns & Hull, Citation1998; Ma et al., Citation2018). To verify if the LPS components increased in ΔETT2, we analysed the concentration of LPS. The results indicated that ΔETT2 had more LPS than WT. Thus, we assumed that the up-regulation of ABC transporter pathway genes contributed to the serum resistance of ΔETT2.
The quorum sensing system was up-regulated in the ETT2 deletion strain, which took our attention. The quorum-sensing system is known for being indispensable for forming biofilm in E. coli or other bacteria (Kim et al., Citation2017; Whiteley et al., Citation2019). Bacteria within biofilm are relatively resistant to killing by host immune factors. To verify if the biofilm increased in ΔETT2, we detected the biofilm of two strains, and the results showed that ΔETT2 formed more biofilm than WT. Thus, we surmised that ETT2 may have a negative effect on the quorum sensing genes, and the loss of the ETT2 up-regulated the quorum sensing genes, therefore promoting the growth and thickening of biofilms and leading to increased resistance of bacteria to serum.
Fimbriae factors FimA and FimD and flagella factor FliF had increased expression in ΔETT2. FimA was defined as the major type 1 subunit fimbrin (pilin), and FimD (other names were FimD, FimC, MrkC, HtrE, and CssD) was defined as the outer membrane usher protein. The fimbriae are an important virulence factor for mediating adhesion to both biotic and abiotic surfaces and facilitating biofilm formation (Azam et al., Citation2020; Sheng et al., Citation2020). FliF was defined as the flagellar M-ring protein, and the flagella usually connected with the formation of the biofilm (Pratt & Kolter, Citation1998; Liu et al., Citation2019). Thus, we surmised that ETT2 may have a negative effect on the expression of FimA, FimD, and FliF, which may affect the biofilm formation and contribute to the serum resistance.
Interestingly, we observed that ΔETT2 show a down-regulation in purine metabolism, which includes purK, purL, purC, purT, purH, purD, and purM. These seven genes contribute to the biosynthesis of inosinic acid (IMP), which participates in adenosine triphosphate (ATP) biosynthesis. ATP has been shown to contribute to serum resistance in E. coli by converting into cyclic-AMP (cAMP) then forming cAMP-CRP complex, which negatively regulates HtrE (Cheng et al. Citation2019). It is mentioned above that HtrE had an increased expression in ΔETT2. HtrE can bind to complement C3b. According to the study by Cheng et al., (Citation2019), ΔETT2 should be more sensitive to killing by serum factors compared with the WT. However, the results of this experiment are contrary to this, which may be caused by not using the exogenous glycine induction pathway (Cheng et al., Citation2019), and the greater effect on biofilm and LPS components.
Conclusions
In this study, the global response of ΔETT2 to serum culture for 6 h, was investigated using transcriptomic and proteomic analyses. It was found that ΔETT2 is more resistant to the killing effect of serum than APEC40, and the ETT2 has a negative effect on the ABC translator system and quorum sensing system and a positive effect in purine metabolism. ETT2 may affect the LPS, biofilm, flagella, and fimbriae which may in turn affect the serum resistance. These results could lead to effective strategies for managing the infection with APEC.
Ethical statement
The study was performed in accordance with the Chinese Laboratory Animal Administration Act of 1988. Before the experiments, the research protocol was reviewed and approved by the Research Ethics Committee of Anhui Agricultural University.
Disclosure statement
No potential conflict of interest was reported by the author(s).
Additional information
Funding
References
- Antony, E. & Lohman, T.M. (2019). Dynamics of E. coli single stranded DNA binding (SSB) protein-DNA complexes. Seminars in Cell & Developmental Biology, 86, 102–111.
- Azam, M.W., Zuberi, A. & Khan, A.U. (2020). Bola gene involved in curli amyloids and fimbriae production in: exploring pathways to inhibit biofilm and amyloid formation. Journal of Biological Research, 27, 10.
- Berends, E.T.M., Kuipers, A., Ravesloot, M.M., Urbanus, R.T. & Rooijakkers, S.H.M. (2014). Bacteria under stress by complement and coagulation. FEMS Microbiology Reviews, 38, 1146–1171.
- Burns, S.M. & Hull, S.I. (1998). Comparison of loss of serum resistance by defined lipopolysaccharide mutants and an acapsular mutant of uropathogenic Escherichia coli O75:K5. Infection and Immunity, 66, 4244–4253.
- Cheng, Z.-X., Guo, C., Chen, Z.-G., Yang, T.-C., Zhang, J.-Y., Wang, J., Zhu, J.-X., Li, D., Zhang, T.-T., Li, H., Peng, B., Peng, X.-X. (2019). Glycine, serine and threonine metabolism confounds efficacy of complement-mediated killing. Nature Communications, 10, 3325.
- Huja, S., Oren, Y., Biran, D., Meyer, S., Dobrindt, U., Bernhard, J., Becher, D., Hecker, M., Sorek, R., Ron, E. Z. (2014). Fur is the master regulator of the extraintestinal pathogenic Escherichia coli response to serum. mBio, e01460–14, 5.
- Huszczynski, S.M., Hao, Y., Lam, J.S. & Khursigara, C.M. (2020). Identification of the Pseudomonas aeruginosa O17 and O15 O-specific antigen biosynthesis loci reveals an ABC transporter-dependent synthesis pathway and mechanisms of genetic diversity. Journal of Bacteriology, 202(19), e00347–20.
- Ideses, D., Gophna, U., Paitan, Y., Chaudhuri, R.R., Pallen, M.J. & Ron, E.Z. (2005). A degenerate type III secretion system from septicemic Escherichia coli contributes to pathogenesis. Journal of Bacteriology, 187, 8164–8171.
- Kim, M.K., Zhao, A., Wang, A., Brown, Z.Z., Muir, T.W., Stone, H.A., Bassler, Bonnie L. (2017). Surface-attached molecules control Staphylococcus aureus quorum sensing and biofilm development. Nature Microbiology, 2, 17080.
- Li, Q., Yin, L., Xue, M., Wang, Z., Song, X., Shao, Y., Liu, H., Tu, J., Qi, K. (2020). The transcriptional regulator PhoP mediates the molecular mechanism on APEC biofilm formation and pathogenicity. Avian Pathology, 49, 211–220.
- Li, Y., Jin, Z., Yu, X., Allewell, N.M., Tuchman, M. & Shi, D. (2011). The ygeW encoded protein from Escherichia coli is a knotted ancestral catabolic transcarbamylase. Proteins, 79, 2327–2334.
- Liu, X., Zhuo, S., Jing, X., Yuan, Y., Rensing, C. & Zhou, S. (2019). Flagella act as geobacter biofilm scaffolds to stabilize biofilm and facilitate extracellular electron transfer. Biosensors & Bioelectronics, 146, 111748.
- Ma, J., An, C., Jiang, F., Yao, H., Logue, C., Nolan, L.K., Li, G. (2018). Extraintestinal pathogenic Escherichia coli increase extracytoplasmic polysaccharide biosynthesis for serum resistance in response to bloodstream signals. Molecular Microbiology, 110, 689–706.
- Matijasević, Z., Hajec, L.I. & Volkert, M.R. (1992). Anaerobic induction of the alkylation-inducible Escherichia coli aidB gene involves genes of the cysteine biosynthetic pathway. Journal of Bacteriology, 174, 2043–2046.
- Miajlovic, H., Cooke, N.M., Moran, G.P., Rogers, T.R.F. & Smith, S.G. (2014). Response of extraintestinal pathogenic Escherichia coli to human serum reveals a protective role for Rcs-regulated exopolysaccharide colanic acid. Infection and Immunity, 82, 298–305.
- Mukherjee, S. & Bassler, B.L. (2019). Bacterial quorum sensing in complex and dynamically changing environments. Nature Reviews. Microbiology, 17, 371–382.
- Porat, R., Mosseri, R., Kaplan, E., Johns, M.A. & Shibolet, S. (1992). Distribution of polysaccharide side chains of lipopolysaccharide determine resistance of Escherichia coli to the bactericidal activity of serum. The Journal of Infectious Diseases, 165, 953–956.
- Pramoonjago, P., Kaneko, M., Kinoshita, T., Ohtsubo, E., Takeda, J., Hong, K.S., Inagi, R., Inoue, K. (1992). Role of TraT protein, an anticomplementary protein produced in Escherichia coli by R100 factor, in serum resistance. Journal of Immunology, 148, 827–836.
- Pratt, L.A. & Kolter, R. (1998). Genetic analysis of Escherichia coli biofilm formation: roles of flagella, motility, chemotaxis and type I pili. Molecular Microbiology, 30, 285–293.
- Sheng, H., Xue, Y., Zhao, W., Hovde, C.J. & Minnich, S.A. (2020). O157:H7 curli fimbriae promotes biofilm formation, epithelial cell invasion, and persistence in cattle. Microorganisms, 8(4), 580.
- Sheng, X., You, Q., Zhu, H., Chang, Z., Li, Q., Wang, H., Wang, C., Wang, H., Hui, L., Du, C., Xie, X., Zeng, R., Lin, A., Shi, D., Ruan, K., Yan, J., Gao, G. F., Shao, F., Hu, R. (2017). Bacterial effector NleL promotes enterohemorrhagic E. coli-induced attaching and effacing lesions by ubiquitylating and inactivating JNK. PLoS Pathogens, 13, e1006534.
- Shulman, A., Yair, Y., Biran, D., Sura, T., Otto, A., Gophna, U., Becher, D., Hecker, M., Ron, E. Z. (2018). The Escherichia coli type III secretion system 2 has a global effect on cell surface. mBio, 9(4), e01070–18.
- Sinha, P.K., Nakamaru-Ogiso, E., Torres-Bacete, J., Sato, M., Castro-Guerrero, N., Ohnishi, T., Matsuno-Yagi, A., Yagi, T. (2012). Electron transfer in subunit NuoI (TYKY) of Escherichia coli NADH:quinone oxidoreductase (NDH-1). The Journal of Biological Chemistry, 287, 17363–17373.
- Sirko, A., Zatyka, M., Sadowy, E. & Hulanicka, D. (1995). Sulfate and thiosulfate transport in Escherichia coli K-12: evidence for a functional overlapping of sulfate- and thiosulfate-binding proteins. Journal of Bacteriology, 177, 4134–4136.
- Slater, S.L., Sågfors, A.M., Pollard, D.J., Ruano-Gallego, D. & Frankel, G. (2018). The type III secretion system of pathogenic Escherichia coli. Current Topics in Microbiology and Immunology, 416, 51–72.
- Wang, S., Liu, X., Xu, X., Yang, D., Wang, D., Han, X., Shi, Y., Tian, M., Ding, C., Peng, D., Yu, S. (2016). Escherichia coli type III secretion system 2 ATPase EivC Is involved in the motility and virulence of avian pathogenic Escherichia coli. Frontiers in Microbiology, 7, 1387.
- Weiser, J.N. & Gotschlich, E.C. (1991). Outer membrane protein A (OmpA) contributes to serum resistance and pathogenicity of Escherichia coli K-1. Infection and Immunity, 59, 2252–2258.
- Whiteley, M., Diggle, S.P. & Greenberg, E.P. (2017). Progress in and promise of bacterial quorum sensing research. Nature, 551, 313–320.
- Xu, H., Liu, C., Li, M., Wang, C., Liu, G., Wang, H., Ma, J., Li, L., Chen, M., Cheng, M., Yao, X., Lin, Y., Zhao, S., Wang, Y., Wang, M. (2019). In vitro antibacterial experiment of fuzheng jiedu huayu decoction against multidrug-resistant Pseudomonas aeruginosa. Frontiers in Pharmacology, 10, 1682.
- Xu, W.-Y., Li, Y.-J. & Fan, C. (2018). Different loci and mRNA copy number of the increased serum survival gene of Escherichia coli. Canadian Journal of Microbiology, 64, 147–154.
- Xue, M., Xiao, Y., Fu, D., Raheem, M.A., Shao, Y., Song, X., Tu, J., Xue, T., Qi, K. (2020). Transcriptional regulator YqeI, locating at ETT2 locus, affects the pathogenicity of avian pathogenic Escherichia coli. Animals: An Open Access Journal from MDPI, 10(9), 1658.
- Yin, L., Li, Q., Wang, Z., Tu, J., Shao, Y., Song, X., Pan, X., Qi, K. (2021). The role of Escherichia coli type III secretion system 2 chaperone protein ygeG in pathogenesis of avian pathogenic Escherichia coli. Research in Veterinary Science, 140, 203–211.
- Zhang, L., Chaudhuri, R.R., Constantinidou, C., Hobman, J.L., Patel, M.D., Jones, A.C., Sarti, D., Roe, A. J., Vlisidou, I., Shaw, R. K., Falciani, F., Stevens, M. P., Gally, D. L. Knutton, S., Frankel, G., Penn, C. W., Pallen, M. J. (2004). Regulators encoded in the Escherichia coli type III secretion system 2 gene cluster influence expression of genes within the locus for enterocyte effacement in enterohemorrhagic E. coli O157:H7. Infection and Immunity, 72, 7282–7293.