
 ?Mathematical formulae have been encoded as MathML and are displayed in this HTML version using MathJax in order to improve their display. Uncheck the box to turn MathJax off. This feature requires Javascript. Click on a formula to zoom.
Abstract
This work introduces a low-cost open-source electrocardiography (ECG) simulator comprising both MATLAB software for signal generation and a dedicated circuit board for signal output via a commercial sound card. Synthetic, rate-dependent ECG simulation is based on third-order polynomials that are calculated in sections for the main waves and spikes, respectively. Besides the heart rate, the output profile is fully adjustable with respect to Einthoven lead signals I–III, the amplitudes of the individual ECG waves and spikes, as well as the constitution and intensity of common distortions. The underlying coefficients for the synthetic ECG profile are obtained experimentally by analysing recordings of 22 healthy individuals with heart rates in the range of 40–180 bpm. Eight of these recordings are selected to determine the coefficients for the polynomials (training set) while the remaining 14 serve as test set to evaluate their applicability and accuracy. Thereby, a mean correlation of 98.57% is found which is superior in comparison with a widely accepted rate-dependent ECG profile that is generated from square root and linear terms (correlation score: 91.46%). Although other use-cases are feasible, the focus of this work is the development of an ECG simulator for academic research and university education. Both the MATLAB source code and the circuit layout files are available in the online supplement stimulating further work on this topic.
Introduction
According to the World Health Organisation, cardiovascular diseases are taking the lives of around 17.7 million people every year accounting for 31% of all deaths worldwide. With respect to the human heart, this medical condition involves narrowed or blocked coronary arteries that may aggravate towards cardiac arrhythmias, chest pain, heart attacks or cardiac tissue damage in general [Citation1]. Reducing the time between the onset of a critical condition, where cardiac cells are cut off from circulation, and the start of therapeutic measures is decisive for the harm that is inflicted. Adequate treatment within the “golden hour” has the potential to fully reverse medical symptoms by resupplying cardiac cells before cell death [Citation2]. Electrocardiography (ECG) investigations allow for a quick assessment of the cardiac condition and are therefore a standard tool for such diagnoses. Thereby, ECG systems acquire electric signals from the human heart through body electrodes. Subsequent signal processing includes signal amplification, filtering, digitalisation and classification. Being an electronic system, regular inspections and maintenance with special test equipment is indispensable to guarantee patients’ safety [Citation3]. This work introduces such a tool that is capable of generating required test signals with increased functionality and flexibility compared to existing test kits. A key benefit is that this simulator allows for user-interaction via a MATLAB interface (MathWorks, MATLAB R2017a) while, at the same time, signals are accessible through a hardware output. Usually, stand-alone hardware test kits are deployed for the purpose of system testing that contain a rigid set of ECG patterns and noise artefacts [Citation4,Citation5]. Beside such systems, software simulators are available that are designed to support the education of future medical professionals. Therefore, a comprehensive database of both physiological and pathological ECG signals is embedded in such systems while signals are displayed on-screen exclusively without physical signal output [Citation6]. The system in this work crosses traditional boundaries by combining advantages of both existing versions: On one hand, a facile selection and flexible adjustment of the ECG signal constitution is enabled via a graphical user interface (GUI) using MATLAB software. On the other hand, the signal output is realised via a sound card with high signal resolution. Thus, beside system testing, this tool is very beneficial in a university setup for ECG hardware development as it enables the output of customised signals for testing and performance evaluation of signal classification algorithms. As the majority of hardware components required is already inbuilt in an off-the-shelf computer, the effort of replicating this simulator is rather low. To facilitate this process further, the MATLAB source code and the custom-made circuit layout are provided in the online supplement.
ECG simulators usually comprise options to output synthetic signals and measured signals from a database. For the former, the structure of healthy, rate-dependent ECGs has been studied and profiled with square root and linear terms [Citation4,Citation7]. Although this model is widely accepted, synthesising ECGs at low or high heart rates (HRs) reveals unphysiological signal morphologies. Therefore, the usable spectrum is limited to a narrow section of cardiac frequencies (the discussion and contains some examples). Consequently, this work studies cardiac ECG signals over a greater spectrum of HRs and introduces a strategy to profile its waves and spikes through mathematical functions with increased accuracy.
Methods
Data sources
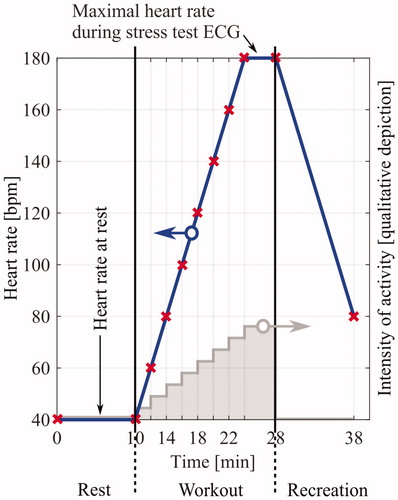
Healthy ECG segments comprise waves and spikes as introduced in . Thereby, the fundamental structure and associated timings change with respect to HR [Citation4,Citation7]. Profiling the temporal relations under physiological conditions requires ECG recordings from healthy individuals. For each, a broad spectrum of HRs is needed to cover the situation at rest and during exercise, similar to the situation depicted in where subjects exercise on a workout machine. Finding published ECG data with this characteristic is difficult as online databases primarily focus on pathological ECG recordings [Citation8]. Therefore, the internal data bank of the Department of Sport Science at the University of Innsbruck is consulted from which 22 ECG recordings are obtained that match the given requirements. Using these, the database for this study comprises healthy and physically fit individuals between 18 and 46 years of age (17 males; 5 females). The signals were recorded using a 12 lead ECG (medilog FD12 PLUS, Schiller) on a stress-test setup where subjects exercised on a treadmill. The Schiller-ECG system allows captured data to be exported in MATLAB’s .mat-format with a sample rate of 250 samples per second and automatic R-peak detection.
Figure 1. Basic constitution of an ECG segment of physiological type with characteristic waves and spikes [Citation4]. The IBT toolbox [Citation10,Citation11] is capable of detecting 12 characteristic points (P0–P11) from which seven are of interest for this study. POI: Points of interest; Int: Interval; Seg: Segment; Comp: Complex.
![Figure 1. Basic constitution of an ECG segment of physiological type with characteristic waves and spikes [Citation4]. The IBT toolbox [Citation10,Citation11] is capable of detecting 12 characteristic points (P0–P11) from which seven are of interest for this study. POI: Points of interest; Int: Interval; Seg: Segment; Comp: Complex.](/cms/asset/acfa426c-2210-4309-a1b9-e94fa1a6a98a/ijmt_a_1576788_f0001_c.jpg)
Figure 2. Course of heart rate during a stress test ECG. The wide variety of frequencies covered is beneficial for approximating of the temporal ECG profile and therefore of interest for this study.
Data analysis
Feature extraction and template creation
Generating synthetic ECG signals requires the recreation of signal shapes with the principal structure depicted in [Citation7]. For this study, the time parameters of interest are the durations of the PQ- and QT-intervals, the P- and T-waves, the QRS-complex and the PQ- and ST-segments. Each element is associated with a certain cardiac function. The P-wave corresponds to the depolarisation of the atria, while the QRS-complex represents the superposition of the signals generated during the repolarisation of the atria and the depolarisation of the ventricles. Subsequently, the T-wave arises because of ventricular repolarisation (although investigated for a while, the origin and clinical importance of the U-wave, which follows the T-wave, is still not fully understood [Citation3] and thus not considered in this work) [Citation9].
Quantification of these durations is performed by applying a software package that detects characteristic points within each ECG segment of a recording. The software used is the IBT toolbox developed and published by the Institute of Biomedical Engineering (IBT), Karlsruhe Institute of Technology, Germany [Citation10,Citation11]. This toolbox comprises algorithms for signal preconditioning (noise reduction and removal of baseline-drift) and feature extraction. Once an ECG recording is fully processed, each individual segment is associated with 12 characteristic points (P0–P11). Seven of these are used within this study and referred to as points of interest (PoI) in the following (see for details).
Exercise stress tests contain interferences due to muscular artefacts and movements as a result of the high level of physical activity involved [Citation6,Citation12]. Consequently, ECG segments with many interferences are prone to contain errors after feature extraction is applied (some or all points P0–P11 are not found correctly). Thus, the toolbox algorithms are extended for automated signal post-processing to identify heavily disturbed ECG segments and to exclude these from further processing by evaluation of the heart rate variability. Additionally, high frequency noise is suppressed by mean-value template generation that is also implemented in software.
Processing starts with the identification of all individual ECG segments using the R-peaks Ri as a basis. All segments are framed and organised into groups with the same HR as depicted in the scheme in . Thereby, step one is the determination of the HR for which the temporal differences between both the preceding and subsequent R-peaks (Ri−1 and Ri+1) are averaged:
(1)
(1)
Figure 3. Visual representation of ECG template generation. At the beginning, each individual ECG segment is identified based on its R-peak. Next, the associated heart rate (HR) is determined by inclusion of neighbouring R-peaks according to EquationEquation (1)(1)
(1) . Afterwards, all segments with equal heart rate are organised in the same group and aligned such that R-peaks are congruent. If at least 15 segments are contained in a respective group, ECG templates for that HR are obtained by averaging all segments, which attenuates high-frequency noise.
 . Afterwards, all segments with equal heart rate are organised in the same group and aligned such that R-peaks are congruent. If at least 15 segments are contained in a respective group, ECG templates for that HR are obtained by averaging all segments, which attenuates high-frequency noise.](/cms/asset/48b0c53e-0170-4b67-ad50-e56999c48644/ijmt_a_1576788_f0003_c.jpg)
Identification of segments with incorrectly detected HRs and abnormalities, e.g. as a result of motion artefacts, is performed in step two by comparing the change in HR to the mean heart rate variability (MHRV) of the entire recording:
(2)
(2)
MHRV = Mean heart rate variability, N = Total amount of detected heart rate segments, i = Segment number.
An ECG segment is excluded if the change in HR is out of boundaries with respect to the MHRV extended by a weighting factor:
if (abs(HR(n + 1)-HR(n))> =MHRV*weightingFactor)
{
HR(n)=nan;
}
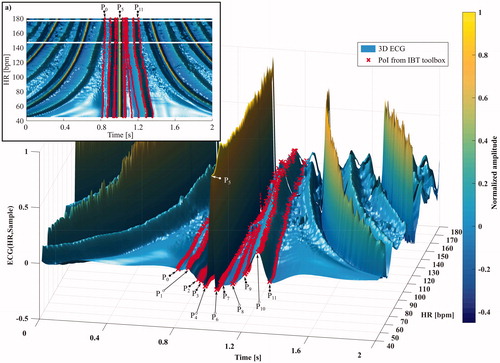
In this work, a weighting factor of two is chosen as the HR does not ramp up to double its pace from one beat to another under physiological conditions [Citation13]. This criterion is capable of detecting outliers reliably as shown in . Once all segments are sorted according to their HR, the amount of segments per HR is evaluated. If at least N = 15 samples are available, all corresponding segments are superimposed so that the R-peaks are congruent. Averaging all of these segments supresses high-frequency disturbances (white noise is assumed) and results in one template per HR. shows the results for all templates of an entire ECG recording in a 3 D graph that is referred to as 3 D ECG in the following. Finally, a medical professional assures that the PoI and ECG segments are associated correctly by visual inspection.
Figure 4. Heart rates (HR) of an individual during rest and workout. Motion artefacts introduce disturbances into the ECG recording that prevent correct R-peak detection. Thus, the change in HR from one beat to another is compared to the mean heart rate variability (MHRV) to indicate and exclude outliers from further processing.
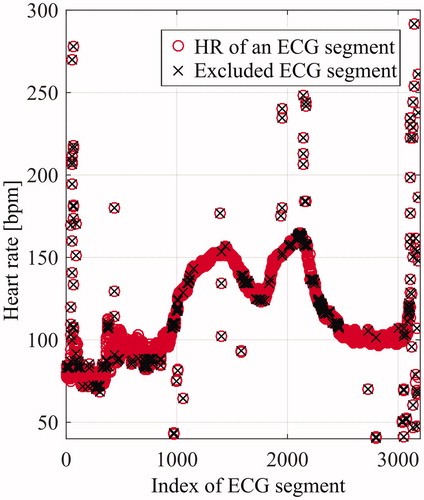
Figure 5. 3 D representation of all templates for one ECG recording overlaid with characteristic points from the IBT toolbox. As one can observe from the graph, the detectable points correlate with the minima and maxima (valleys and mountains). This depiction is referred to as 3 D ECG. (a) Top view for better legibility. HR: Heart rate.
ECG profile approximation
It is natural that physiological ECGs differ among patients because of age, sex and physical fitness [Citation13]. Furthermore, the composition of ECG segments is affected by the HR as depicted in . This study aims at finding a profile that characterises the durations of segments, waves, intervals and complexes accurately whereby avoiding influences from causes other than the HR. Thus, in a first step, the similarity between all 3 D ECGs within this database is determined in pairs (which results in a 22-by-22 matrix). Secondly, the data sets are sorted according to their mean cross-correlation values in descending order. Thereby, the 3 D ECG with the highest mean cross-correlation value becomes the reference ECG (rECG). Next, two groups are introduced whereby group A (eight ECG recordings) is used to trace and analyse temporal relations (training set) while group B (14 ECG recordings) serves as test set for performance evaluation. depicts the durations of interest versus HR for group A. The method of least squares approximation is used for curve fitting and to obtain the coefficients of the third-order polynomial in EquationEquation (3)(3)
(3) for all individual time segments of interest, respectively:
(3)
(3)
Figure 6. Depiction of timings for the waves and spikes within an ECG segment with respect to heart rate. Data from ECG recordings of the training set (group A) are depicted as points. Furthermore, polynomial fits of this work are compared with the square root and linear fits introduced by Burke & Nasor [Citation4,Citation7]. Thereby, deviations among the profiles are seen that are most obvious for the QRS-complex and the P- and T-waves, respectively. Bpm: Beats per minute.
![Figure 6. Depiction of timings for the waves and spikes within an ECG segment with respect to heart rate. Data from ECG recordings of the training set (group A) are depicted as points. Furthermore, polynomial fits of this work are compared with the square root and linear fits introduced by Burke & Nasor [Citation4,Citation7]. Thereby, deviations among the profiles are seen that are most obvious for the QRS-complex and the P- and T-waves, respectively. Bpm: Beats per minute.](/cms/asset/9fe94e86-53b3-464e-8350-ad194e1b8add/ijmt_a_1576788_f0006_c.jpg)
Data output
ECG characteristics are set and adapted during runtime via the MATLAB GUI. Following the initial selection of parameters, the signal is handled in two ways ( depicts the associated flow-chart). Data is shown on the display in the GUI directly using the “animate”-command and output synchronously via a sound card (Easy-Link, B00NLGJ3XK) with the “sound”-command in MATLAB (the online supplement contains the corresponding source code). The mentioned sound card is an external USB device that needs a minor modification of its output stage before use. This is necessary as it contains a high-pass filter to avoid DC loads on the speakers, which is a standard implementation for all sound cards. The filter of this device is implemented as an RC-network with a cut-off-frequency of 20 Hz. As ECG signals contain relevant frequencies between 0.05 Hz and 200 Hz [Citation9] an adaptation of the output-circuit is required. Thus, the capacitors of the RC-circuits are bypassed with 100 Ω resistors (the online supplement contains detailed instructions on what components to change). This measure allows to output all frequencies of interest but does not solve the problem of reproducing signal amplitudes correctly with high resolution. The sound card generates output signals with 2 Vpp using 16 Bits which corresponds to a resolution of 0.03 mV/Bit. This is too low for both ECG signals with R-peaks of 1 mV and for common-mode signals in the range of 10 V [Citation9]. As the output range of the card further depends on the volume setting of the computer, the custom-made circuit in is developed translating sound card output to real-world signal intensities (to start with calibration of the system followed by attenuation/amplification of the output signals). The desired mode is selected by manipulating a hardware switch that enables one of the functions listed in . The first switch position is used to calibrate the output voltage to 2 Vpp by adjusting the volume settings of the computer. Therefore, a 50 Hz signal is sent through the right channel for which measurements with an oscilloscope show an amplitude of 2 Vpp, while an off-the-shelf volt-meter displays an effective voltage of 0.707 Vrms if adjusted correctly. Following calibration, MATLAB ECG signals use the full range of the sound card and are processed on the circuit board at switch position 2. The associated circuit attenuates the signal by a divisor of 1000 to obtain typical ECG signal intensities with high resolution. The third switch position is used to amplify a 50 Hz common mode signal simulating capacitive coupling of the human body with surrounding power lines [Citation9]. Signal-amplification to 10 Vpp is achieved by a non-inverting amplifier with a gain of 10. This configuration is particularly important for the evaluation of the common-mode stability. The circuit board input stages are realised with operational amplifiers to protect the sound card from high DC loads. introduces the simplified circuit diagram.
Figure 7. Flowchart of the signal generation including optical readout and physical output. MATLAB software generates the synthetic ECG signal or outputs recorded data from a database. The selected signal is shown on-screen within the GUI and output through the sound card via the “sound” command. An external USB sound card converts the digital signal into an analogue signal before it reaches the external circuit board. Depending on the switch position, ECG or common-mode (CM) signals are available for system-testing. Calibration (Cal) uses switch position 1.
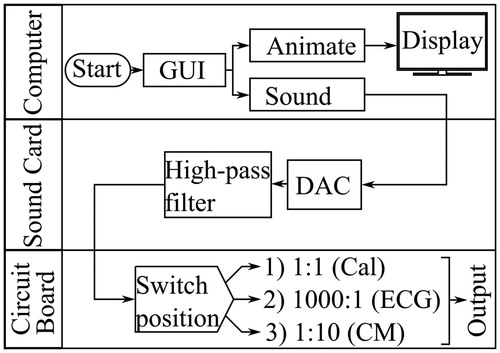
Figure 8. Circuit board to convert sound card signals to physiological ECG signals. (a) The circuit diagram of the board with three output options, adjustable with a switch (see for details). (b) The manufactured circuit board with its outputs ‘1’ and ‘2’. Potentiometers allow for precise adjustment of attenuation/ amplification factors.
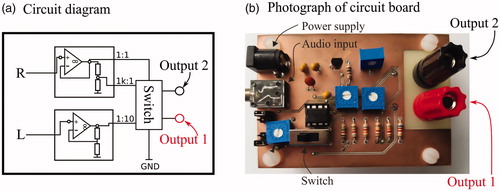
Table 1. Switch positions and associated modes of the circuit board.
Results and discussion
3D ECGs
3D ECGs are used to evaluate both the performance of the IBT toolbox with the supplements of this work and to assure that all PoIs are associated correctly. depicts such a representation from where one can obtain that the minima (P4, P6 and P11) and maxima (P1, P5 and P10) correspond accurately to the PoI. shows a top view for better legibility. Besides the evaluation of academic questions, 3 D ECGs allow for a compact depiction of long ECG recordings that might be of use for clinical diagnostics in future applications (e.g. AV-block of second type).
Correlation of the 3 D ECGs from the training set
The rECG is the 3 D ECG with the highest mean-correlation value in comparison with all other 3 D ECG recordings in the database of this study. This recording and the following seven define the training set (group A) that is used to approximate the HR-dependent ECG profile numerically. introduces the correlation results for this group with respect to the rECG. It is found that the minimal correlation value amounts to 99.29%, which is a solid base for polynomial approximation.
Table 2. Correlation results for the training ECG recordings in group A.
ECG profile approximation
contains the durations for relevant timings of this work with respect to the HR (ranging from 40 bpm to 180 bpm). Data points are from group A exclusively and form a point cloud that is approximated numerically by applying a least squares algorithm with the approximation function in EquationEquation (3)(3)
(3) . The individual coefficients for the polynomial fit are contained in . As one can observe from the figures, the QRS-complex is barely changing with respect to HR which is not adequately considered in the widely accepted ECG profile of Burke and Nasor [Citation4,Citation7]. Furthermore, great deviations are visible for the P- and T-waves, as well as for the PQ-segment. The other approximations are very similar. A fair comparison of the ECG profile of this work and the function commonly applied is conducted by correlating both profiles with the 3 D ECG recordings in group B. Among all 14 test sets, the mean correlation amounts to 98.57% for the profile of this work and to 91.46% for the profile of Burke and Nasor [Citation4,Citation7]. depicts the results graphically.
Figure 9. Determination of the accuracy between recorded ECG signals with the profiles of this work and the profile suggested by Burke & Nasor [Citation4,Citation7]. To achieve an unbiased result, only the test set (group B) is evaluated for this comparison.
![Figure 9. Determination of the accuracy between recorded ECG signals with the profiles of this work and the profile suggested by Burke & Nasor [Citation4,Citation7]. To achieve an unbiased result, only the test set (group B) is evaluated for this comparison.](/cms/asset/14e67a07-db72-42d0-ad9b-c626dc545e23/ijmt_a_1576788_f0009_c.jpg)
Table 3. Curve-fitting results for the third-order polynomials according at the function at bottom of the table (equivalent to EquationEquation (3)(3)
(3) ).
ECG simulation
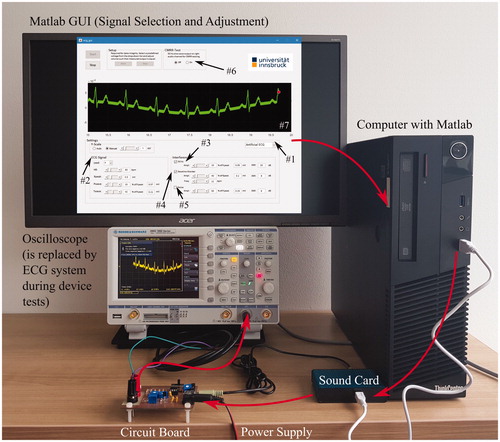
introduces the entire simulator system including the computer with the MATLAB GUI, the external sound card, the circuit board and an oscilloscope (Rohde & Schwarz, HMO 1002). The oscilloscope is replaced by ECG systems during compliance-tests. The software is capable of both the output of ECG recordings from a database and the output of synthetic ECGs (drop-down menu #1). The latter uses the temporal profiles derived in this work to generate the Einthoven lead signals (I–III) [Citation14]. Thereby, the heart rate and amplitude of the waves and spikes is set-on-selection, but remains fully customisable via the MATLAB GUI (#2). Additionally, three common distortions can be added to the plain ECG signal to evaluate the robustness of systems under test: The first is power-line noise with a frequency of 50 Hz and adjustable intensity (#3). The second is baseline wander that is adjustable with respect to amplitude and frequency between 0.1 Hz and 1 Hz (#4). The third is random noise to mimic muscle activity and motion artefacts (#5). An extra option allows studying the common-mode sensitivity (#6) that is integrated as well but not found very often in ECG simulators [Citation12]. All signal manipulations are displayed in real-time within the GUI (#7). Physical signal output is achieved through the sound card and the custom circuit board (see for further reference). The switch position identifies the mode of operation as introduced in . Physical signals correspond to those shown on-screen. Displaying recorded ECG datasets from the PhysioNet database [Citation8] is possible by selecting the desired morphology in the drop-down menu (#1). Beyond the ECGs that are already implemented, further ECG datasets can be integrated easily.
Figure 10. The entire ECG simulator system. Signals are selected (#1), or adjusted for synthetic ECG generation (#2–#6), via a MATLAB GUI. The computer running the software outputs these signals via the external sound card. Finally, the circuit board converts the signal intensities to physiological levels. The configuration above shows an oscilloscope (Rohde & Schwarz, HMO 1002) for demonstration purposes. For real ECG testing, the system under test is connected to the circuit board directly. The MATLAB display (#7) and the physical signal output are synchronised. The signal shown above is a synthetic ECG with 60 bpm, 50 Hz noise and baseline wander. An enlarged view of the GUI is included in the online supplement.
Conclusion
This work introduces a novel type of ECG simulator that combines the advantages of existing software simulators and hardware units. To start with, ECG signal selection or ECG generation is performed through MATLAB software that allows for a great amount of flexibility and, at the same time, enables changes to adapt the programme for future needs. The physical signal output itself is through a commercial sound card and a custom circuit board that scales signals as needed to represent realistic signal amplitudes. The synthetic ECG generation uses a profile that obtains higher correlation scores (98.57%) compared to a widely used version introduced by Burke and Nasor (91.46%). Combining the revised ECG morphology with increased functionality and flexibility results in a powerful ECG simulator. The primary use of this system is foreseen in academic research and university education. Being an open-source project, the authors support the extension of functionality with regard to ECG lead standards and pathophysiological signals. Extending both the soft- and hardware configuration to generate other (biological) signals is promoted as well.
Online supplement
This work is meant to stimulate further research on ECG simulators and similar projects. Thus, the MATLAB source code, the Gerber layout files and detailed instructions concerning modifications on the sound card are available online: https://git.uibk.ac.at/c8501024/ECGsimulator
Acknowledgements
The Department of Sports Science would like to express its gratitude to the Schiller Handelsgesellschaft M.B.H. for a successful cooperation including on-site support and useful discussions.
Disclosure statement
No potential conflict of interest was reported by the authors.
References
- World Health Organization. 2017. Cardiovascular disease. [Cited 2018 Mar 06]. Available online: http://www.who.int/cardiovascular_diseases/en/
- Sakra World Hospital. 2015. Golden Hour After a Heart Attack. [Cited 2018 Mar 20]. Available online: https://www.sakraworldhospital.com/blogs/Heart-attack-The-Golden-Hour/21
- Jóśko A, Rak RJ. Effective simulation of signals for testing ECG analyser. IEEE Trans Instrum Meas. 2005;54:1019–1024.
- Burke MJ, Nasor M. An accurate programmable ECG simulator. J Med Eng Technol. 2001;25:97–102.
- Caner C, Engin M, Engin EZ. The programmable ECG simulator. J Med Syst. 2008;32:355–359.
- Güney E, Ekşi Z, Çakıroğlu M. WebECG: a novel ECG simulator based on MATLAB Web Figure. Adv Eng Softw. 2012;45:167–174.
- Burke MJ, Nasor M. Wavelet based analysis and characterization of the ECG signal. J Med Eng Technol. 2004;28:47–55.
- PhysioBank. Physionet. [Cited 2018 Mar 20]. Available online: https://physionet.org/physiobank/
- Bolz A, Urbaszek W. Technik in der Kardiologie. Berlin, Germany: Springer-Verlag Berlin und Heidelberg GmbH; 2002.
- Baas T. ECG based analysis of the ventricular repolarisation in the human heart. KIT Karlsruhe: University Press; 2012
- Lenis G. Signal Processing Methods for the Analysis of the Electrocardiogram. Karlsruhe, Germany: Karlsruhe Institute of Technology; 2017
- Evans AL, Smith DC, Watts MP. Microprocessor-controlled signal generator for the functional testing of electrocardiographs. Med Biol Eng Comput. 1984;22:468–470.
- Borst C, Wieling W, Van Brederode JF. Mechanisms of initial heart rate response to postural change. Am J Physiol. 1982;243:676–681.
- Einthoven W. 1904. The string galvanometer and the human electrocardiogram. Proceedings of the Section of Science of the Dutch Royal Society of Medicine, 4, 107–115.