
Abstract
Second metatarsal stress fractures are a problematic injury for runners and are formed when the rate of repair of bone is outpaced by the damage accumulated during loading. Measuring the peak stresses on the bone during running gives an indication of damage accumulation but direct measurement is invasive. Finite element modelling is a viable alternative method of accurately estimating bone stresses but tends to be too computationally expensive for use in applied research. This study presents a novel and simple finite element model which can estimate bone stresses on the second metatarsal during the stance phase of walking and running, accounting for joint reaction forces and soft tissue effects. The influence of the forces and kinematic inputs to the model and the presence of the soft tissues was quantified using a sensitivity analysis. The magnitudes of maximum stress from the model are similar to existing finite element models and bone staple strain gauge values collected during walking and running. The model was found to be most sensitive to the pitch angle of the metatarsal and the joint reaction forces and was less sensitive to the ground reaction forces under the metatarsal head, suggesting that direct measurement of external forces should not be assumed to represent internal stresses.
Introduction
Stress fracture of the second metatarsal is a common overuse injury associated with running [Citation1]. Current theory suggests that during activities such as running, bones are subject to repetitive loading, and that this leads to microdamage. In healthy individuals the bone damage is repaired through a remodelling process, which is activated through mechanotransduction [Citation2] and over time the bone becomes more resilient to the applied loading. However, if loading is continued during this remodelling process then further microdamage can occur and the accumulation of damage can outpace the rate of repair, resulting in a stress fracture [Citation3,Citation4]. A major determinant of the amount of microdamage caused by an activity is the magnitude of loading applied to the bone [Citation5] and therefore understanding of how the internal loading of bone changes with external factors such as gait kinematics or running speed is important.
Recent research has suggested that using external measurements, such as ground reaction forces, as a direct estimate of internal forces may not be valid [Citation6,Citation7]. In past research, in vivo measurement of internal loading has been conducted using surgically-inserted bone staple strain gauges [Citation3,Citation8]. However, this is highly invasive making it unfeasible for addressing applied questions. Mathematical modelling is a viable alternative to invasive research and has been used to quantify second metatarsal loading during both walking and running [Citation7,Citation9–12]. These modelling approaches range from beam theory models [Citation9,Citation10], which are computationally simple and lend themselves to analysis of larger groups of participants, to finite element models [Citation11,Citation12], which account for more realistic geometry and can include interactions with soft tissues. Many models in the literature, such as that of Akrami [Citation12], are extremely realistic, accounting for almost every tissue in the foot. However, this high level of detail requires long computation times and therefore sample sizes are small. Models of this nature are not suitable for applied research and understanding of population-wide overuse injuries such as metatarsal stress fractures. Other recent models such as that of Fung [Citation13] are much simpler in design and therefore can more easily be used to investigate larger groups of participants. A model proposed by Firminger [Citation11] was used to establish the influence of footwear on metatarsal stain. However, these models did not account for the combined effects of soft tissues and joint reaction forces from the toes.
The aim of this study was to develop a subject-specific, finite element model of the second metatarsal that is sufficiently computationally inexpensive for use in addressing applied research questions. It would incorporate the bony tissue and the surrounding soft tissues. The influence of the model parameters and the independent input variables on the bone stresses were quantified.
Materials and methods
Participants
Nineteen injury free athletes (9 female; age 25 ± 9 years; mass 66.5 ± 11.9 kg; height 1.68 ± 0.09 m) participating in running activity (>3 times per week and >150 min per week) were recruited as part of a larger study. Data from these 19 participants were utilised to quantify metatarsal stress during running, whilst model sensitivity analyses were conducted for one selected participant (female; age: 49 years; mass: 55.8 kg; height: 1.62 m). All participants reported no current injuries affecting their running regimen and had not sustained any lower limb injuries that prevented their normal training within the last year. The participants were given information about the study and provided written informed consent. The study was given ethical approval by the Sport and Health Sciences Ethics Committee, University of Exeter.
MR imaging
To determine individual metatarsal geometry, magnetic resonance (MR) images were collected with the participant lying supine within a 1.5 T superconducting whole body scanner (Gyroscan Intera, Philips, The Netherlands). The location of the second metatarsal and phalange was initially identified via palpation and a cod liver oil capsule placed on the foot at that location using MicroporeTM tape (3 M, USA). The unloaded foot was then placed against a flat vertical barrier within a quadrature head coil to minimise movement. Stacks of MR images covering the whole of the foot and centred around the second metatarsal were then acquired in sagittal, coronal and axial planes. A T1 weighted (repetition time 20 ms, echo time 4.0 ms, flip angle 50°) 3 D gradient echo sequence was utilised with an in-plane resolution of 0.3 × 0.3 mm and a slice thickness of 0.7 mm. Depending on the imaging orientation, between 60 and 160 slices within a stack were required for full coverage.
Running protocol
The participants’ height and mass were measured whilst wearing their own running kit. Synchronised kinematic, kinetic and plantar pressure data were collected during barefoot running at a constant speed of 3.6 ms−1 along a runway using four CX1 units (Coda CX1, Codamotion – Charnwood Dynamics Ltd., U.K.) with an integrated force plate (1000 Hz) (AMTI BP400600HF, Advanced Mechanical Technology Inc., U.S.A.). Four active skin markers (200 Hz) were attached directly to the skin and used to mark the distal and proximal ends of the second metatarsal and the distal ends of the first and fifth metatarsal. The markers for the first and fifth metatarsals were placed on the sides of the foot at the same height from the floor whilst the participant was standing. This was used for frontal plane alignment of the foot during processing. The length of the second toe was measured by placing the zero point of a flat metal rule against the centre of the underside of the metatarsal head, as located via palpation. The participants were then asked to stand on this ruler and the point where the toe touched the ruler was recorded as the toe length.
A plantar pressure plate (RSscan 0.5 m Hi-End Footscan, RSscan – Beringen, Belgium) was placed over the force plate such that the pressure plate was entirely within the boundaries of the force plate. This was positioned flush with a runway comprised of EVA foam. Pressure data were collected at 200 Hz using Footscan software (RSscan Footscan Gait v7, RSscan – Beringen, Belgium). An opportunity to warm up was provided and familiarisation trials were completed until participants were comfortable running at the desired speed on the runway surface. Feedback on the running speed was provided after each attempt using a set of light gates (WITTY system, Microgate, Bolzano, Italy) set up at 3 m intervals across the force plate. The experimental protocol consisted of running at a constant speed ensuring that the right foot contact was within the pressure plate boundaries. A trial was considered successful when the right foot contacted the pressure plate, speed was registered as 3.6 ms−1 (±5%), markers showed good visibility during foot contact with the pressure plate and the investigator observed no unusual movement during ground contact. Ten successful running trials were recorded. In addition, the single participant whose data were to be used for sensitivity analyses was asked to walk at a self-selected pace (0.96 ± 0.05 ms−1) and five trials were collected. These data were used to compare the stress and strain values from the current study to other models that simulated walking and to in-vivo measurements as well as to ensure the model was sensitive to the increases in stress expected when running compared with walking.
Data analysis
The procedure for pressure analysis was taken from Rice [Citation14] and analysis was performed using RSscan Footscan Gait v7 (RSscan, Beringen, Belgium).
Modelling
Assumptions of the model were:
Segmentation of tissues
Data from MR images requires treatment in a number of different software packages in order to reconstruct the geometry of body parts for use in finite element simulation. This workflow is shown in detail in the work of Akrami [Citation15], but details relevant to this model are described below.
Segmentation was carried out using Simpleware ScanIP (Synopsys, California, U.S.A). Three tissue types were recreated from MR scans: trabecular bone; cortical bone; and bulk soft tissues surrounding the metatarsal. The MR scans allowed the cortical bone to be distinguished from both trabecular bone and soft tissues by intensity and therefore segmented separately. An example of the reconstructed bony material can be seen in .
Figure 1. Example of segmented trabecular (inner) and cortical (outer) bone..
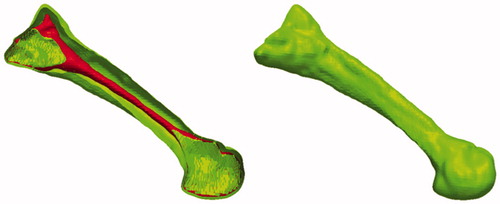
Surrounding soft tissues were segmented such that a single homogeneous block was created that completely encapsulated the metatarsal bone to approximate the length and width assigned to the second metatarsal in the RSscan plantar pressure software. Subsequently, 14 slices of the soft tissue at the proximal end of the metatarsal were removed such that the proximal end of the bone was exposed. This was required to enable the modelled bone to be fixed proximally at the next stage of processing. CATIA (Dassault Systèmes, USA) was used to assign the boundary surfaces and develop the solid structures of the bones and soft tissues.
Model development
The model was assembled, meshed and simulated in ABAQUS software (Simulia, Providence, U.S.A) on a machine running the Windows 7 operating system (CPU: Core i5 3470 @ 3.20 GHz, Ram: 8 GB). The metatarsal was considered to act as a fixed cantilever with no motion allowed at its base. It was loaded with the vertical and anterior-posterior ground reaction forces and the estimated joint reaction forces acting at the distal metatarsal.
Within ABAQUS, the trabecular bone was embedded within the cortical bone, which was in turn tied to the soft tissue such that no motion was allowed between parts. The horizontal and vertical ground reaction forces were applied via a rigid plate which simulated the floor. A frictional penalty of 0.6 was applied at the foot ground interface, similar to previous studies [Citation12]. Meshing was conducted within ABAQUS using the free mesh tool. A quadratic tetrahedral element type (C3D10) was used for meshing cortical and trabecular bone and encapsulating soft tissues, which gives better accuracy than a linear element type [Citation16]. A linear hexahedral element type was used for the simulated floor (C3D8R).
The material properties of the bone and encapsulating soft tissues are presented in . These properties were based on previous finite element models of the foot [Citation12,Citation17].
Table 1. Model parts and their material properties.
Loads and boundary conditions
The loading applied to the floor was obtained by estimating the ground reaction forces acting under the second metatarsal head as in previous research [Citation7].
The joint reaction forces represented the influence of the plantar tendons and the forces transferred from the ground to the metatarsal via the toe. These were calculated using the procedures detailed in Ellison et al. [Citation7].
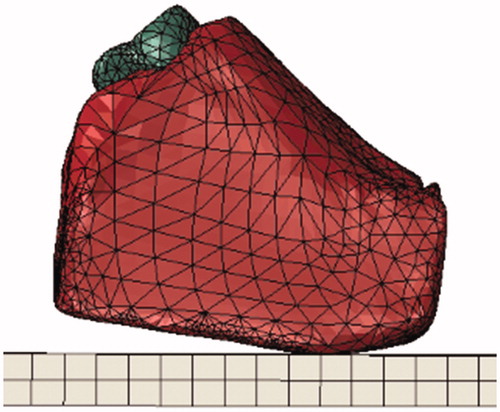
The finite element model was simulated at three time points during the stance phase of running: time of maximum vertical ground reaction force; time of maximum braking force (maximum posterior force); and time of maximum propulsion (maximum anterior force). For each of these three time points the vertical and anterior-posterior forces from the experimental data were applied directly to the simulated floor which was allowed to move in the direction of action of the forces. The joint reaction forces were applied directly to the head of the metatarsal by selecting the most anterior 2% of nodes to receive the load. This was chosen to systematically approximate the contact area between phalange and metatarsal head and was visually similar in proportion and position to the area seen by Flavin [Citation18] in a simulation of the contact between the first metatarsal and phalange. To represent the kinematics observed during the experimental protocol, the floor surface was aligned relative to the metatarsal using two angles. The first, representing the pitch of the foot, was defined as a vector angle between the line of the proximal and distal second metatarsal markers and the anterior-posterior axis of the lab co-ordinate system (sagittal plane). A greater pitch angle represented a proximal metatarsal that was higher vertically than the distal metatarsal. The second, representing the eversion angle of the forefoot was defined as a vector angle between the distal markers for the first and fifth metatarsals and the mediolateral axis of the lab co-ordinate system (frontal plane). A greater eversion angle represented a forefoot in which the fifth metatarsal was higher vertically than the first metatarsal. The mean time series across all ten trials for both forces and angles were used as inputs into the model. shows the assembled model.
Figure 2. The final assembled and meshed model showing cortical bone within the encapsulating soft tissues on top of the simulated floor surface.
Analysis
Sensitivity analyses were conducted on the single participant that performed the walking trials to determine the influence of element sizing on maximum stress magnitude and computation time, and to quantify the robustness of the model to the input variables. Initially a mesh refinement study was conducted in which global element size was set to 5 mm on all parts. Element sizing for individual parts was then manipulated by increasing the mesh density for each part in turn from very coarse to fine and the effect on the bone stresses and computation time were observed. Optimised element sizes were then used for all other participants, such that whilst participants would have differing numbers of elements for model parts, overall element size would be consistent between participants. Similarly, for the single participant, the six input variables (vertical and horizontal ground reaction forces, calculated vertical and horizontal joint reaction forces, and sagittal and frontal plane angles) were adjusted independently and their effect on maximum von Mises bone stress was observed. These simulations were conducted at the time of maximum propulsion during running as at this time point the vertical ground reaction forces and joint reaction forces were most similar in magnitude. Therefore, when manipulating the input forces systematically by a percentage of the original input force, the absolute change in ground reaction force and joint reaction force magnitudes were similar.
In order to examine the effect of the inclusion of the soft tissue on maximum bone stress, the model was simulated both with and without its inclusion, and maximum von Mises stresses were compared. When the soft tissue was removed the floor surface was placed in direct contact with the head of the metatarsal. Simulation of this condition resulted in a high localised stress at the point where the bone contacts the floor surface in addition to the stress distribution across the shaft of the bone. The results presented consider only the stresses on the shaft of the metatarsal. To examine the effect of joint reaction forces, the model was also simulated with and without these included, and maximum von Mises stresses were compared. These simulations were conducted at all three time points during running.
Results
Mesh sensitivity analysis
The optimum mesh densities for the assessment of cortical bone stresses, based on the results of the mesh sensitivity analysis, can be seen in . Using these densities, the simulation time was 35 min on average. Floor mesh density was varied between 50 and 3750 elements, with a difference in computation time of seven minutes between the coarsest and finest mesh. The contact pressure between the floor surface and soft tissues remained constant at numbers above 900 elements and the maximum stress on the cortical bone changed by only 0.01 MPa at element numbers above this. Cortical bone mesh density was varied between 8491 and 17,229 elements. Maximum bone stress stabilised above 10,263 elements, with changes in stress of less than 0.28 MPa between this number and the densest mesh. However, above this mesh density the computation time increased considerably (10,263 elements: 35 min; 12,317 elements: 57 min; 17,229 elements: >12 h). The model was highly stable to changes in trabecular bone mesh density. Variation between 8430 elements and 36,761 elements yielded only a 0.02 MPa difference in maximum stress on the cortical bone with corresponding computation times of 8430 elements: 29 min; 16,726 elements: 37 min; 36,761 elements: 45 min. The encapsulating soft tissue mesh density was varied between 14,442 and 62,046 elements. The maximum stress within the soft tissue oscillated between 0.71 MPa and 1.01 MPa, however, the maximum stress on the bone was stable, changing by only 0.77 MPa between the coarsest and finest conditions. Computation time increased considerably when the number of elements exceeded 17,201, (17,201 elements: 30 min; 32,914 elements: 59 min; 62,046 elements: >20 h). Shape factors and aspect ratios were all found to be of good quality.
Table 2. Element sizes and numbers for each model part.
Running and walking stress data
The maximum von Mises stress on the bone during the three points of stance for the whole sample can be found in , and the individual results for walking and running in the single participant can be found in . The dorsal metatarsal was under compression whereas the plantar surface was under tension throughout stance. For the whole sample the point of stance corresponding to the maximum vertical ground reaction force had the highest bone stresses, with maximum braking representing the lowest stress on the bone of the three stance points investigated. For the individual participant, a similar trend was found during walking, with the point of maximum vertical ground reaction force corresponding to the largest stress and the point of maximum braking forces corresponding to the lowest stress. Angles were similar during walking and running, whilst forces were larger during running than walking, as expected. shows the stress map on the bone for each investigated point of stance during running for the individual participant. At the time of maximum propulsive force the maximum stress was located on the dorsal surface at the distal end of the shaft, whereas at the time of both the maximum braking force and maximum vertical force it was located at the plantar midshaft.
Figure 3. Results from three points of running stance, left to right: maximum braking, maximum vertical GRF, maximum propulsive force. Arrows represent points of maximum stress at each time point.
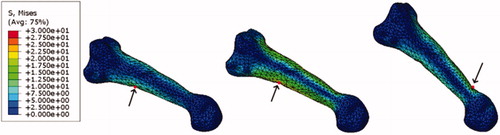
Table 3. Mean input and outcome variables for the entire running sample.
Table 4. A comparison of running and walking data across each point of stance for one participant.
Input sensitivity analysis
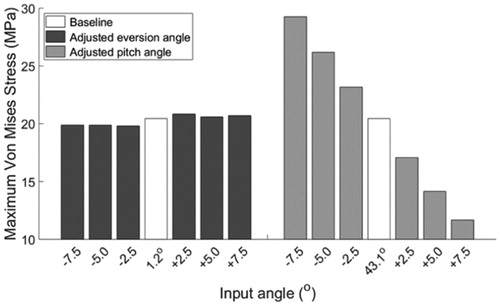
The sensitivity of the model to changes in the six input variables can be found in and . The results of the sensitivity analysis suggest a linear relationship between input forces or pitch angle and maximum bone stresses in the model, with the model being most sensitive to pitch angle () and vertical joint reaction forces (). A change of one degree in the pitch of the metatarsal corresponds to approximately one MPa change in maximum bone stress, with a steeper angle producing less stress. A change of one Newton in vertical joint reaction force represents approximately a 0.2 MPa change in bone stress. The model is less sensitive to ground reaction forces, with one Newton changes in the vertical and horizontal forces representing 0.04 MPa and 0.03 MPa changes in the bone stress respectively.
Figure 4. Model sensitivity to changes in input ground reaction forces (A) and joint reaction forces (B).
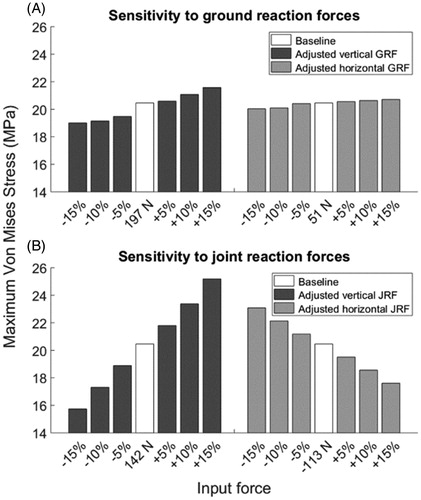
Figure 5. Model sensitivity to changes in input angle.
Comparison without soft tissue and joint reaction forces
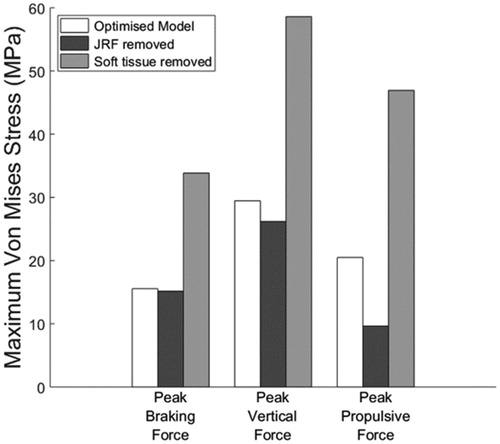
The influence of soft tissue and joint reaction forces on maximum bone stress is shown in . Removing the soft tissues increased maximum stress in the shaft of the metatarsal greatly, particularly at the time of maximum propulsion. Exclusion of the joint reaction forces reduced the maximum stress, particularly at the time of maximum propulsion.
Figure 6. Model sensitivity to the inclusion of the joint reaction forces (JRF) and the soft tissue throughout stance.
Discussion
This study developed a novel, subject-specific finite element model to quantify metatarsal stress during running and evaluated the influence of model parameters and independent input variables on maximum bone stress. The model simulation time was approximately 35 min, making this approach feasible for assessing the influence of interventions in a larger sample of participants.
During walking, the maximum stress on the bone was 19.50 MPa at the time of greatest vertical ground reaction force, which coincides approximately with mid-stance. This is equivalent to a strain of 1147 µε. Finite element models of the entire foot have reported maximum von Mises stresses in the second metatarsal of ∼4 MPa [Citation19], 6.65 MPa [Citation20] and 6.8 MPa [Citation21] during walking at mid-stance. In vivo measurements of strain on the metatarsals using implanted strain gauges have reported 1534 µε in barefoot walking [Citation8] and an average of 1144 µε in shod walking [Citation3]. The current model, whilst simplistic compared to the whole foot models listed above, compares better with bone staple strain gauge data. However, it should be noted that strain gauges in in vivo studies may not be positioned at the location of maximum stress on the bone.
For the whole sample during running, the mean peak stress on the bone was 44.99 MPa at the time of greatest vertical ground reaction force, equating to a strain value of 2646 µε. Other recent finite element models of the second metatarsal during shod running have reported the 95th percentile strains and found 3110 µε (typical running shoe) and 4341 µε (minimally cushioned shoe) [Citation11]. In-vivo strain gauge studies have reported strains of 1468 µε during shod jogging and an average of 3603 µε during barefoot jogging [Citation3]. These values were an average of two participants’ values (5315 µε and 1891 µε) which differed considerably, highlighting the need for subject-specific modelling approaches that permit sufficient sample sizes to be obtained. The wide range of values reported in these earlier studies may reflect the sensitivity of the measurement or true physiological variability. The results from the current study are within the range of previously reported strain magnitudes. The highest strain during the time of maximum ground reaction forces reported by any participant was 4648 µε and the lowest strain was 1654 µε. Whilst it is not feasible to directly validate the model, comparisons with previously reported values and the differences in magnitude between walking and running indicate that this model can be used to address applied questions. Whilst the maximum stress during running occurred on the dorsal midshaft of the metatarsal, the magnitude of von Mises stress at the corresponding position on the plantar surface was very similar.
The high sensitivity of the model to pitch angle suggests that kinematics of the foot during running are an important consideration when investigating loading on the metatarsal bones and injury risk. With a smaller pitch angle the metatarsal is closer to parallel to the ground and therefore the relatively large vertical ground reaction force under the metatarsal head can produce a greater amount of bending in the metatarsal compared with later stance when the metatarsal is more vertical (i.e., increased pitch angle). When conducting input sensitivity analyses in the present study, the original vertical ground reaction force and the joint reaction force inputs were comparable in magnitude during late stance. This is not the case during other points of stance, such as early stance, when the joint reaction force is very low compared to the ground reaction forces under the metatarsal head, limiting its ability to influence bone stress. It should also be noted that whilst directly increasing the forces under the metatarsal head did not provide the greatest increases in bone stresses, the ground reaction forces under the toe contribute greatly to the joint reaction forces, which the model is sensitive to. This supports recent work suggesting that direct external measurements do not correlate well to internal forces [Citation6]. The lack of sensitivity to the eversion angle is likely influenced by the fact that the angles measured are very small. Furthermore, due to the anatomy of the foot, there is little ability for the individual metatarsals to rotate along their longitudinal axes. The frontal plane position of the foot may be likely to influence the ratio of loading under the five metatarsals rather than change the line of action of the forces in a way that would affect the stresses seen on the bone. It should be noted that the sensitivity analyses provide a useful understanding of how external factors independently influence metatarsal stress, yet the manipulations may not be physiologically realistic. Furthermore, it is unlikely that any of the individual input variables would change without a concurrent change in the other input variables.
Excluding the joint reaction forces from the simulation provided insight into the influence of muscular action and toe forces on metatarsal stresses. At all three time points during stance, exclusion of joint reaction forces decreased the maximum stress on the bone. Its influence was greatest during late stance, likely due to the position of the foot at push off when the ground reaction forces are lower under the metatarsal head and higher under the toe. This also supports previous literature showing that the metatarsophalangeal joint moment is largest in late stance [Citation22], suggesting muscular contributions to bone stresses should also peak at this time. A higher horizontal joint reaction force during late stance may be protective as it acts in the opposite direction to the ground reaction force, limiting its ability to cause bending.
The novel inclusion of soft tissue surrounding the metatarsal in the present study was shown to considerably influence maximum bone stress. The mesh sensitivity analysis revealed that stresses within the encapsulating soft tissues oscillated considerably with different mesh densities, yet bone stresses remained extremely stable throughout these manipulations. The variation in the soft tissues is likely due to the choice of a linearly elastic soft tissue, which is undergoing large strains. This suggests that if the stresses within the soft tissues themselves are important outcome variables, a non-linear material should be chosen, such as those used by Morales-Orcajo [Citation23]. However, if the soft tissue stresses are unimportant, as in the present study where the model is designed to quantify bone stress, the large strains are acceptable and the use of a linearly elastic soft tissue saves considerable computational time.
This model represents a method for computing metatarsal stress values in a relatively short time, approximately 30 min for each point in stance. This is particularly useful when undertaking typical biomechanical studies, which generally feature larger participant numbers than the complex n = 1 models such as the work of Akrami [Citation12] presented in the literature so far. Given that typical biomechanical studies such as Ellison et al. [Citation7] feature around 20 participants and that there may be several points of interest during stance, the number of simulated time points can be limiting. Current models featuring the mechanics of the whole foot such as the work of Akrami [Citation12] may take many hours to compute a single time point for one participant, even when using a high performance computing platform. Furthermore, segmenting tissues, whilst only completed once per participant, can be extremely time-consuming, depending on which tissues are included. This limits the number of simulated time points and participants that can be included and makes any study using statistical testing methods prohibitively time consuming. The model presented here allows for participant numbers commensurate with typical statistical tests to be included in the analysis without degrading the quality of results produced.
All models have limitations, as they are simplified representations of real systems. In this case the system modelled consisted of a large number of bones and soft tissues, with forces acting under all five rays of the foot. This model consists of just one bone, assuming no interactions between neighbouring parts of the foot at the distal end and a fixed proximal end. Proximally, the second metatarsal bone is attached to the midfoot via three other bones, forming a reasonably stiff joint with little room for extension or flexion, and several models have used a fixed cantilever to model the metatarsal in the past [Citation9,Citation10,Citation13,Citation24]. At the distal end, the metatarsal heads are connected via the transverse metatarsal ligaments, limiting their independent motion. It is not clear whether this would affect the sharing of loading from external forces. The deformation of the arch is not accounted for here, nor is the possible reduction in bending from its supporting tissues, such as the plantar aponeurosis and the long and short plantar ligaments. Models that do include representations of these tissues have far lower stresses on the second metatarsal [Citation19–21], but do not represent the high strains reported using in vivo strain gauges [Citation3,Citation8]. The effect of these tissues on the distribution of internal loading in the foot is unclear.
Conclusion
This study details the parameters of a novel, subject-specific model that can quantify stresses in the second metatarsal during running, for use in addressing applied research questions. Comparison with other recent models and in vivo experiments during both walking and running suggests the model provides reasonable estimates of metatarsal stress. Inclusion of the surrounding soft tissue was found to considerably influence the stresses reported on the bone and should be included. Maximum metatarsal stress is sensitive to the distal joint reaction forces and the pitch angle of the metatarsal relative to the ground, but less sensitive to direct loading from the ground reaction forces under the metatarsal head.
Disclosure statement
No potential conflict of interest was reported by the author(s).
Additional information
Funding
References
- Chuckpaiwong B, Cook C, Pietrobon R, et al. Second metatarsal stress fracture in sport: comparative risk factors between proximal and non-proximal locations. Br J Sports Med. 2007;41(8):510–514.
- Martin RB, Burr DB, Sharkey NA, et al. Skeletal tissue mechanics. New York: Springer; 2015. English.
- Milgrom C, Finestone A, Sharkey N, et al. Metatarsal strains are sufficient to cause fatigue fracture during cyclic overloading. Foot Ankle Int. 2002;23(3):230–235.
- Schaffler MB, Jepsen KJ. Fatigue and repair in bone. Int J Fatigue. 2000;22(10):839–846.
- Carter DR, Caler WE, Spengler DM, et al. Fatigue behavior of adult cortical bone: the influence of mean strain and strain range. Acta Orthop Scand. 1981;52(5):481–490.
- Matijevich ES, Branscombe LM, Scott LR, et al. Ground reaction force metrics are not strongly correlated with tibial bone load when running across speeds and slopes: implications for science, sport and wearable tech. PLoS One. 2019;14(1):e0210000.
- Ellison MA, Kenny M, Fulford J, et al. Incorporating subject-specific geometry to compare metatarsal stress during running with different foot strike patterns. J Biomech. 2020;105:109792.
- Arndt A, Ekenman I, Westblad P, et al. Effects of fatigue and load variation on metatarsal deformation measured in vivo during barefoot walking. J Biomech. 2002;35(5):621–628.
- Stokes IA, Hutton WC, Stott JR. Forces acting on the metatarsals during normal walking. J Anat. 1979;129(Pt 3):579–590.
- Gross TS, Bunch RP. A mechanical model of metatarsal stress fracture during distance running. Am J Sports Med. 1989;17(5):669–674.
- Firminger CR, Fung A, Loundagin LL, et al. Effects of footwear and stride length on metatarsal strains and failure in running. Clin Biomech. 2017;49(Suppl C):8–15.
- Akrami M, Qian Z, Zou Z, et al. Subject-specific finite element modelling of the human foot complex during walking: sensitivity analysis of material properties, boundary and loading conditions. Biomech Model Mechanobiol. 2018;17(2):559–576.
- Fung A, Loundagin LL, Edwards WB. Experimental validation of finite element predicted bone strain in the human metatarsal. J Biomech. 2017;60:22–29.
- Rice H, Nunns M, House C, et al. High medial plantar pressures during barefoot running are associated with increased risk of ankle inversion injury in Royal Marine recruits. Gait Posture. 2013;38(4):614–618.
- Akrami M, Craig K, Dibaj M, et al. A three-dimensional finite element analysis of the human hip. J Med Eng Technol. 2018;42(7):546–552.
- Gíslason MK, Nash DH, editors. Finite element modelling of a multi-bone joint: the human wrist. London (UK): InTechOpen; 2012.
- Garcia-Aznar JM, Bayod J, Rosas A, et al. Load transfer mechanism for different metatarsal geometries: a finite element study. J Biomech Eng. 2009;131(2):021011.
- Flavin R, Halpin T, O'Sullivan R, et al. A finite-element analysis study of the metatarsophalangeal joint of the hallux rigidus. J Bone Joint Surg Br. 2008;90(10):1334–1340.
- Chen WP, Tang FT, Ju CW. Stress distribution of the foot during mid-stance to push-off in barefoot gait: a 3-D finite element analysis. Clin Biomech (Bristol, Avon). 2001;16(7):614–620.
- Gu YD, Ren XJ, Li JS, et al. Computer simulation of stress distribution in the metatarsals at different inversion landing angles using the finite element method. Int Orthop. 2010;34(5):669–676.
- Akrami M. A large-scale subject-specific three-dimensional finite element model of the human foot musculoskeletal complex. Manchester (UK): University of Manchester; 2016.
- Day EM, Hahn ME. A comparison of metatarsophalangeal joint center locations on estimated joint moments during running. J Biomech. 2019;86:64–70. 2019/03/27/
- Morales-Orcajo E, Becerro de Bengoa Vallejo R, Losa Iglesias M, et al. Foot internal stress distribution during impact in barefoot running as function of the strike pattern. Comput Methods Biomech Biomed Eng. 2018;21(7):471–478.
- Lemmon D, Shiang TY, Hashmi A, et al. The effect of insoles in therapeutic footwear–a finite element approach. J Biomech. 1997;30(6):615–620.