
ABSTRACT
Measures of student satisfaction are commonly used to compare universities. Student satisfaction with higher education institutions in the UK is assessed yearly using the National Student Survey (NSS). The most recent revision of the NSS suggests that the satisfaction questions form eight different subscales. The aim of this research was to empirically test whether the NSS questions form eight separate subscales. We used the public data from the NSS from 2019 and clustering methods to examine the structure of the data. We tested the structure of the NSS questions when the data was analysed as a whole (i.e. at the ‘top’ national level across all universities and courses). We also assessed the clustering of data for 78 course subjects separately to see the most frequent number of clusters across courses (i.e. at the ‘bottom’ individual course level). At the top (national) level, we found a four cluster or two cluster solution (when excluding both an item on the student union and a general satisfaction item), rather than an eight cluster solution. At the bottom (course) level, the most common cluster solution was two clusters, but with considerable variation, ranging from one to eight clusters. Our findings thus suggest that there is considerable variation in the structure of the NSS and that this variation can depend on analytical level (top national level vs. bottom course level). We review the implications of differing cluster structures for how the NSS is used.
Introduction
There has been an increasing demand for comparative metrics measuring performance in higher education (e.g. Hazelkorn Citation2015). Student satisfaction is at the core of such metrics, and more broadly quality assurance in post-secondary higher education (Chung Sea Law Citation2010). For example, students from UK universities are asked to complete a standard survey evaluating their satisfaction with their university and course during the final year of their studies. This survey is called the National Student Survey (NSS). The NSS asks questions about numerous different aspects of the student’s experience at university and groups these into various subscales (e.g. the teaching on my course, learning opportunities, assessment and feedback, organisation and management, etc.).
The subscales from the NSS have important implications for higher education in the UK. The student’s responses to the different subscales contribute to university league tables (e.g. Guardian’s university guide). Therefore, higher ratings in specific NSS subscales may result in a university having a higher league table ranking. Given that these league tables may influence a student’s decision about where to study (Gibbons, Neumayer, and Perkins Citation2015), the NSS subscales may indirectly influence university applications. Moreover, universities may use the NSS subscales to alter their practices, teaching and governance (e.g. Brown Citation2011; Senior, Moores, and Burgess Citation2017). For example, if an institution or course has lower scores on a particular subscale (e.g. assessment and feedback), they may alter their practices to improve this particular element of the student’s experience. Given the potential impact of these subscales, it is important that they are reliable. Therefore, the purpose of this paper is to more closely examine how questions used in the NSS are grouped into subscales and whether these subscales are reliable across different units of analysis (e.g. across all university students versus across courses within an institution).
Reliability of the National Student Survey (NSS)
The NSS was initially developed in 2005 and has been completed by students on a yearly basis since this date. The initial survey was developed from a larger pool of 45 items and the final version yielded 21 items. These 21 items in the NSS were initially grouped in six subscales; teaching (e.g. ‘Staff are good at explaining things’); assessment and feedback (e.g. ‘Assessment arrangements and marking have been fair’); academic support (e.g. ‘I have received sufficient advice and support with my studies’); organisation and management (e.g. ‘ The course is well organised and is running smoothly’); resources (e.g. ‘I have been able to access general IT resources when I needed to’); and personal development (e.g. ‘The course has helped me to present myself with confidence’).
Research has found some support for the proposed six-subscale structure of the data (Richardson, Slater, and Wilson Citation2007). For example, initial assessment of the data found there to be some support for this model in suggesting there were between five and seven factors (Richardson Citation2005). Moreover, an analysis focussing on science subjects supported seven factors (Fielding, Dunleavy, and Langan Citation2010). The authors then reduced these to the six factors, in line with the NSS as developed. Importantly, a more recent analysis has found some support for this six-factor solution (Burgess, Senior, and Moores Citation2018) and a translation and validation study into Portuguese also supported a six factor structure (Martins et al. Citation2019). Further research also demonstrates that the items within each subscale form a reliable measure (Bowles, Sharkey, and Day Citation2020). Therefore, this research suggested that there was general support for the six NSS subscales, but there was some variation in the exact number of subscales (or factors) extracted between the different studies.
Importantly, the NSS survey has been enhanced and developed since it was first introduced to ensure that it meets the changing nature of higher education in the UK (HEFCE Citation2014). After undertaking pilot studies (HEFCE Citation2015, Citation2016), the NSS items were revised in 2017 and more items were included. Eight factors were proposed, clustered as follows: The teaching on my course (e.g. ‘Staff are good at explaining things’), Learning opportunities (e.g. ‘My course has provided me with opportunities to explore ideas or concepts in depth’), Assessment and feedback (e.g. ‘The criteria used in marking have been clear in advance’), Academic support (e.g. ‘I have been able to contact staff when I needed to’), Organisation and management (e.g. ‘The course is well organised and running smoothly’), Learning resources (e.g. ‘The IT resources and facilities provided have supported my learning well’), Learning communities (e.g. ‘I feel part of a community of staff and students’), and Student voice (e.g. ‘I have had the right opportunities to provide feedback on my course’). These were supplemented with two questions relating to the Student Union (‘Q26’: ‘The students’ union (association or guild) effectively represents students’ academic interests’) and Overall satisfaction (‘Q27’: ‘Overall, I am satisfied with the quality of the course’), respectively. It should be noted that in 2017, the student union question (‘Q26’) was grouped with student voice questions (‘Q23’ – ‘Q25’; HEFCE Citation2016). The items and proposed clusters can be found in Appendix .
Given that the revision to the NSS is relatively new, there has been less research assessing the reliability of the scales. However, there have been some preliminary tests of the reliability of the post-2017 NSS data. For example, smaller-scale pilot research analysed the data on a holistic level across a variety of courses and found support for the proposed eight NSS subscales (HEFCE Citation2015, Citation2016). Therefore, there is some support for the NSS subscales, albeit from smaller-scale research. There has been some more recent research looking at the reliability of the post-2017 NSS data, but this assessed the reliability of the NSS survey as a whole (i.e. as a single scale), rather than looking at individual subscales (Satterthwaite and Vahid Roudsari Citation2020). Therefore, further research is needed to assess the reliability of the revised NSS subscales. Given that the revised NSS survey has been implemented, large-scale data are available for a variety of courses and institutions. These existing data could be used to provide a strong test of the proposed eight NSS subscales at different analytical levels.
Different strategies can be used to analyse the reliability of the subscales using the available existing NSS data. For example, the simplest form of analysis is to take a holistic approach and combine the data from a variety of institutions and courses. This top level of analysis has been used previously to look at the reliability of the subscales across a variety of subjects and courses (e.g. HEFCE Citation2016). This is a useful strategy for providing a general overview of the reliability of the NSS subscales as a whole. However, this approach could cause some issues. From a psychometric point of view (e.g. Nunnally Citation1978), relying on aggregate scales could be problematic as it presupposes that the underpinning items do in fact form a coherent scale, across different analytical levels. For example, in the context of the NSS, it may be the case that the data may fit the proposed eight-factor solution at the national level (i.e. the top level), but may not fit this eight-factor solution for some individual courses (i.e. the bottom level). If such courses then make changes to their practices based on the scores from specific NSS subscales, these changes could be based on unreliable data.
There is some indirect support for the idea that the structure of the data may vary between institutions and courses. Indeed, research has found variability in the number of feedback questions that were associated with overall satisfaction (Fielding, Dunleavy, and Langan Citation2010). These researchers found that there were subjects were overall satisfaction was predicted by none (e.g. Biological Sciences), one (e.g. Human Geography), two (e.g. Mathematical Sciences) and all three of the feedback questions (e.g. Physical Sciences). Given that the association between questions within the NSS varied based on the subject under investigation, it suggests that there is a possibility that the structure of the NSS subscales may vary across subject areas. Moreover, research has also argued that the interpretation of items may vary between students, whereby highly-engaged students base evaluations of teaching on being intellectually stimulated and less-engaged students base this on staff enthusiasm (Bennett and Kane Citation2014). Although student engagement is likely to vary within a course, it is possible that it may vary between courses and institutions as well. This may mean that the criteria that students use to answer the NSS question may vary between institutions and courses. The potential presence of this variation could mean that the structure of NSS subscales may change between courses and institutions. Therefore, given that the association between NSS questions varies between subjects and that there may be variation in how students answer the questions between courses and institutions, there is a possibility that even if the eight-factor structure fitted the top level data (i.e. combining all courses and institutions at a national level), there may be differences in the structure between individual courses. Therefore, it is also important to also assess whether the proposed eight subscales are found when analysing the data for individual courses. Analysing the data at this bottom level of analysis provides a valuable insight into the reliability of the NSS subscales. If the NSS subscales are reliable, the proposed eight subscales should be present for the vast majority of courses.
Despite the importance of assessing the NSS subscales for individual courses, to our knowledge there has been little research determining the reliability of the subscales at this bottom level. Given that course-level data may be used to adapt practices, it is important to ensure the subscales are reliable at this lowest level of analysis. Moreover, assessing whether the proposed eight subscales are present at both the national level and on the majority of individual courses provides a strong test of the reliability of the NSS subscales. Based on this, our aim is to examine whether we can recover the eight proposed question clusters. Importantly, we examined this clustering at both the top (national) level and at both the bottom (course) level. This allowed us to assess the overall structure of the survey at different levels, and to determine the compatibility between the structure at these different levels. The purpose of our paper is not to evaluate the psychometrics of the NSS in its entirety, but rather to start with a smaller goal: are we able to recover the proposed structure in the NSS 1) as a whole to demonstrate the structure of the data at the (top) national level and 2) for individual courses to demonstrate the structure at the (bottom) course level?
Methods
The data are publicly available from the National Student Survey website.Footnote1 We used the data from the 2019 wave, as the data from the 2020 wave were still being collected at the inception of this study and COVID19 might have impacted the results. The NSS website contains detailed information on how the survey is advertised, how data were collected, the response rates and other methodological aspects, which are beyond the scope of our paper.
We present results across all the data (‘top level’), but also present separate analyses whereby we selected all individual subject courses for which we deemed that sufficient data were available (‘bottom level’). Based on the heuristic that 10 participants are needed per variable (Harrell Citation2001), samples of 270 or greater would be needed to account for the 27 questions within the NSS. There were 80 courses satisfying this criterion (lowest level of analysis possible in the public data, ‘bottom level’). The largest proportion of subjects comprised Business Studies (n = 18 out of 80), but there were courses from across the humanities (e.g. History) and STEM subjects (e.g. Mathematics). The Open University represented the largest proportion of providers (n = 8 out of 80) but there was a representation from both post-92 Universities (i.e. converted polytechnic colleges; e.g. Northumbria University, Liverpool John Moores University) and universities from the Russell group (e.g. Durham University, University of Warwick), an association of 24 leading UK universities. Similarly, there was geographical variation and universities from Wales and Northern Ireland were also included in this sample.
Data analysis
All the analyses were conducted in R 4.0.2 (R Development Core Team Citation2008). The data, code, and analysis document are available from the Open Science Framework (OSF).Footnote2 Clustering methods allow researchers to reduce the complexity in their data (Xu and Wunsch Citation2008). In our case, clustering is based on the frequencies to each response category for each of the 27 questions. One straightforward way to do so is via K-means clustering (MacQueen Citation1967). Simply put, this method works by partitioning the data in such a way that each observation is allocated into k clusters. Using an algorithmic approach, the goal is to minimise the Euclidean distance to each centre of a proposed cluster. A variety of methods have been proposed to find a solution to identifying the optimal number of clusters. We use the ‘NBclust’ package to examine a large array of clustering methods based on Euclidean Distances (Charrad et al. Citation2014). This approach allowed us to simultaneously evaluate 27 different clustering methods for the data. Due to space constraints we do not discuss these, but see Charrad et al. (Citation2014) for an exhaustive discussion of the methods used. Following best practice, we then rely on the majority rule to determine the optimal number of clusters proposed for the data (i.e. the mode, the number which appears most often in the set). We then explore these clusters further and visualise these (Kassambara and Mundt Citation2017). It is important to note that clusters can contain just a single element, thus in our case allowing for a single item to be on its own (e.g. ‘Q27’, general satisfaction).
Our analysis document also contains further analyses (e.g. X-means clustering, Pelleg and Moore Citation2000; Jain Citation2010; but also exploratory factor analyses, implemented via the ‘psych’ package, Revelle Citation2016) and robustness checks not reported here. The choice of analysis level can lead to different conclusions – as mentioned above, we focussed on the ‘top level’ and the ‘bottom level’ of analysis. However, our code can also be easily amended to conduct similar analyses but grouped at subject course or university level, for example.
Results
Heat Map and Pearson correlation matrices
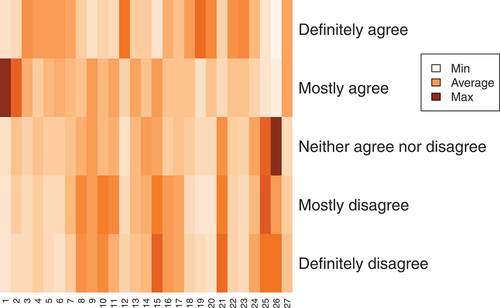
There were between 366,424 (‘Q26’) and 386,683 (‘Q15’) responses to each question. It is important to note that response rates differ by less than 5.5%, therefore response bias is unlikely to strongly impact our results at aggregate level. shows a heat map based on the response frequencies. The question on Overall satisfaction (‘Q27’) demonstrates that students are generally positive. The question on the student union (‘Q26’) shows that the responses to this question are somewhat more negative.
Figure 1. Heat map based on frequencies.
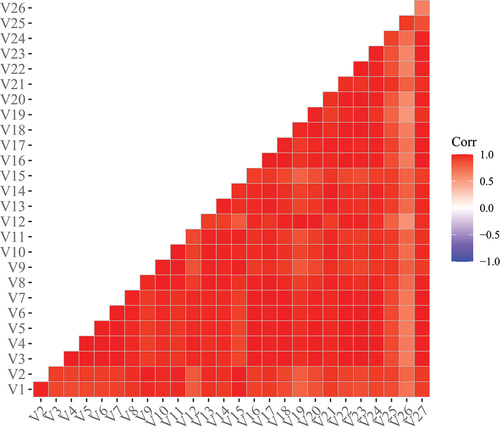
demonstrates the Pearson correlations of the aggregated data. It is clear that all variables correlate moderately to very strongly. The weakest correlations are with ‘Q26’ (The students’ union (association or guild) effectively represents students’ academic interests). Note that this is also the question with the lowest response rate.
Figure 2. Heat map with aggregated correlations for each of the 27 variables.
Clustering
Top level analysis – all data
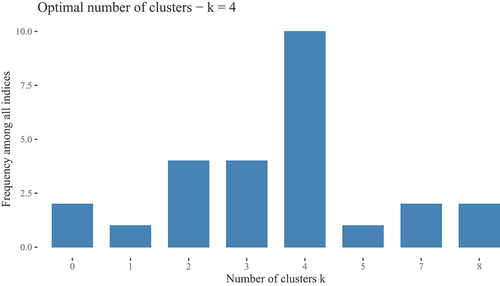
Twenty-seven clustering methods were evaluated but one failed to converge leaving 26 cluster solutions to be evaluated. The frequency distribution is summarised in . Incidentally, removing the general satisfaction question, also led to a four cluster solution (see OSF). shows the distribution of the cluster solutions, when the general satisfaction is excluded.
Figure 3. Frequency distribution for optimum clustering.
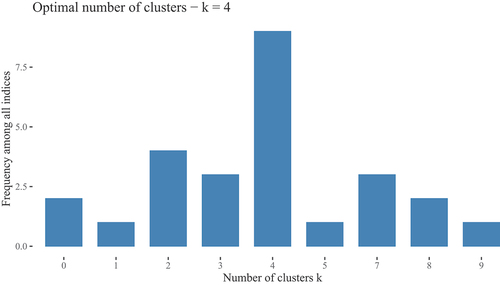
Figure 4. Frequency distribution for optimum clustering (without general satisfaction item, ’Q27’).
Next, we used K-Means clustering to visualise the proposed structure for a four cluster solution. displays the four clusters in two dimensions. The largest cluster is in pink. This cluster contains all items on Learning Opportunities (‘Q5’ to ‘Q7’), but it also contains a myriad of other items (e.g. Items relating to Organisation and management (‘Q16’,‘Q17’), but also items relating to Student Voice, ‘Q23’ and ‘Q24’). It also contains the overall satisfaction question (Q27). It is difficult to label this cluster but we propose to label it as general satisfaction, given that it contains the satisfaction item and likely the items in this cluster are closely related to general satisfaction. The second largest cluster is in green. It contains all items relating to Assessment and feedback (’Q8 to Q11”). However, this cluster also contains some items for Teaching on my course (‘Q1’ and ‘Q2’), Academic support (‘Q13’ and ‘Q14’), and organisation and assessment (‘Q15’). What seems to connect most of these items is that they tend to relate to staff, we refer to this factor as ‘Staff’. The two remaining clusters, purple and orange, were smaller. The purple cluster contains two items from Learning resources (‘Q19-Q20’: ‘The library resources (e.g. books, online services and learning spaces) have supported my learning well’ and ‘I have been able to access course-specific resources (e.g. equipment, facilities, software, collections) when I needed to’) and one item relating to academic support (‘Q12’: ‘I have been able to contact staff when I needed to’). We tentatively label this cluster as ‘Resources’. The orange cluster contains a question on the student union (‘Q26’) and is grouped with one item on Student Voice (‘It is clear how students’ feedback on the course has been acted on’), and one item relating to Learning community (‘I feel part of a community of staff and students’). We tentatively label this cluster as ‘Community’.
Figure 5. Proposed clustering based on K-means clustering. Numbers correspond to NSS question numbers.
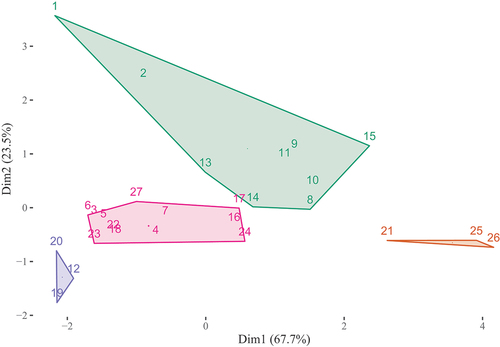
Importantly, the proposed clustering is quite clearly different for some of the proposed structures. For example, the items related Teaching on my course (‘Q1’ to ‘Q4’) are divided over separate clusters.
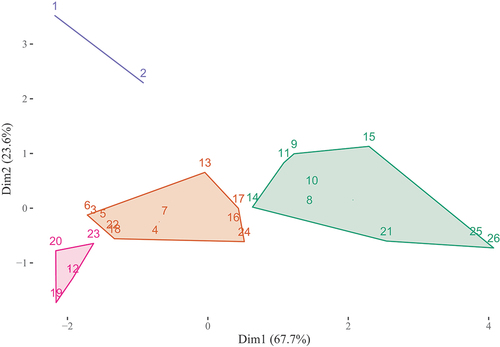
It could be argued that we did not find the proposed structure because we included the overall satisfaction item in our analysis. This is unlikely as individual items could also fail to clearly cluster with other items. Nonetheless, we repeated the analysis with this item removed (details on OSF). illustrates the four cluster structure when the general satisfaction item is excluded. The clusters identified are different from above, which is to be expected. However, upon closer inspection it shows that the spatial layout is quite similar, it is just that the clustering method has drawn different boundaries. For example, again, the items related Teaching on my course (‘Q1’ to ‘Q4’) are divided over separate clusters. Also, we again find that the clustering is quite different from the proposed structure.
Figure 6. Proposed clustering based on K-means clustering (without ’Q27’ relating to general satisfaction). Numbers correspond to NSS question numbers.
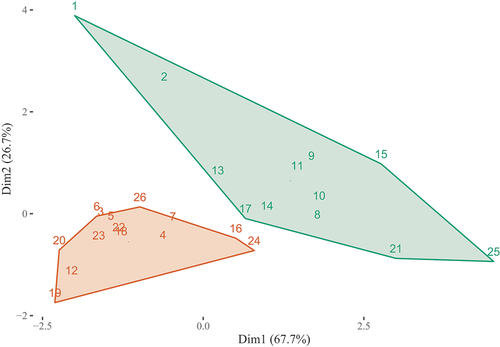
One could also argue that the item relating to the student union ‘Q26’ should similarly be excluded (but note that it is spatially very close to ‘Q25’, suggesting that it does align with ‘Student voice’ and it was initially conceived to be part of student voice). When repeating the exercise with exclusion of ‘Q26’ and ‘Q27’, we find a two cluster solution (), rather than a four cluster solution. However, the spatial layout of the items is quite similar to , but we now end up with fewer clusters. Importantly, this structure does not clearly align with the proposed eight cluster solution. For example, the items related Teaching on my course (‘Q1’ to ‘Q4’) are again divided over separate clusters.
Figure 7. Proposed clustering based on K-means clustering (without ’Q26’ relating to the student union and ’Q27’ relating to general satisfaction). Numbers correspond to NSS question numbers.
Bottom level analysis – specific course subjects
For two courses there were convergence issues and optimal clustering for the 27 clustering methods could not be determined. The frequency distribution for the optimal clusters for the remaining 78 courses are shown in . The most common proposed number of clusters is 2 (32 out of 78). Yet, there is considerable variability, with 22 out of 78 subjects having a cluster solution of 3 and 15 out of 78 subjects having a cluster solution of 1. For only 1 out of 78 subject courses the majority rule suggested eight clusters, but the structure does not align with the proposed clusters (see OSF). What is clear, however, is that depending on the course one would end up with very different groupings (1, 2 or 3 clusters) and that these groupings do not align clearly with the proposed division into eight clusters.
Figure 8. Frequency distribution of optimal clusters for 78 course subjects.
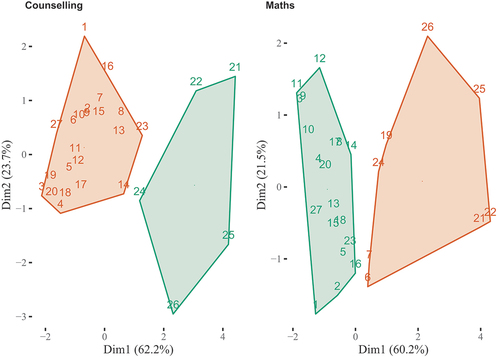
Even if the same number of clusters is proposed, we can have quite different groupings. We illustrate this in , with two courses from the Open University (Counselling, psychotherapy and occupational therapy (‘counselling’) and Mathematics), for which there is a two cluster solution. While there is some overlap (e.g. ‘Q21’, ‘Q22’, ‘Q24’, ‘Q25’, ‘Q26’ feature in both clusters 2), there are also notable differences. For example, two items from ‘Learning opportunities’ (‘Q6’ and ‘Q7’) are part of the second cluster for Mathematics but are not included in cluster 2 for counselling. Mathematics’ second cluster also includes ‘Q19’ (‘The library resources (e.g. books, online services and learning spaces) have supported my learning well’). Perhaps more problematic is that these two clusters bear little resemblance with the proposed eight clusters.
Figure 9. Illustration of two cluster structure in two Open University courses. Numbers correspond to NSS question numbers.
Discussion
The NSS is an important assessment tool in higher education in the UK. In this study, we aimed to determine the structure of these data. We found variability in the structure of the NSS data, depending on the level of analysis. At the top (national) level, we found a four cluster solution for this data, which we labelled as General Satisfaction, Staff, Resources, and Community. Even though we found a two cluster solution when we excluded both the item about the student union (‘Q26’) and the general satisfaction item (‘Q27’), positions of individual items corresponded largely to the previously documented four cluster solution. At the bottom (course) level of analysis, we found that the number of clusters varies across different courses. A two cluster solution was most common among courses. However, there was also a substantial number of courses that contained either one or three clusters. Therefore, at both the national and course level, we do not find substantial support for the proposed eight-cluster solution.
It should be noted that some research has found support for the structure proposed by the NSS. For example, prior to the revision of the NSS in 2017, numerous studies found some support for the six-factor solution (Fielding, Dunleavy, and Langan Citation2010; Richardson Citation2005; Richardson, Slater, and Wilson Citation2007). We may have found different results than these studies for numerous reasons. For example, we analysed data from the post-2017 NSS, which contained more items. The inclusion of these items may have altered the structure of the data. Also there are differences in the order and content of items (Office for Students Citation2020b), which might have affected the structure. Moreover, much of this work was undertaken on early NSS data. Recent research suggests that there has been a general rise in NSS results over the years leading to a ceiling effect (Burgess, Senior, and Moores Citation2018; Langan and Harris Citation2019). This general rise in satisfaction over the years and ceiling effect may make it more difficult to differentiate between the different factors in the 2019 data that we used for this analysis. However, these ideas cannot explain why we found different results from more recent research (HEFCE Citation2016). One possible reason for this is that the solution that is found may depend on the way that the analysis is undertaken. For example, we found differences in the results when we analysed the data at the national and course level. Similarly, we found slight differences depending on whether or not the satisfaction item and student union item were included into the analyses. There may also be other differences that occur depending on the analysis strategy. The solution may vary depending on a) whether the number of solutions is determined based on a-priori assumptions or statistical techniques, b) the courses that were included in the analysis, or c) whether primary data is used rather than the secondary data available on the NSS website. However, the fact that the solution may vary based on the type of analysis suggests that further research is needed to assess the reliability of the proposed clustering of questions.
Limitations and future research
It is important to consider the limitations of this study. There is probably a large number of ways in which one could divide up the NSS data. For example, one could repeat the clustering exercise which we performed by course subject (ignoring that they are clustered within universities) or by university (ignoring clustering by subject), or by geography (clustering by country or, for example, by metropolitan area). As is already clear from our analysis, the choice of the level analysis will impact the answer one gets (e.g. Simpson Citation1951; Robinson Citation1950). There is likely no ‘correct’ answer as to which level of analysis is best-suited, as that will depend on the unit of analysis (e.g. within a university comparing subjects, versus comparing universities within a region). However, what is clear, at least in our analysis, is that there is no consistent structure in line with the proposed eight cluster structure at the aggregate level or course subject level. It is possible that at the level of the individual respondent yet a different pattern arises, but note that these data are not public. More importantly, what is fed forward in metrics is usually based on some aggregate level, rather than at the individual level.
It is important to bear in mind that we have only investigated one aspect of measurement in the NSS. There are a whole host of other research questions which need to be addressed to ensure that the NSS scales are valid and reliable (e.g. Anastasi Citation1976; Borsboom Citation2005; Finch and French Citation2018). For example, a common measure for reliability is the test-retest correlation of items: do participants respond to the items of a scale in a similar fashion, when they retake a scale three months later, for example. Future research assessing test-retest reliability of the NSS subscales would be valuable. Another aspect which needs to be considered is measurement invariance (e.g. Meredith Citation1993). Comparisons between groups are only valid if we are able to reliably recover the same psychological constructs in each group. This is a well-known issue in cross-cultural measurement (e.g. Milfont and Fischer Citation2010), but perhaps lesser known in the context of Higher Education. In order to be able to directly compare universities or courses, we thus need to be sure that the same structure is underpinning each of those. This is typically established via multigroup structural equation modelling (e.g. Mair Citation2018). Our preliminary exploration via cluster analysis suggests that there likely is wide variation in the dimensional structure at course level. However, further work is necessary to establish the potential impact on metrics as they are used. Moreover, an ‘ideal’ measure should exhibit invariance across a whole range of relevant grouping variables (e.g. gender, age, ethnicity, full time vs. part time students, studying at post-92 versus Russell group university, studying STEM vs. humanities subjects). Although there is some work assessing this (e.g. Richardson, Slater, and Wilson Citation2007), we call for more work demonstrating that the NSS consistently demonstrates the same structure across a large number of groupings.
Another important consideration is the consistency of the data year-on-year. Previous research using early NSS data found consistency in university ranking across years (Cheng and Marsh Citation2010). However, it is also important to assess the consistency in the clustering year-on-year. We conducted our analyses on the data from a single year. From these data, we showed variation in the structure of the data depending on the level of analysis, and that the cluster solution may vary between courses. It is possible that the solution for the national data and the course-level data may be consistent from year-to-year. However, it is also possible that both these solutions may vary each year. It was beyond the scope of this research to assess the reliability of these solutions across the number of years. Instead, we focused on the general reliability of the solution at both the national and course level. However, it is important for future research to determine the extent to which these solutions are reliable from year-to-year. This will allow universities to determine whether improving one cluster is likely to be effective in subsequent years.
Practical implications
The NSS data underpin important metrics that are used in numerous ways. Indeed, the data are included in university league tables (e.g. Guardian university guide) and university assessments into teaching standards (i.e. the TEF). The data are also used within universities to improve the student experience at both the institutional and course level. Students may also use this data to determine where they wish to study (Gibbons, Neumayer, and Perkins Citation2015). Given this, it is important to consider how these data can be used effectively. This study suggests that using the aggregated data may be problematic. Indeed, we found discrepancies between the implicit solution that is often applied and our data. At the national (top) level analysis, we found either a four or two cluster solution, rather than the proposed eight cluster solution. Moreover, the exact nature of these clusters varied depending on the analysis that was undertaken (i.e. whether the overall satisfaction and/or student union items were included in the analysis). This discrepancy from the frequently applied solution and the variation based on the type of analysis suggests that the aggregated data should be used with caution.
We also found that the solution varied between institutions at course level. Although a two cluster solution was most common, there were a substantial number of courses where the data produced either a single cluster or three cluster solution. This suggests that comparisons between courses based on the aggregated data structure may be problematic. Moreover, our illustration between two courses within the same university suggests that even comparisons between courses within the same institution may be difficult. This is not the first study to suggest that comparisons using the NSS data should be interpreted with caution. For example, researchers have suggested that as students with approaches to learning vary in their interpretation of the questions, comparing different subjects and institutions is especially difficult (Bennett and Kane Citation2014). Here, we add to this argument by suggesting that comparisons based on the aggregate data may be difficult as the structure of these data varies between courses.
Issues with the NSS have been raised by academics (Bell and Brooks Citation2018; Lenton Citation2015; Sabri Citation2013; Senior, Moores, and Burgess Citation2017; Yorke Citation2009) and government bodies (Department for Business, Energy & Industrial Strategy, & Department for Education Citation2020). However, it is important to note that we are not questioning the usefulness of the NSS survey. Indeed, the NSS has numerous strengths. These strengths include a substantial rise in overall student satisfaction across the board (Burgess, Senior, and Moores Citation2018; Langan and Harris Citation2019), high response rates (Office for Students Citation2020a), and reducing the burden on universities to collect data on satisfaction (Office for Students Citation2021). Instead, we argue that it is important to carefully consider the use of the aggregate data. If the aggregate data are used to inform policy decisions at course level, it is important to determine whether the structure of the data at the course level is indeed similar, before implementing changes to courses. Alternatively, an individual-item approach could be used rather than the proposed clustered scales. For example, recent research has demonstrated the effectiveness of using individual-item approaches to identify strategies for improving overall satisfaction (Langan and Harris Citation2019; Satterthwaite and Vahid Roudsari Citation2020). Moreover, text comments from the NSS are also used to consider how changes could be made to improve practice (Langan et al. Citation2017), which could be considered as another type of individual approach. As such, individual-item and respondent based approaches can be used effectively to enhance the student experience following feedback from the NSS.
Conclusion
It is important to ensure that the proposed NSS subscales are reliable. Our analyses suggest that clustering of such items into scales is likely ambiguous and we have demonstrated other groupings than the proposed eight dimensions. At the top (national) level, we found the questions were clustered into two or four clusters, depending on the analytical approach. Similarly, at the bottom (individual course) level there was a wide range in the number of clusters, with two clusters being most common among courses. The subscales within the NSS are an important metric for UK universities. These subscales are included into university league tables. These league tables are used by students to determine where to study. As such, the NSS may influence university applications. Moreover, institutions and courses may alter their practices based on the results of the NSS. Given that the data did not show support for the proposed eight subscales, it is important to carefully consider how the NSS is used by league tables and institutions. The proposed aggregated data may not fit the structure of the data for students on a particular course. As such, the use of the proposed subscales may be problematic. Instead, we argue that it may be useful to focus on the individual items. Moreover, given these findings, we call for further research to test the validity and reliability of the NSS clusters.
Disclosure statement
No potential conflict of interest was reported by the author(s).
Additional information
Notes on contributors
Thomas V. Pollet
Thomas V. Pollet obtained his Ph.D. at Newcastle University (UK). He has since worked as Assistant professor at the University of Groningen (the Netherlands) in the department of Evolutionary Social Psychology where he taught several courses on evolution and human behaviour. He was also employed as Assistant Professor at the VU University Amsterdam (Social and Organisational Psychology) where he carried out teaching and research using an evolutionary framework. From November 2016 to July 2017 he worked for Universiteit Leiden. In July 2017, he took up a post as Associate Professor (Reader) with Northumbria University, where he was promoted to Professor in September 2020.
His research focuses on understanding the wealth of social relationships people have (e.g., romantic relationships, friendships, family relationships) and understanding the role of individual differences (e.g., personality, height, hormones, …) for these social relationships from an interdisciplinary framework. To this end, he conducts survey, observational, and experimental studies, next to analysing secondary datasets. Furthermore, he is interested in (improving) methodology and statistics and frequently collaborates with others on diverse topics.
Lee Shepherd
Lee Shepherd completed an ESRC funded PhD at Cardiff University, assessing the role of (anticipated) emotions in promoting prosocial intergroup behaviour. He subsequently worked as a Research Fellow at the University of Stirling, before coming to Northumbria University, where he is a Senior Lecturer.
His research focuses on the role of emotions on human behaviour using advanced statistics. He is currently investigating the role of emotions on group-processes (e.g., discrimination and collective action) and health-related behaviours (e.g., organ donation, human milk donation, breastfeeding, sexual health screening, cervical screening). In addition, he is interested in studying people’s emotional response to experiencing discrimination. He also undertakes research looking at how emotions and group processes influence psychological well-being.
Notes
References
- Anastasi, A. 1976. Psychological Testing. 4th ed. New York, NY: Macmillan.
- Bell, A. R., and C. Brooks. 2018. “What Makes Students Satisfied? A Discussion and Analysis of the UK’s National Student Survey.” Journal of Further and Higher Education 42 (8): 1118–1142. doi:10.1080/0309877X.2017.1349886.
- Bennett, R., and S. Kane. 2014. “Students’ Interpretations of the Meanings of Questionnaire Items in the National Student Survey.” Quality in Higher Education 20 (2): 129–164. doi:10.1080/13538322.2014.924786.
- Borsboom, D. 2005. Measuring the Mind: Conceptual Issues in Contemporary Psychometrics. Cambridge, UK: Cambridge University Press.
- Bowles, D., G. Sharkey, and C. Day. 2020. “Psychological Predictors of National Student Survey Course Satisfaction.” Journal of Perspectives in Applied Academic Practice 8 (2): 7–15. doi:10.14297/jpaap.v8i2.423.
- Brown, S. 2011. “Bringing about Positive Change in the Higher Education Student Experience: A Case Study.” Quality Assurance in Education 19 (3): 195–207. doi:10.1108/09684881111158027.
- Burgess, A., C. Senior, and E. Moores. 2018. “A 10-year Case Study on the Changing Determinants of University Student Satisfaction in the UK.” PloS One 13 (2): e0192976. doi:10.1371/journal.pone.0192976.
- Charrad, M., N. Ghazzali, V. Boiteau, and A. Niknafs. 2014. “NbClust: An R Package for Determining the Relevant Number of Clusters in a Data Set.” Journal of Statistical Software 61 (6): 1–36. doi:10.18637/jss.v061.i06.
- Cheng, J. H. S., and H. W. Marsh. 2010. “National Student Survey: Are Differences between Universities and Courses Reliable and Meaningful?” Oxford Review of Education 36 (6): 693–712. doi:10.1080/03054985.2010.491179.
- Chung Sea Law, D. 2010. “Quality Assurance in Post‐secondary Education: The Student Experience.” Quality Assurance in Education 18 (4): 250–270. doi:10.1108/09684881011079125.
- Department for Business, Energy & Industrial Strategy, & Department for Education. 2020. “Reducing Bureaucratic Burden in Research, Innovation and Higher Education.” Accessed 20 April 2021. https://www.gov.uk/government/publications/reducing-bureaucratic-burdens-higher-education/reducing-bureaucratic-burdens-on-research-innovation-and-higher-education
- Fielding, A., P. J. Dunleavy, and A. M. Langan. 2010. “Interpreting Context to the UK’s National Student (Satisfaction) Survey Data for Science Subjects.” Journal of Further and Higher Education 34 (3): 347–368. doi:10.1080/0309877X.2010.484054.
- Finch, W. H., and B. F. French. 2018. Educational and Psychological Measurement. London, UK: Routledge.
- Gibbons, S., E. Neumayer, and R. Perkins. 2015. “Student Satisfaction, League Tables and University Applications: Evidence from Britain.” Economics of Education Review 48: 148–164. doi:10.1016/j.econedurev.2015.07.002.
- Harrell, F. E. 2001. Regression Modeling Strategies. New York, NY: Springer New York. doi:10.1007/978-1-4757-3462-1.
- Hazelkorn, E. 2015. Rankings and the Reshaping of Higher Education: The Battle for World-class Excellence. 2nd ed. New York, NY: Springer.
- HEFCE (Higher Education Funding Council for England). 2014. “Review of the National Student Survey.” Accessed 22 April 2021. https://natcen.ac.uk/media/457944/nss-review-summary.pdf
- HEFCE (Higher Education Funding Council for England). 2015. “UK Review of Information about Higher Education: Results and Analysis for the 2015 Pilot of the National Student Survey.” https://dera.ioe.ac.uk/24462/1/HEFCE2015_25.pdf
- HEFCE (Higher Education Funding Council for England). 2016. “Review of Information about Learning and Teaching, and the Student Experience - Results and Analysis of the 2016 Pilot of the National Student Survey.” https://dera.ioe.ac.uk/27588/1/HEFCE2016_27.pdf
- Jain, A. K. 2010. “Data Clustering: 50 Years beyond K-means.” Pattern Recognition Letters 31 (8): 651–666. doi:10.1016/j.patrec.2009.09.011.
- Kassambara, A., and F Mundt. 2017. “Package “Factoextra”.” https://rpkgs.datanovia.com/factoextra/index.html
- Langan, A. M., and W. E. Harris. 2019. “National Student Survey Metrics: Where Is the Room for Improvement?” Higher Education 78 (6): 1075–1089. doi:10.1007/s10734-019-00389-1.
- Langan, A. M., N. Scott, S. Partington, and A. Oczujda. 2017. “Coherence between Text Comments and the Quantitative Ratings in the UK’s National Student Survey.” Journal of Further and Higher Education 41 (1): 16–29. doi:10.1080/0309877X.2014.1000281.
- Lenton, P. 2015. “Determining Student Satisfaction: An Economic Analysis of the National Student Survey.” Economics of Education Review 47: 118–127. doi:10.1016/j.econedurev.2015.05.001.
- MacQueen, J. 1967. “Some Methods for Classification and Analysis of Multivariate Observations.” In L. Lecam and J. Neyman (Eds.), Proceedings of the fifth Berkeley symposium on mathematical statistics and probability (Vol. 14, pp. 281–297). Berkeley, CA: UCLA Press.
- Mair, P. 2018. Modern Psychometrics with R. New York, NY: Springer International Publishing.
- Martins, M. J., T. R. Marques, I. Laíns, I. Leal, I. Pessanha, B. Brochado, … J. T. E. Richardson. 2019. “The National Student Survey: Validation in Portuguese Medical Students.” Assessment & Evaluation in Higher Education 44 (1): 66–79. doi:10.1080/02602938.2018.1475547.
- Meredith, W. 1993. “Measurement Invariance, Factor Analysis and Factorial Invariance.” Psychometrika 58 (4): 525–543. doi:10.1007/BF02294825.
- Milfont, T. L., and R. Fischer. 2010. “Testing Measurement Invariance across Groups: Applications in Cross-cultural Research.” International Journal of Psychological Research 3 (1): 111–130. doi:10.21500/20112084.857.
- Nunnally, J. C. 1978. Psychometric Theory. New York: McGraw-Hill.
- Office for Students. 2020a. “National Student Survey 2020: Analysis of the Impact of the Coronavirus Pandemic.” https://www.officeforstudents.org.uk/media/659497ab-d2aa-4b1f-9b84-fdd4e65dfb6b/nss-2020-analysis-of-impact-of-coronavirus-pandemic.pdf
- Office for Students. 2020b. “The National Student Survey: Consistency, Controversy and Change.” Accessed 9 April 2021. February 19. https://www.officeforstudents.org.uk/publications/the-national-student-survey-consistency-controversy-and-change/
- Office for Students. 2021. “NSS Review Phase One Report.” https://www.officeforstudents.org.uk/media/b6ad8f44-f532-4b55-aa32-7193497ddf92/nss-review-phase-1-report.pdf
- Pelleg, D., and A. W. Moore. 2000. “X-means: Extending K-means with Efficient Estimation of the Number of Clusters.” In Proceedings of the 17th International Conference on Machine Learning, 727–734. http://citeseerx.ist.psu.edu/viewdoc/summary?
- R Development Core Team. 2008. R: A Language and Environment for Statistical Computing. Vienna, Austria: R foundation for statistical computing. https://www.r-project.org/
- Revelle, W. 2016. “Psych: Procedures for Personality and Psychological Research.” https://CRAN.R-project.org/package=psych
- Richardson, J. T. E. 2005. “National Student Survey: Interim Assessment of the 2005 Questionnaire.” https://dera.ioe.ac.uk/5860/1/rd20_05.pdf
- Richardson, J. T. E., J. B. Slater, and J. Wilson. 2007. “The National Student Survey: Development, Findings and Implications.” Studies in Higher Education 32 (5): 557–580. doi:10.1080/03075070701573757.
- Robinson, W. S. 1950. “Ecological Correlations and the Behavior of Individuals.” American Sociological Review 15 (3): 351–357. doi:10.2307/2087176.
- Sabri, D. 2013. “Student Evaluations of Teaching as “Fact-totems”: The Case of the UK National Student Survey.” Sociological Research Online 18 (4): 148–157. doi:10.5153/sro.3136.
- Satterthwaite, J. D., and R. Vahid Roudsari. 2020. “National Student Survey: Reliability and Prediction of Overall Satisfaction Scores with Special Reference to UK Dental Schools.” European Journal of Dental Education 24 (2): 252–258. doi:10.1111/eje.12491.
- Senior, C., E. Moores, and A. P. Burgess. 2017. ““I Can’t Get No Satisfaction”: Measuring Student Satisfaction in the Age of a Consumerist Higher Education.” Frontiers in Psychology 8: 980. doi:10.3389/fpsyg.2017.00980.
- Simpson, E. H. 1951. “The Interpretation of Interaction in Contingency Tables.” Journal of the Royal Statistical Society. Series B (Methodological) 13 (2): 238–241. doi:10.1038/168063d0.
- Xu, R., and D. Wunsch. 2008. Clustering. New York, NY: John Wiley & Sons.
- Yorke, M. 2009. ““Student Experience” Surveys: Some Methodological Considerations and an Empirical Investigation.” Assessment & Evaluation in Higher Education 34 (6): 721–739. doi:10.1080/02602930802474219.
Appendix
Table A1. Questions of the NSS 2017 version (from HEFCE Citation2016).