
Abstract
Over the last number of years, there has been an increased move towards attending to the social and emotional wellbeing of students in Irish post-primary schools. Several studies have indicated that educators’ positive attitudes toward health and wellbeing education are crucial to achieving whole-school implementation in terms of the promotion of student wellbeing. However, as of yet, no test instrument exists that is designed to quantify the attitudes of educators in this regard. This study aimed to develop a test instrument that could be used to assess educators’ attitudes with regard to the promotion of student wellbeing in Irish post-primary schools. The study was conducted in three stages: Content validity, involving seven experts and 14 educators; exploratory factor analysis (n = 129), and; confirmatory factor analysis (n = 99). Analyses indicated the viability of a 10-item two-factor model, which was named the ‘Attitudes Toward Wellbeing Promotion’ (ATWP) scale.
Introduction
In the last number of years, there has been a noticeable increase in measures aimed at attending to the social and emotional wellbeing of post-primary students in Ireland. Several policy documents have been made available that establish a framework of wellbeing in post-primary schools. For example, the ‘Framework for Junior Cycle’ (Department of Education and Skills Citation2015) provides direction for how teaching, learning and assessment may be improved across the first three years of post-primary education, and provides instruction regarding the phased introduction of the new Junior-Cycle curriculum. This framework also heralded the introduction of wellbeing as a recognised area of learning at a post-primary level. The Framework for Junior Cycle is informed by existing frameworks, such as ‘A framework for improved health and wellbeing 2013–2025’ (Department of Health Citation2013), which establishes the wider social context for health and wellbeing promotion for the Irish public. This publication outlines governmental aims of achieving (among other things) increased lifelong health, reduced health inequalities, and insulation against threats to health and wellbeing for the Irish public. These frameworks have been supplemented by more recent publications, such as the ‘Wellbeing policy statement and framework for practice 2018–2023’ (Department of Education and Skills Citation2018). This document establishes the roles of schools, centres for education, and government in wellbeing promotion, while also providing a framework for practice in wellbeing education at both a primary and post-primary level.
Post-primary schools are afforded a high degree of autonomy in developing and implementing relevant policies, delivering relevant curricula, and achieving appropriate whole-school practices. To facilitate schools in this endeavour, in 2017 the National Council for Curriculum and Assessment released the NCCA wellbeing guidelines. The aim of these guidelines is to ‘support schools in planning and developing a coherent wellbeing programme that builds on the understandings, practices and curricula for wellbeing already existing in schools’ (NCCA Citation2017, 8).
Several studies have proposed that educators’ positive perceptions of health and wellbeing education are among the most important factors in terms of achieving successful whole-school implementation (Mayock, Kitching, and Morgan Citation2007; NCCA Citation2017; Byrne, Rietdijk, and Pickett Citation2018). However, while a number of studies have attempted to examine educators’ attitudes regarding wellbeing promotion, there is still a relative dearth of research in this regard. Furthermore, a review of the literature reveals that no test instrument currently exists that could be used in research of this kind. The purpose of the present study was to develop a test instrument that could accurately and reliably measure Irish post-primary educators’ attitudes regarding the promotion of student wellbeing.
Defining wellbeing
Consensus with regard to the definition of wellbeing can be quite elusive. In its broadest sense, wellbeing can be conceptualised as a sense of contentment with one’s mental, emotional, and physical state. With this in mind, eudaimonic principles of wellbeing were adopted in the present study. The eudaimonic tradition is a non-prescriptive approach to wellbeing that emphasises the subjective nature of wellbeing experiences (Dodge et al. Citation2012). Eudaimonia observes the principle that ‘wellbeing is a social construct that is fluid in nature and has an ever-evolving and contextual definition’ (Watson et al. Citation2012, 25). Adhering to this approach acknowledges the high degree of autonomy and experiential variation likely across different schools when pursuing wellbeing promotion. Furthermore, in a publication commissioned by the NCCA, O’Brien and O’Shea (Citation2017) highlighted the appropriateness of the eudaimonic tradition when conceptualising subjective wellbeing in an educational context. Indeed, eudaimonic considerations for subjective wellbeing are widely evident throughout the wellbeing guidelines and across many of the available policy documents. In this sense, it is also necessary to adhere to an appropriate model in defining ‘attitude’.
Defining attitude
In this study, attitude was conceptualised using the ABC model of attitude (Kothandapani Citation1971). This model proposes that attitude consists of three distinct components. The Affective component relates to what one feels in relation to an attitude object; for exampe, ‘I am afraid of flying’. The Behavioural component denotes the way one behaves in relation to an attitude object; for example, ‘I will avoid flying whenever I can’. Finally, the Cognitive component relates to what one believes or knows of an attitude object; for example, ‘I believe it is unsafe to fly’. The ABC model has been the subject of much research, the results of which support the validity of the tripartite model (see Kothandapani Citation1971; Breckler Citation1984).
Historically, it has been considered that each of the attitudinal components would vary on a common evaluative continuum broadly representative of negativity versus positivity. It has also been asserted that the three components are highly correlated and that attitude, as a whole, is an important predictor of behaviour (Allport Citation1935). These latter assertions have since been challenged. More rigorous psychometric evaluation of the three-component model identified moderate correlation at best, with the outcome of such studies suggesting component correlation should not be an expectant criterion when assessing attitude. It has also been contended that attitude may not bear as significant an influence upon behaviour as once thought (Kruglanski et al. Citation2018), with environmental factors found to be influential with regard to ones’ proclivity towards, or away from, attitude-congruent behaviour (Eaton and Visser Citation2008). That said, the ABC model remains at the forefront of the widely contested topic of attitude’s influence upon individual behaviour (e.g. Haddock and Maio Citation2019; Nordqvist and Johansson Citation2020).
Assessing attitude in relation to wellbeing promotion
By acknowledging the ABC model when assessing attitudes regarding the promotion of a eudaimonic sense of wellbeing (wellbeing promotion), affective measures of attitude would attend to feelings and emotional states associated with wellbeing promotion. Behavioural measures would account for what is done in relation to the act of promoting wellbeing, while cognitive measures would relate to knowledge of how to pursue wellbeing promotion, and perceptions of the value of pursuing wellbeing promotion. It should be appreciated that the three components of attitude are reciprocal, with each component capable of being informative of another (Zanna Citation1990). For example, what educators know of wellbeing promotion may influence how they feel and what they do. The following section will provide more detail in this regard.
School-related factors influencing educators’ attitudes regarding wellbeing promotion
Educator training
The successful delivery of health and wellbeing education can often be largely contingent upon achieving positive perceptions and buy-in among the educators tasked with delivering such education. Several studies have been conducted that examined educators’ perceptions regarding health and wellbeing education, and the factors that may be influential in the development of these perceptions. For example, research examining the provision of health education in post-primary schools in Cyprus found that while 87% of educators were welcoming of the inclusion of health education as part of the curriculum, 82% indicated that they would require further training in general health matters. Furthermore, 84% of educators suggested that further methodological training was required in terms of delivering health education, while 61% of educators indicated that they felt that their schools’ current curriculum was too full to accommodate health education (Apostolidou and Fontana Citation2003). These authors argued that further training and familiarity with health education would likely amend any negative perceptions held by educators. These authors had also previously identified that positivity on the part of educators with regard to their own health often tended to translate into positivity with regard to the provision of health education as part of the school curriculum (Fontana and Apostolidou Citation2002).
Research conducted in Ireland found that as many as one third of Social, Personal and Health Education (SPHE) educators across 394 participating schools lacked any kind of formal training in delivering this subject (Moynihan, Jourdan, and Mannix McNamara Citation2016). The authors of this study proposed that training in SPHE was a key factor in the successful delivery of health and wellbeing education, and that the absence of training represented a significant barrier in this regard. A case study of 12 Irish post-primary schools identified that participating educators valued SPHE and related wellbeing promoting activities. However, SPHE and health and wellbeing activities were found to lack status in comparison to core curricular subjects and activities, which often informed a reluctance among educators to pursue SPHE or health and wellbeing related training (O'Higgins et al. Citation2013). Indeed, it has consistently been suggested that increased levels of appropriate training would not only benefit the delivery of health and wellbeing education, but can also augment educators’ perceptions regarding the value of such education (O'Higgins et al. Citation2013; Moynihan, Jourdan, and Mannix McNamara Citation2016; Doyle Citation2017).
Educator comfort
Issues with training are readily identifiable with regard to the provision of sex education or any such derivative, and can often contribute to educator discomfort with delivering health and wellbeing curricula. One study conducted in Australia found a lack of adequate training contributed to negative perspectives and reduced implementation of sexuality education. In this case, negative perspectives were traced back to a perceived lack of governmental commitment to the sexuality education curriculum. It was also noted that educators were often uncomfortable with delivering sexuality education. This could result in educators only delivering the components of sexuality education with which they were most comfortable, overlooking the components that made them most uncomfortable (Chambers et al. Citation2017).
Shannon and Smith (Citation2015) elaborated upon this trend of discomfort with sexuality education in Australia. These authors stated that the curriculum for sexuality education typically advocated the challenging of systematic sexism, homophobia, and transphobia. However, it was argued that discussions of the socio-political factors that inform these phenomena were discouraged for fear of an associated controversy. This could result in incongruence between school policy and expert opinion regarding best practice in sexuality education. Not only could this contribute to considerable reticence on the part of educators with regard to Lesbian, Gay, Bisexual, Transgendered, Queer, Inter-sex (LGBTQI) students, but it also further compounded educators’ discomfort with delivering sexuality education.
Educator comfort was also found to be problematic in Ireland, with 71% of 187 schools stating that educators exhibited a degree of discomfort with delivering the Relationships and Sexuality Education (RSE) curriculum (Mayock, Kitching, and Morgan Citation2007). As per Chambers et al. (Citation2017), Mayock, Kitching, and Morgan (Citation2007) found that educators tended to shy away from delivering RSE, instead emphasising other aspects of SPHE, within which RSE resides. The variation in educators’ capacity to deliver RSE and the disparity in the degree to which RSE was delivered was even noted by parents.
Issues of comfort with delivering the health and wellbeing curriculum are not exclusive to sex education components. Walter, Gouze, and Lim (Citation2006) found that 50% of 119 American educators surveyed experienced discomfort and lacked confidence with regard to attending to students’ mental health in their classroom. Research in England (Rothì, Leavey, and Best Citation2008) also indicated that educators harbour concerns regarding the changing nature of their responsibilities to their students due to a move towards attending to students’ mental health. Participants in this study stated that they felt under-trained and ultimately unprepared to attend to their students’ mental health and wellbeing. Participants were also concerned about the perceived ambiguity of the criteria used to identify if a students’ development was to be considered normal or abnormal. All of these factors were seen to contribute to considerable stress and anxiety on the part of the participants with regard to their being tasked with attending to student wellbeing. It was also found that these issues negatively influenced participants’ job satisfaction.
Educator workload
Another recurring theme in the available literature is the influence that workload can have upon perceptions of health and wellbeing promotion. Workload arises as a factor in terms of the perceptions of educators regarding the delivery of health and wellbeing promotion in the majority of the literature examined. Apostolidou and Fontana (Citation2003) noted that an overloaded curriculum contributed negatively to educators’ perceptions of health promotion. Rothì, Leavey, and Best (Citation2008) noted that educators feeling overburdened by work was a significant inhibitive factor with regard to health and wellbeing education. Participants in this study also expressed scepticism that adequate training in attending to students’ mental health and wellbeing could ever be achieved due to their current workload. Mayock, Kitching, and Morgan (Citation2007) found that 82% of schools believed that the current curriculum was too overcrowded to accommodate RSE, while approximately two thirds stated that delivering RSE increased the perceived pressure of delivering the core curriculum. A regional development officer involved in the study concluded that RSE and SPHE might not fit culturally within schools because of an emphasis upon task orientation, core subjects, and examination preparation. It was argued that RSE and SPHE were often side-lined in favour of the core curriculum.
The whole-school approach
Workload can also be deleterious to achieving a whole-school approach to health and wellbeing promotion. In one case study conducted in Ireland it was found that, although educators believed pastoral care to be a core responsibility of all school staff and were welcoming of this responsibility, time or resource constraints could push educators to prioritise core lessons over the pastoral care of their students. Educators also expressed that a whole-school approach to wellbeing promotion added to the already palpable pressure they felt in terms of delivering the core curriculum. This was both in terms of workload and the emotional labour associated with attending to their students’ wellbeing (Hearne and Galvin Citation2015).
It is also plausible that implementivity issues or the prioritisation of the core curriculum may result from a lack of understanding regarding the benefits of a whole-school approach. In their case study of 12 Irish schools, O'Higgins et al. (Citation2013) found that there were educators in each of the participating schools who were resentful of losing their core curriculum activities to facilitate wellbeing curriculum activities. It was observed that these educators were often uninformed as to the benefits of this approach and tended to cede participation in wellbeing activities when possible. The authors also noted that while eight of the twelve participating schools asserted a positive view of SPHE, when principals did not espouse the value of SPHE, negativity could permeate to the extended faculty.
In this sense, it is crucially important to foster positive perceptions and attitudes towards a whole-school model of wellbeing promotion in order for this model to work. A longitudinal study of 114 English teachers found that the most influential factors in novice educators’ willingness to engage with health and wellbeing education were school ethos, attitudes of senior leadership, and the level of mentoring received (Byrne, Rietdijk, and Pickett Citation2018). These authors also found support for Myers-Clack and Christopher’s (Citation2001) claim that health education training for preservice teachers can result in improved attitudes towards health promotion upon eventual entry into service. While pre-service training may be advantageous, implementivity may be problematic. One study of 494 post-primary teacher-education students in Ireland identified that none of the participants had been exposed to third-level education in SPHE (Mannix McNamara et al. Citation2012).
Educators attitudes regarding wellbeing promotion
The literature examined is by no means exhaustive. However, it can be considered to be representative of the prominent school-related factors that influence educators’ attitudes regarding wellbeing promotion. Examining this literature, it can be inferred that educators are largely positive in acknowledging their role in the provision of pastoral care for their students (Apostolidou and Fontana Citation2003; O'Higgins et al. Citation2013; Doyle Citation2017). It can also be seen that a number of factors can result in negativity regarding this task. Principally, insufficient training has resulted in negative perceptions among some educators regarding health and wellbeing education (Apostolidou and Fontana Citation2003). Negative perceptions could also manifest as a result of experiencing discomfort with delivering health and wellbeing education (Chambers et al. Citation2017). Discomfort resulted in some educators feeling a lack of confidence (Walter, Gouze, and Lim Citation2006) and stress and anxiety, which ultimately resulted in reduced job satisfaction (Rothì, Leavey, and Best Citation2008). Workload has been found to result in pessimism among some educators regarding their ability to avail of proper training (Rothì, Leavey, and Best Citation2008) and to deliver both the wellbeing and core curriculum appropriately (Doyle Citation2017). Finally, a poorly executed whole-school approach to health and wellbeing education resulted in the perception of increased pressure and stress for some educators (Hearne and Galvin Citation2015).
While the literature discussed provides a valuable insight into educators’ perceptions regarding health and wellbeing education, it is noteworthy that the majority of these studies employ qualitative methods. A number of studies include quantitative methods (e.g. Apostolidou and Fontana Citation2003; Walter, Gouze, and Lim Citation2006, and; Mayock, Kitching, and Morgan Citation2007). However, each of the studies that utilised quantitative methods did so using individual dichotomous or Likert-scaled response items. Further examination of the available literature indicates that, as of yet, no dedicated composite test instrument exists that could be used to measure educators’ attitudes towards wellbeing promotion.
Method
Research design
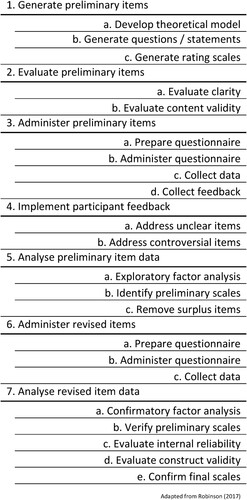
The instrument was developed in three stages. The first stage involved the development of an initial-list of test items that were to be subject to content validity analysis. The second stage was an exploratory factor analysis (EFA) of the validated test items. The third stage was a confirmatory factor analysis (CFA) of the proposed instrument found during EFA. Stages two and three were undertaken to assess construct validity. Progression through these stages and the overall development of the test instrument was guided by the methodology outlined by Robinson (Citation2017) as per . The surveys used at each stage were pilot-tested to assess functionality using five peers who were otherwise uninvolved in the development of the instrument. Ethical approval for this study was granted by the ethics committee at Technological University – Blanchardstown campus.
Figure 1. Process for developing psychometric scales.
Participants
Recruitment of educators as participants was influenced by considerations for a larger study in which the finalised instrument was intended to be used. This resulted in limitations regarding the amount of schools that could be approached. Numerous methods have been proposed with regard to the assessment of adequate sample sizes when conducting factor analysis. It has been proposed by some that a sample size of over 100 is necessary, while others have proposed sample to variable ratios (within the humanities) ranging from 3:1 to 10:1 (Williams, Brown, and Onsman Citation2010). Recruitment aimed to observe the 10:1 ratio, but adopted a minimum criterion of n = 100 if the 10:1 ratio could not be met.
Participants were recruited in three groups. Group one was recruited for the purpose of establishing content validity via an adapted application of the Content Validity Index (CVI) (Polit and Beck Citation2006). This group consisted of two cohorts. The first cohort was established to assess content validity with regard to the three components of attitude (Kothandapani Citation1971). This cohort was recruited using a purposive sampling technique and consisted of seven peers who are employed or are pursuing doctorates in the field of psychology. These peers were selected for their knowledge and experience of research relating to attitude, education, and wellbeing.
The second cohort was established to assess content validity with regard to four hypothesised sub-scales: (1) Attitudes toward the task of wellbeing promotion; (2) Attitudes toward school wellbeing policiesFootnote1; (3) Attitudes toward wellbeing curricula, and; (4) Attitudes toward the wellbeing guidelines. The point of contact at 24 post-primary schools randomly selected from a total population of 724 post-primary schools in Ireland was contacted by email. The point of contact – typically a principal, vice-principal, or secretary/administration staff member – was requested to forward on a survey link to any faculty members who may be interested in participating in the research. In total, 14 educators participated. No demographic data were collected from group one due to the small number of participants involved at this stage.
Group two was recruited for the purpose of conducting the EFA. The point of contact for 100 randomly selected post-primary school was contacted by email and requested to forward an attached survey link to any faculty members who may be interested in participation in the research. The 24 schools used in stage one were omitted from consideration in this stage (N = 700). From the pool of 100 schools, 131 educators participated in the EFA. A cross-tabulation of these participants can be seen in .
Table 1. Crosstabulation of EFA participants.
Group three was recruited for the purpose of conducting the CFA. The recruitment process reflected that of group two with the point of contact of 100 randomly selected post-primary schools contacted with a request for participation. Again, the previously used 124 schools were omitted from this stage (N = 600). A total of 102 educators participated in the CFA. A cross-tabulation of these participants can be seen in . One participant did not complete the urban/rural question. As the instrument administered during CFA was representative of the potential finalised scale (barring the three demographic items), completion times were recorded. The average completion time was two minutes and twenty-five seconds.
Table 2. Crosstabulation of CFA participants.
Materials
A theoretical model was developed, which hypothesised that the ATWP scale may consist of four sub-scales; (1) Attitudes toward the task of wellbeing promotion; (2) Attitudes toward school wellbeing policies; (3) Attitudes toward school wellbeing curriculum; and (4) Attitudes toward the wellbeing guidelines. An initial-list of 84 items was developed for initial testing. Each proposed sub-scale consisted of 21 items. Each sub-scales’ 21 items consisted of seven items per attitudinal component with two of these seven items being reverse scored. Items were scored on a balanced and fully anchored five-point Likert response format scale as follows: 1 = ‘Strongly Disagree’; 2 = ‘Disagree’; 3 = ‘Neither Agree nor Disagree’; 4 = ‘Agree’, and; 5 = ‘Strongly Agree’, in accordance with Vagias (Citation2006).
Procedure
The initial-list was administered to each cohort of group one to evaluate the clarity and content validity of the 84 items. The initial-list administered to cohort one of group one contained the answer format; 1 = ‘Cognitive’; 2 = ‘Affective’; 3 = ‘Behavioural’, so as to allow for the assessment of content validity with regard to the three components of attitude. Participants in this cohort were requested to associate each item to the attitudinal component to which they believed it belonged.
Cohort two were provided with the answer format; 1 = ‘Attitudes toward the task of wellbeing promotion’; 2 = ‘Attitudes toward school wellbeing policies’; 3 = ‘Attitudes toward school wellbeing curriculum’, and; 4 = ‘Attitudes toward the wellbeing guidelines’, so as to assess content validity with regard to the four hypothesised sub-scales. Participants in this cohort were requested to associate each item to the aspect of wellbeing promotion (i.e. sub-scale) to which they believed it belonged. Participants in both cohorts were advised that they may make multiple selections if they perceived an item to have multiple associations. All participants were also afforded the opportunity to provide feedback and recommendations with regard to the clarity of the items. For both cohorts, the initial-list was administered via Google Forms. Cohort one was emailed directly with a link to the survey while cohort two were recruited via a point of contact at their respective school of employment as previously outlined. Data collection for both cohorts occurred concurrently over a period of two weeks.
Following the assessment of clarity and content validity, a short-form of the initial-list pool of items was consolidated and administered to group two for the purpose of conducting an EFA of the proposed ATWP model. The resulting model was then subject to CFA.
Analysis
Preliminary assessment and item reduction of the initial-list was conducted using an adapted application of the CVI. Content validity has been defined as the degree to which an instrument has an appropriate sample of items for the construct being measured (Polit and Beck Citation2006). An item content validity index (I-CVI) can be obtained using a four point Likert response format as follows: 1 = ‘Not Relevant’; 2 = ‘Somewhat Relevant’; 3 = ‘Quite Relevant’, and; 4 = ‘Highly Relevant’. The use of a four-point scale is preferred to avoid having a neutral and ambivalent mid-point. The I-CVI is then computed as the number of raters providing a rating of either 3 or 4 divided by the total number of raters. It is typically viewed that an acceptable I-CVI score is ≥.80 (Polit and Beck Citation2006).
Due to time constraints resulting from the development of this scale being undertaken within the context of a larger study, measures were taken to expedite data reduction at this point. Interpretation of I-CVI scores was adapted so that only items that were unanimously considered ‘highly relevant’ were brought forward for further analysis. As such, the minimum acceptable I-CVI score was set to 1. The scale CVI (S-CVI) was computed as proposed by Polit and Beck (Citation2006). It should be noted that setting the minimum acceptable I-CVI score at 1 predetermined that the minimum acceptable score for the S-CVI also be 1, as the S-CVI is simply the average value of all I-CVI scores.
Assessment of content validity was conducted using Microsoft Excel 2016. The resulting short-form pool of items was then subjected to exploratory factor analysis using SPSS (v.20). Confirmatory factor analysis was conducted using the psych, MVN and Lavaan packages in the software ‘R’ (v3.5.1). Reliability analyses were conducted using the psych package in R.
Results
Content validity
A total of 38 items satisfied the I-CVI criteria for the attitudinal survey (cohort 1), while 30 items did so with regard to the sub-scale survey (cohort 2). When these were cross-referenced, 18 items were found to satisfy the I-CVI criteria in both surveys. With regard to the attitudinal components, eight items pertained to the cognitive component, five to the affective component, and five to the behavioural component. With regard to the promotion of wellbeing survey, five items pertained to attitudes toward the task of wellbeing promotion, six to attitudes toward school wellbeing policies, five to attitudes toward school curriculum, and two to attitudes toward the wellbeing guidelines. None of the discarded ‘wellbeing guidelines’ items produced I-CVI scores ≥.80 in both surveys. Therefore, no items could be considered for inclusion based on the I-CVI score advised within the literature. Further, due to the aforementioned time constrictions, it was not possible to re-evaluate these items. A minimum of three-item loadings are required to triangulate a factor in EFA (Williams, Brown, and Onsman Citation2010), therefore, the two items pertaining to the wellbeing guidelines were removed from the list. This, in turn, reduced the number of items addressing the cognitive component of attitude to six.
Exploratory factor analysis
Data screening
The data was screened for univariate outliers using the criterion of 2.2 times the inter-quartile range (2.2×IQR), as proposed by Hoaglin and Iglewicz (Citation1987). No outliers were found. Missing values were removed using listwise deletion resulting in a final sample size of 129. With an appropriate sample size (n = 129) and a sample to a variable ratio of 8:1, the sample was deemed adequate for factor analysis, contingent upon an initial investigation of factorability.
Tests of normality
Normality of the EFA data was examined using Mardia’s multivariate skewness test and Mardia’s multivariate kurtosis test to assess multivariate normality. The Shapiro–Wilk test was used to assess univariate normality. Both tests assess multivariate and univariate normality (respectively) against the null hypothesis that data are normally distributed. Mardia’s multivariate skewness test produced a statistically significant test statistic (p < .001) while the multivariate kurtosis test produced a non-significant test statistic (p > .05). This indicates the criteria for multivariate normality was satisfied with regard to kurtosis but was not satisfied with regard to skewness. The Shapiro–Wilk test produced statistically significant test statistics for all 16 items. The null hypothesis that data are normally distributed was therefore rejected with the results of these tests indicating a violation of multivariate normality. Mean, standard deviation, skewness, and kurtosis values for these data can be seen in .
Table 3. EFA item descriptive statistics.
Factor analysis
Several criteria for examining the factorability of the 16 items were observed. Inspection of the anti-image correlation matrix identified several items with a correlation ≥.30 with at least one other item. The Kaiser–Meyer–Olkin (KMO) measure of sampling adequacy was .76, which is above the minimum recommended value of .50 (Williams et al. Citation2010). Bartlett’s test of sphericity was statistically significant (χ2 (129) 743.60, p < .05). Finally, 15 communalities were observed, which were ≥.30. These indicators demonstrated that the data were suitable for factor analysis (Williams et al. Citation2010).
Principal axis factoring (PAF) was used to examine for latent factors during factor extraction, as it has been demonstrated to be the extraction method that is most robust against issues of non-normality of data and is better able to recover weak factors (Fabrigar et al. Citation1999). Parallel Analysis (PA) (Hayton, Allen, and Scarpello Citation2004) indicated that two factors were to be retained for factor extraction. Oblimin was selected as the rotation method to examine for potential correlation between factors. Upon inspection of the correlation matrix, no correlation was found between factors. The rotation method was then changed to Varimax to facilitate the pronouncement of non-correlated factors.Footnote2
Upon inspection of the rotated factor matrix, two items (‘the available policies are largely beneficial to the promotion of students’ social and emotional wellbeing’, and; ‘I use the wellbeing curriculum to facilitate the social/emotional wellbeing of the students in my school’) were found that did not load on either factor. These items were removed from the item pool. Three items (‘I fulfil my schools wellbeing policies to the best of my ability’; ‘I rarely feel stressed when delivering the wellbeing curriculum’, and; ‘the social/emotional needs of all the students in my school are accounted for in the available wellbeing policies’) were found to have unique, negative loadings on one factor. The negative loadings were not theoretically compatible with the positive loadings and reduced the parsimony of the scale. Therefore, these items were removed from the item pool. PAF was conducted on the remaining 11 items. The rotated factor matrix was again inspected, and it was found that one item loading (‘I am familiar with the wellbeing curriculum’) was theoretically inconsistent with the other items of that factor. This item was therefore removed from the item pool.
A final iteration of PAF was conducted using the remaining 10 items. The two retained factors, consisting of five items each, explained 55.89% of variance with 11 (24%) non-redundant residuals with absolute values greater than .05. The ‘attitudes toward the task of wellbeing promotion’ sub-scale loaded as hypothesised and was assigned the short-hand label ‘wellbeing promotion’. The ‘attitudes toward school wellbeing policies’ and ‘attitudes toward school wellbeing curriculum’ sub-scales loaded together. The items of these two sub-scales were interpreted to be theoretically compatible and the sub-scale was reconceptualised to be indicative of the tools available to facilitate the promotion of student wellbeing. This sub-scale was given the short-hand ‘policies & curriculum’. No cross-loadings existed between the two factors when values below .30 were supressed. The factor loading matrix for the final solution can be seen in . Reliability analysis of the full instrument and the two sub-scales was conducted by way of internal consistency using McDonald’s Omega total (ωt). McDonald’s Omega total was preferred as it has been found to be most suitable for reliability analyses involving multidimensional scales (Dunn, Baguley, and Brunsden Citation2013). The Omega values for the ATWP (ωt = .81) and policies & curriculum sub-scale were good (ωt = .82), while the wellbeing promotion sub-scale (ωt = .78) was found to be acceptable.
Table 4. EFA factor loading matrix.
Confirmatory factor analysis
Data screening
Data collected from group three were screened for univariate outliers using the criterion 2.2×IQR (Hoaglin and Iglewicz 1987), as per the EFA. No outliers were found. One patterned response was found (the respondent entered ‘Strongly Disagree’ for seven items in a row out of ten, including reverse-scored items) in addition to two incomplete responses where the number of missing values ≥5. This incidentally resulted in the removal of the respondent who did not complete the urban/rural question. The sample size was thus reduced to n = 99, however, the sample to variable ratio was still acceptable at 10:1 (after rounding).
Tests of normality
Normality of the CFA data was examined as per the EFA data. Mardia’s tests produced statistically significant test statistics (p < .001) with regard to the ATWP while the Shapiro–Wilk test produced statistically significant test statistics for all 10 items of the ATWP. The null hypothesis that data are normally distributed was therefore rejected with the results of these tests indicating a violation of multivariate normality. Mean, standard deviation, skewness, and kurtosis values for these data can be seen in .
Table 5. CFA item descriptive statistics.
Factor analysis
Deviation from multivariate normality can result in inflated χ2 values, which can in turn result in inflated model fit indices (Brown Citation2015). Therefore, the robust Maximum Likelihood Method (MLR) was used to estimate the model parameters. MLR uses the Satorra–Bentler chi-square correction to make χ2 values more robust to deviations from multivariate normality, in addition to adding robustness to standard errors, p values, and confidence intervals (Li Citation2015). Goodness-of-fit was examined using two absolute fit indices; Root Mean Square Error of Approximation (RMSEA), and Standardised Root Mean Square Residual (SRMR), and two relative fit indices; Close Fit Index (CFI), and Tucker–Lewis Index (TLI). CFI and TLI were specifically chosen as they have been demonstrated to be most resilient against the effects of small sample sizes and non-normally distributed data (Cangur and Ercan Citation2015). Absolute fit index values are considered to be acceptable at <.08, while relative fit index values are seen to be acceptable at >.95 (Smith and McMillan Citation2001). All fit indices demonstrated acceptable fit values: RMSEA (.03, 90% CI = .00–.80); SRMR (.07); CFI (.98); TLI (.98).
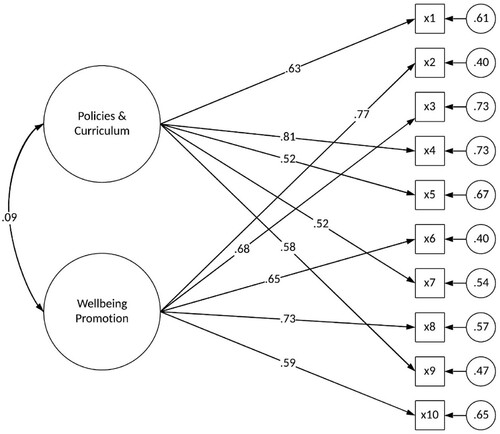
The standardised factor loadings can be seen in . Inspection of the expected parameter change (EPC) values indicated that the 10-item model had been specified appropriately, with no requirement for further reduction (Saris, Satorra, and Van der Veld Citation2009). All items loaded in accordance with the hypothesised two-factor model created during the EFA stage. As per the EFA model, the two factors were found to be uncorrelated (r = .09). Discriminant validity with regard to the two factors was assessed by comparing the average variance extracted (AVE) to the average shared variance (ASV). The AVE values for factor 1 (.37) and for factor 2 (.48) were both found to be larger than the ASV (.01), therefore, discriminant validity between the two factors was established (Alumran et al. Citation2014).
Table 6. CFA factor loadings and attitudinal components.
Inspection of the modification indices at the 3.54 threshold demonstrated that χ2 might be improved by allowing x1 to covary with x3, and x5 to covary x10. These changes did not make theoretical sense as each covariance functioned between items from different factors. Therefore, the original model was retained. The model and its parameter estimates, including factor correlation, path coefficients, and residual variances, are shown in . Reliability analysis of the full instrument and the two sub-scales produced during CFA was conducted using McDonald’s Omega. Omega values for the ATWP (ωt = .81) and the wellbeing promotion (ωt = .82) sub-scale were good, while the policies & curriculum sub-scale (ωt = .75) was acceptable.
Figure 2. Model parameter estimates.
Discussion
Upon inspection of the fit indices, factor loadings, residual variances, EPC values, and Omega values, it can be concluded that the 10-item, two-factor model of the ATWP scale is a psychometrically sound test instrument that can be used to assess post-primary educators’ attitudes regarding the promotion of student wellbeing. The ATWP is principally concerned with measuring educators’ attitudes regarding the task of promoting student wellbeing, and their attitudes regarding the available wellbeing policies and curriculum. The design of the instrument has also accounted for the prominent factors found within the literature that may influence educators’ perceptions of wellbeing promotion. Consideration was also given to ensuring that the three components of attitude were recognised during the instruments’ development.
The ATWP was developed to assess post-primary educators’ attitudes regarding the promotion of student wellbeing specifically within an Irish context and, as such, should only be considered for use within this context. The ATWP has been designed to provide an assessment of levels of positivity or negativity among educators regarding their overall perception of wellbeing promotion. It is also possible to examine levels of positivity or negativity expressed regarding the task of promoting student wellbeing, as well as the available policies and curriculum. Positive perceptions of health and wellbeing education have been argued to be among the most important factors in terms of achieving successful whole-school implementation (Mayock, Kitching, and Morgan Citation2007; NCCA Citation2017; Byrne, Rietdijk, and Pickett Citation2018). The ATWP could play an important role in assessing educators’ attitudes in this regard, and in identifying areas that may require remedial action in order to achieve a positive whole-school perception of wellbeing promotion.
Furthermore, the ATWP could be utilised as a basic diagnostic tool pertaining to the quality of the available wellbeing policies and curricula. That it may be found that educators exhibit negative attitudes toward such policies and curricula should not be considered indicative of ‘bad attitudes’. It may be that these negative attitudes are warranted due to inadequacies in the policies and/or curricula. The ATWP could highlight the presence of these concerns, and additional testing and analysis may then be employed to address any potential inadequacies.
Limitations and directions for future research
The development of the ATWP was undertaken to provide a valid and reliable test instrument for use in a larger study, which was aimed at examining the attitudes and opinions of post-primary educators in Ireland regarding the promotion of student wellbeing. This resulted in a number of limitations that could not be addressed within the scope of the time and resources that could be made available for the development of the scale.
Sample sizes for both EFA and CFA were relatively small. Due to the aforementioned study, it was not possible to increase the amount of schools approached during each stage of analysis, or to attempt to solicit additional participants from those schools that were approached. While this was largely unproblematic for EFA, it was deemed necessary to choose a model parameter estimator (MLR) for CFA that would insulate χ2 values against inflation due to the small sample size. It should also be noted that participants were not required to disclose the names of their schools to afford anonymity. This limits assessment of sample representativeness beyond the demographic information provided.
The instruments’ sub-scales did not load as initially intended. The ‘wellbeing policies’ and ‘wellbeing curriculum’ items loaded together onto one sub-scale. However, the items from these two sub-scales were theoretically compatible and these items were reconceptualised to be indicative of a ‘policies & curriculum’ sub-scale. The ‘wellbeing guidelines’ items failed to satisfy the criteria established for the I-CVI and were completely omitted from factor analysis. The ‘wellbeing promotion’ items did load correctly onto the relevant sub-scale.
Finally, it is possible that including explicit consideration for attitudinal components during content validity analysis may have negatively impacted upon the parsimony and clarity of the instrument. Content validity analysis of the attitudinal components was complicit in the omission of ‘wellbeing guidelines’ items from the factor analysis stages. In addition, it is possible that the consideration for attitudinal components may have influenced the items’ factor loadings during EFA and CFA.
It is recommended that future research regarding the ATWP scale attend to achieving the originally proposed four-factor model. While the ‘policies & curriculum’ sub-scale is adequate for its intended purpose, separate ‘wellbeing policies’ and ‘wellbeing curriculum’ sub-scales would facilitate greater depth of analysis. It would also be beneficial, within an Irish context, to pursue the ‘wellbeing guidelines’ sub-scale, although this would limit any potential international use of the ATWP. It is recommended that further research be conducted to assess the viability of applying the ATWP outside of an Irish context. It is also recommended that any future research regarding the development of the ATWP scale omit the explicit consideration for attitudinal components that was demonstrated in the present study.
Conclusion
The purpose of the present study was to develop a valid and reliable test instrument that could be used to examine Irish post-primary educators’ attitudes regarding the promotion of students’ wellbeing. Through a three-stage process of content validity analysis, exploratory factor analysis, and confirmatory factor analysis, it has been demonstrated that the 10-item two-factor model of the ATWP scale is suitable for this purpose. Future research is recommended to develop a more robust four-factor model, although it may be more pertinent to develop a three-factor model if this instrument were to be considered for international use. That said, the present model of the ATWP has been found to be suitable for use in an Irish context. This instrument is parsimonious and can be quickly administered, making it easily embeddable in end of year assessment protocols for educators. Given the recent formalisation of the Junior-Cycle wellbeing curriculum, the ATWP may be particularly appropriate for use when assessing educators’ attitudes and levels of buy-in with regard to the promotion of student wellbeing at this level.
Disclosure statement
No potential conflict of interest was reported by the author(s).
Correction Statement
This article has been corrected with minor changes. These changes do not impact the academic content of the article.
Additional information
Funding
Notes on contributors
David Byrne
David Byrne is a PhD student based at the Blanchardstown Campus of Technological University Dublin. David’s primary areas of research interest are mental health/wellbeing, group dynamics, and gender. David’s current research involves an examination of Irish post-primary educators’ attitudes regarding the promotion of student social and emotional wellbeing.
Colm McGuinness
Colm McGuinness has been a mathematics and statistics lecturer at Technological University Dublin – Blanchardstown campus (formally Institute of Technology Blanchardstown) since 1999. Colm has spent considerable time developing mathematical and statistical supports for students, some of which can be found at http://www.bbm.colmmcguinness.org/. Colm is director of statistical support at PEEI, and has supervised or co-supervised a number of PhD students to completion, and is currently working with several more. Most of Colm’s supervision work has been working with educationalists, social scientists and psychologists.
Aiden Carthy
Aiden Carthy directs the Research Centre for Psychology, Education and Emotional Intelligence (PEEI), which is located on the Blanchardstown Campus of Technological University Dublin. Aiden’s principal areas of research interest are mental health and applied education. Specifically, Aiden’s work focuses on using emotional intelligence coaching to enable educators, students and others to reach their maximum potential and on research related to student support and educational design.
Notes
1 Wellbeing policies refer to any school policy that may be in some way beneficial to student wellbeing, e.g. policies pertaining to child protection, codes of behaviour, RSE, exercise, diet, use of technology etc.
2 The change in rotation bore no impact upon the model. All items loaded onto the same factors using both rotation methods, albeit with very minor differences in factor loading values.
References
- Allport, G. W. 1935. “Attitudes.” In Handbook of Social Psychology, edited by C. Murchison, 798–844. Worcester, MA: Clark University Press.
- Alumran, A., X. Hou, J. Sun, A. A. Yousef, and C. Hurst. 2014. “Assessing the Construct Validity and Reliability of the Parental Perception on Antibiotics (PAPA) Scales.” BMC Public Health 14 (1): 73-81. doi:10.1186/1471-2458-14-73.
- Apostolidou, M., and D. Fontana. 2003. “Teacher Attitudes Towards Health Education in Greek-speaking Cyprus Schools.” Health Education 103 (2): 75–82. doi:10.1108/09654280310467690.
- Breckler, S. J. 1984. “Empirical Validation of Affect, Behavior, and Cognition as Distinct Components of Attitude.” Journal of Personality and Social Psychology 47 (6): 1191–1205. doi:10.1037/0022-3514.47.6.1191.
- Brown, T. A. 2015. Confirmatory factor analysis for applied research (2nd ed). New York, NY: Guilford Publications.
- Byrne, J., W. Rietdijk, and K. Pickett. 2018. “Teachers as Health Promoters: Factors That Influence Early Career Teachers to Engage with Health and Wellbeing Education.” Teaching and Teacher Education 69: 289–299. doi:10.1016/j.tate.2017.10.020.
- Cangur, S., and I. Ercan. 2015. “Comparison of Model Fit Indices Used in Structural Equation Modeling Under Multivariate Normality.” Journal of Modern Applied Statistical Methods 14 (1): 152–167. doi:10.22237/jmasm/1430453580.
- Chambers, A., J. Tomnay, S. Clune, and S. Roberts. 2017. “Sexuality Education Delivery in Australian Regional Secondary Schools: A Qualitative Case Study.” Health Education Journal 76 (4): 467–478. https://doi.org/10.1177/0017896917691791.
- Department of Education and Skills. 2015. Framework for Junior Cycle. Department of Education and Skills. Accessed July 6, 2018. https://www.education.ie/en/Publications/Policy-Reports/Framework-for-Junior-Cycle-2015.pdf.
- Department of Education and Skills. 2018. Wellbeing Policy Statement and Framework for Practice 2018–2023. Department of Education and Skills. Accessed March 2, 2019. https://www.education.ie/en/Publications/Policy-Reports/wellbeing-policy-statement-and-framework-for-practice-2018%E2%80%932023.pdf.
- Department of Health. 2013. Healthy Ireland: A Framework for Improved Health and Wellbeing 2013–2025. Department of Health. Accessed April 29, 2018. http://health.gov.ie/wp-content/uploads/2014/03/HealthyIrelandBrochureWA2.pdf.
- Dodge, R., A. Daly, J. Huyton, and L. Sanders. 2012. “The Challenge of Defining Wellbeing.” International Journal of Wellbeing 2 (3): 222–235. doi:10.5502/ijw.v2i3.4.
- Doyle, E. 2017. An Exploratory Study of the Perceived Benefits of SPHE (From a Teachers Perspective) for Junior Cycle Male Students and Its Implications for the Guidance Counselling Service. Master’s thesis, University Limerick, Limerick, Rep. of Ireland. https://ulir.ul.ie/bitstream/handle/10344/6475/Doyle_2017_exploration.pdf?sequence=6.
- Dunn, T. J., T. Baguley, and V. Brunsden. 2013. “From Alpha to Omega: A Practical Solution to the Pervasive Problem of Internal Consistency Estimation.” British Journal of Psychology 105 (3): 399–412. doi:10.1111/bjop.12046.
- Eaton, A. A., and P. S. Visser. 2008. “Attitude Importance: Understanding the Causes and Consequences of Passionately Held Views.” Social and Personality Psychology Compass 2 (4): 1719–1736. doi:10.1111/j.1751-9004.2008.00125.x.
- Fabrigar, L. R., D. T. Wegener, R. C. MacCallum, and E. J. Strahan. 1999. “Evaluating the use of Exploratory Factor Analysis in Psychological Research.” Psychological Methods 4 (3): 272–299. doi:10.1037/1082-989x.4.3.272.
- Fontana, D., and M. Apostolidou. 2002. “A Survey of Teachers’ Health Lifestyles in Cyprus.” Health Education Journal 61 (1): 70–77. doi:10.1177/00178969020610010.
- Haddock, G., and G. R. Maio. 2019. “Inter-individual Differences in Attitude Content: Cognition, Affect, and Attitudes.” Advances in Experimental Social Psychology 59: 53–102. doi:10.1016/bs.aesp.2018.10.002.
- Hayton, J. C., D. G. Allen, and V. Scarpello. 2004. “Factor Retention Decisions in Exploratory Factor Analysis: a Tutorial on Parallel Analysis.” Organizational Research Methods 7 (2): 191–205. doi:10.1177/1094428104263675.
- Hearne, L., and J. Galvin. 2015. “The Role of the Regular Teacher in a Whole School Approach to Guidance Counselling in Ireland.” British Journal of Guidance & Counselling 43 (2): 229–240. doi:10.1080/03069885.2014.952622.
- Hoaglin, D. C., and Iglewicz B. 1987. “Fine-tuning some resistant rules for outlier labeling.” Journal of the American Statistical Association 82 (400): 1147–1149. doi:10.1080/01621459.1987.10478551.
- Kothandapani, V. 1971. “Validation of Feeling, Belief, and Intention to Act as Three Components of Attitude and Their Contribution to Prediction of Contraceptive Behavior.” Journal of Personality and Social Psychology 19 (3): 321–333. doi:10.1037/h0031448.
- Kruglanski, A. W., C. Baldner, M. Chernikova, C. Destro, and A. Pierro. 2018. “A New Perspective on the Attitude-Behavior Relation: The Essential Function of Goals.” Polish Psychological Bulletin 49 (1): 31–39. doi:10.1515/ppb-2018-00xx.
- Li, C. 2015. “Confirmatory Factor Analysis with Ordinal Data: Comparing Robust Maximum Likelihood and Diagonally Weighted Least Squares.” Behavior Research Methods 48 (3): 936–949. doi:10.3758/s13428-015-0619-7.
- Mannix McNamara, P., S. Moynihan, D. Jourdan, and R. Lynch. 2012. “Pre-service Teachers’ Experience of and Attitudes to Teaching SPHE in Ireland.” Health Education 112 (3): 199–216. https://doi.org/10.1108/09654281211217759.
- Mayock, P., K. Kitching, and M. Morgan. 2007. RSE in the Context of SPHE: An Assessment of the Challenges to Full Implementation of the Programme in Post-primary Schools. Department of Education and Science. Accessed March 22, 2018. https://www.education.ie/en/Schools-Colleges/Information/Post-Primary-School-Policies/2007-RSE-in-the-context-of-SPHE-An-Assessment-of-the-Challenges-to-Full-Implementation-of-the-Programme-in-Post-Primary-Schools-Summary-Report-.pdf.
- Moynihan, S., D. Jourdan, and P. Mannix McNamara. 2016. “An Examination of Health Promoting Schools in Ireland.” Health Education 116 (1): 16–33. doi:10.1108/he-03-2014-0045.
- Myers-Clack, S. A., and S. E. Christopher. 2001. “Effectiveness of a Health Course at Influencing Preservice Teachers’ Attitudes Toward Teaching Health.” Journal of School Health 71 (9): 462–466. https://doi.org/10.1111/j.1746-1561.2001.tb07327.x.
- NCCA. 2017. Junior Cycle Wellbeing Guidelines. NCCA. https://www.ncca.ie/media/2487/wellbeingguidelines_forjunior_cycle.pdf.
- Nordqvist, O., and S. Johansson. 2020. “Secondary School Biology Students’ Attitudes Towards Modern Biotechnology Characterised Using Structural Equation Modeling.” EURASIA Journal of Mathematics, Science and Technology Education 16 (2): 1–16. doi:10.29333/ejmste/115016.
- O'Brien, M., and A. O'Shea. 2017. A human development (PSP) framework for orienting education and schools in the space of wellbeing. Retrieved from NCCA website: https://ncca.ie/media/2488/a-human-development-framework-psp.pdf.
- O'Higgins, S., G. Galvin, C. Kennedy, S. Nic Gabhainn, and M. Barry. 2013. The implementation of SPHE at post-primary school level: A case study approach. NUI Galway. http://www.nuigalway.ie/hbsc/documents/nuig__sphe_evaluation_full_report_english.pdf.
- Polit, D. F., and C. T. Beck. 2006. “The Content Validity Index: Are you Sure you Know What's Being Reported? Critique and Recommendations.” Research in Nursing & Health 29 (5): 489–497. doi:10.1002/nur.20147.
- Robinson, M. A. 2017. “Using Multi-item Psychometric Scales for Research and Practice in Human Resource Management.” Human Resource Management 57 (3): 739–750. doi:10.1002/hrm.21852.
- Rothì, D. M., G. Leavey, and R. Best. 2008. “On the Front-line: Teachers as Active Observers of Pupils’ Mental Health.” Teaching and Teacher Education 24 (5): 1217–1231. doi:10.1016/j.tate.2007.09.011.
- Saris, W. E., A. Satorra, and W. M. Van der Veld. 2009. “Testing Structural Equation Models or Detection of Misspecifications?” Structural Equation Modeling: A Multidisciplinary Journal 16 (4): 561–582. https://doi.org/10.1080/10705510903203433.
- Shannon, B., and S. J. Smith. 2015. “‘A Lot More to Learn Than Where Babies Come from’: Controversy, Language and Agenda Setting in the Framing of School-based Sexuality Education Curricula in Australia.” Sex Education 15 (6): 641–654. doi:10.1080/14681811.2015.1055721.
- Smith, T. D., and B. F. McMillan. 2001. “A Primer of Model Fit Indices in Structural Equation Modeling.” Paper presented at the annual meeting of the Southwest Educational Research Association, New Orleans. https://files.eric.ed.gov/fulltext/ED449231.pdf.
- Vagias, W. M.. 2006."Likert-type scale response anchors." Clemson International Institute for Tourism & Research Development, Department of Parks, Recreation and Tourism Management. Clemson University. Accessed March 15, 2019. http://media.clemson.edu/cbshs/prtm/research/resources-for-research-page-2/Vagias-Likert-Type-Scale-Response-Anchors.pdf.
- Walter, H. J., K. Gouze, and K. G. Lim. 2006. “Teachers’ Beliefs About Mental Health Needs in Inner City Elementary Schools.” Journal of the American Academy of Child & Adolescent Psychiatry 45 (1): 61–68. doi:10.1097/01.chi.0000187243.17824.6c.
- Watson, D., C. Emery, P. Bayliss, and M. Boushel. 2012. Children's Social and Emotional Wellbeing in Schools: A Critical Perspective. Bristol: Policy Press.
- Williams, B., T. Brown, and A. Onsman. 2010. “Exploratory Factor Analysis: A Five-step Guide for Novices.” Australasian Journal of Paramedicine 8 (3): 1–13. doi:10.20982/tqmp.09.2.p079.
- Zanna, M. P. 1990. “Attitude Function: Is it Related to Attitude Structure?” In Advances in Consumer Research Volume 17, edited by M. E. Goldberg, G. Gorn, and W. Pollay, 98–100. Provo, UT: Association for Consumer Research.