
 ?Mathematical formulae have been encoded as MathML and are displayed in this HTML version using MathJax in order to improve their display. Uncheck the box to turn MathJax off. This feature requires Javascript. Click on a formula to zoom.
ABSTRACT
We examine trends in innovation output for two highly ranked innovative countries: Finland and Sweden (1970–2013). Our novel dataset, collected using the LBIO (literature-based innovation output) method, suggests that the innovation trends are positive for both countries, despite an extended downturn in the 1980s. The findings cast some doubt on the proposition that the current stagnation of many developed countries is due to a lack of innovation and investment opportunities. Our data show that Finland catches up to, and passes, Sweden in innovation output in the 1990s. In per capita terms, Finland stays ahead throughout the period. We find that the strong Finnish performance is largely driven by innovation increase in just a handfull of sectors, but is not restricted to few companies. Both countries saw a rise in innovation during the dot-com era and the structural changes that followed. Since 2000 however, Sweden has outperformed Finland in terms of total innovations, especially in machinery and ICT, while the Finnish rate of innovation has stabilised. We suggest that these patterns may be explained by different paths of industrial renewal.
1. Introduction
Innovation and industrial renewal is widely considered the panacea for stagnant economic growth, unemployment, and other societal challenges. Stimulating innovation is therefore considered a top priority among global policy makers. This emphasis has been strengthened in view of the poor economic performance since the global economic crisis that started in 2008.
A salient feature of the European political debate in the aftermath of the crisis has been discussions about how to revive economic structures to improve competiveness and resilience on the global arena. Special attention has been paid to the manufacturing sector, which while employing less people still is considered the backbone of the European economy, responsible for about 80% of exports (Eurostat). Against this background, the European Commission (Citation2014) is working toward an ‘industrial renaissance’. In relation to the Innovation Union initiative, the Commission recently suggested that the European Union is facing a situation of ‘innovation emergency’ as growth rates have plummeted.Footnote1 Concomitantly, national governments throughout the EU have launched manufacturing renewal programmes.
A number of outlooks on the future of innovation and economic growth have been proposed in recent years, some optimistic (Brynjolfsson & McAfee, Citation2011; Eichengreen, Citation2015; Mokyr, Citation2014) and some less optimistic (Gordon, Citation2016; Kasparov & Thiel, Citation2012). Two important components for a continued discussion in this area are a better understanding of a country's rate of innovation and precise empirical measurements of long-term innovation trends.
The purpose of our paper is twofold: First we contribute to the debate about measuring innovation by comparing, for the first time, datasets of the actual innovation output of two countries, compiled using the literature-based innovation output approach (LBIO; see Kleinknecht & Bain, Citation1993). The achieved method can be useful for other researchers who wish to use object-based data collection approaches.
Second, we contribute to the debate about long-term innovation trends by exploring the innovation performance of the manufacturing sectors in Sweden and Finland (1970–2013), two countries that are recurrently ranked among the most innovative economies in the world. For R&D to GDP ratios Sweden and Finland are at the top in the world, both over 3% in 2014. They are also almost on par, with 3.17% for Finland and 3.16% for Sweden. Another, more complex composite innovation index is the Summary Innovation Index SII, based on 25 indicators related to innovation and sums the average score on these 25 indicators. The SII suggests that that Sweden is a bit ahead of Finland, but both of them are among the top innovative European countries (European Commission, Citation2017). Our study sheds light on whether or not the innovation trends in these two countries taper off or not. We explore the way renewal and structural change is reflected in the innovation output by way of a sectoral decomposition using a Logarithmic Mean Divisia Index, especially focusing on the role of Information and Communication technology (ICT).
Although 40 years of data from two small countries cannot address the issue of a long-term global increase or decrease in innovation, it can nonetheless contribute to the debate on recent trends in technology and whether there is indeed an innovation emergency. The countries in our study are at the technological frontier and should, as such, exhibit effects of either increased technological opportunities or exhaustion thereof.
Innovation has long been considered the key force behind wealth generation and improvements in welfare since the industrial revolution. But, since recent studies question the outlook for continued improvement in innovation rates, the question arises: are we in for an inevitable slowdown?
There are two conflicting schools of thought regarding long-term innovation trends. One predicts continuous innovations, perhaps even at an increasing rate, while the other suggests major innovations will disappear and future innovation rates will be considerably slower. New growth theorists, who regard the stock of knowledge, and thus the source of innovation, as continuously increasing, embrace the first view. In the most optimistic formulation, knowledge has a direct and strong effect on growth, since it can be shared without being exhausted (Grossman & Helpman, Citation1991, Citation1994; Romer, Citation1986). However, the observation of constant growth rates despite increasing investments in R&D has tempered this view, with some scholars now claiming instead that today's innovations tend to replace outdated ones (rather than create ‘new’ ones), thus casting doubt on the subsequent and positive effect on growth (Aghion & Howitt, Citation1998). Jones (Citation1995) has provided empirical evidence that economic growth rates did not increase proportionally to the R&D investments in the US economy over several decades. Recently, Bloom, Jones, Van Reenen, and Webb (Citation2017) have found that research productivity declines sharply for a large number of industries and technologies. Hence, maintained growth levels require ever increasing R&D investment.
Other scholars take a similarly optimistic position and argue that we find ourselves at a historical inflexion point, where innovations in nanotechnology and artificial intelligence are about to transform society drastically (Brynjolfsson & McAfee, Citation2014; Kurzweil, Citation1999, Citation2005, Citation2013). Kurzweil predicts, for example, that by 2030 nanotechnology will have defeated most illness and that people will have personal relations with robots. Brynjolfsson and McAfee (Citation2014) view innovation as a process of recombination (Weitzman, Citation1998), where innovations continually yield possibilities for further advancement. In their view, the problem is not lack of technological opportunities today, but rather limited capabilities to exploit them.
The second, more pessimistic view is that we are facing an inevitable slowdown. Notably, Gordon (Citation2012, Citation2016) argues that most of the low-hanging technological fruits have already been picked and that the ICT innovations of the last 40 years have had a less profound effect on economic growth than those in electrical and combustion engineering in the past. Gordon backs his claim by referring to American labour productivity, which peaked in the 1950s. Cowen (Citation2011) shares Gordon's pessimistic view that the world is facing sustained stagnation and that this explains the slow growth and employment trends in rich countries, which has been particularly affected by the financial crisis in 2008.
Some studies suggest that the source of these dismal economic outlooks can be linked to the rate of innovation. Huebner (Citation2005) argued that there has been a decline in patents since 1916 and in major innovations since the 1870s. Vijg (Citation2011) has argued that ‘peak innovation’ occurred in the 1970s. Recently, a study by Dong, Li, Cao, and Fang (Citation2016), pooling several sources of milestone innovation and science breakthroughs, argued for a global ‘peak innovation’ in the 1920s. Using similar sources, however, Kurzweil (Citation2005) found an accelerating rate of milestone events.
Thus, our paper addresses three research questions (RQ) related to trends in significant innovation:Footnote2
RQ1: How can we measure significant innovations consistently over time and across countries?
RQ2: How do innovation counts evolve in Finland and Sweden 1970–2013?
RQ3: What sectors are driving the innovation patterns in Finland and Sweden? How important was ICT?
The paper is structured as follows: section 2 deals with the LBIO method and the data we have collected for the comparative work between Finland and Sweden 1970–2013. Section 3 outlines the historical background on innovation patterns in Sweden and Finland. Section 4 presents the overall innovation trends, the sectoral patterns and a sectoral decomposition of the innovation trends. Section 5 discusses the results and policy implications and section 6 concludes.
2. The literature based innovation output method
In order to monitor and analyse innovation trends over time and across countries it is relevant to have a consistent indicator that captures what we want to measure. Optimally, it would capture only important (significant) innovations. This study explores the possibility of using literature innovation based innovation output (LBIO) data for the measurement of significant innovation output trends over a period of 40 years (1970–2013) (Coombs, Narandren, & Richards, Citation1996; Kleinknecht & Bain, Citation1993; OECD, Citation2005).
The LBIO method is based on the identification of an innovation in the editorial section of valid publications. Hence, the unit of observation is the innovation and not the innovating firm, which is often the case in other survey approaches. We consider this to be a more objective indicator than asking the firms themselves about their own innovation performance. Moreover, the LBIO indicator captures actual innovation output rather than input to the process, e.g. R&D. The indicator also differs from patents, since not all innovations are patented, and not all patents result in innovations (for a discussion of patenting propensity, see e.g. Arundel & Kabla, Citation1998; Cohen, Nelson, & Walsh, Citation2000; Fontana, Nuvolari, Shimizu, & Vezzulli, Citation2013).
R&D, patent data and the firm focused approach such as Eurostat's Community Innovation Survey (CIS), have largely dominated the innovation research scene since the 1960s. CIS is self-assessed by the firms themselves, which lends itself to criticism for possibly overstating innovativeness. However, the LBIO approach has gained traction starting in the 1990s (Acs & Audretsch, Citation1990; Alegre-Vidal, Lapiedra-Alcamí, & Chiva-Gómez, Citation2004; Coombs et al., Citation1996; Flor & Oltra, Citation2004; Grawe, Citation2009; Greve, Citation2003; Kleinknecht & Bain, Citation1993; Palmberg, Leppälahti, Lemola, & Toivanen, Citation1999; Saarinen, Citation2005; Santarelli & Piergiovanni, Citation1996; Sjöö, Citation2014; Van der Have, Saarinen, Pesonen, & Rilla, Citation2009; Villar, Pla-Barber, & Alegre, Citation2012; Walker, Jeanes, & Rowlands, Citation2002; Taalbi, Citation2014, Citation2017a, Citation2017b).
Data collection through the LBIO method requires extensive reading of trade journals, technical periodicals, and/or other industry-relevant publications. It is far more expensive than collecting CIS data and is available only for Sweden and Finland over the study period. To ensure validity the researcher must apply an appropriate filter for both the journals to review and the relevant section of the journal. Some approaches screen only product announcement sections (sometimes called Product News) (see e.g. The Futures Group in Edwards & Gordon, Citation1984) while others such as Saarinen (Citation2005) consider all sections of the journals (but excludes pure advertisements and product announcements).
A key assumption underlying the LBIO method is a robust selection process by journal editors, who must sort through a plethora of incremental improvements that characterise many industries. That is not the aim of this study. Incremental innovations are numerous and to collect all of them would be tantamount to collecting enormous amounts of product catalogues. Since only a portion of all innovations are reported in edited articles in journals, LBIO assumes that those that appear have been considered important enough to include by editors. This suggests that an LBIO sample tends to capture notable industry developments.Footnote3 This allows us to trace the locus of for example notable technological advances, the premiere motor of industrial renewal. Other advantages are found in the wealth of information about an individual innovation that can be collected from journals: e.g. what the innovation is about; its history and detailed biographies of the driving forces of innovation (see also Taalbi, Citation2017a, Citation2017b). By relying on independent journals and periodicals a number of disadvantages associated with survey studies can be avoided, most notably secrecy and non-response biases; issues related to construct validity and self-reporting; and the reliance on firm representatives. LBIO data can be collected without burdening firms to answer surveys. Further, the innovations captured are not influenced by firms seeking to appear more innovative than they actually are. Furthermore, a LBIO indicator enables the construction of longitudinal datasets and provides more reliable information compared to the memories of firm representatives or industry insiders in terms of chronicling innovation. The close to real-time design makes it a suitable method for capturing innovations that actually turned out to be successful as well as those that proved less successful (the latter are easily forgotten but nonetheless important to study). Finally, this approach captures innovations from micro-firms, which are otherwise missed since they tend to fall below the customary cut-off points used in most innovation and R&D surveys (e.g number of employees).Footnote4
The major limitations of LBIO data are related to the choice and characteristics of journals, their availability and funding by the industry, and the degree to which a journal's content represents the innovation activity and technological development of the industry covered. A central issue is the varying tradition in reporting innovation across industries. Such differences may explain why van der Panne (Citation2007) found that in comparison to Dutch CIS results, innovation counts in the same country often missed, or underestimated, innovation in industries such as food and beverages, primary metals, wood products, textiles, and furniture. One might suspect the innovation count to increase in tandem with the number of journals published, but this is only likely up to a point where returns to the inclusion of yet another journal start to diminish and data are saturated. Another concern is that small or nascent industries may not have their ‘own’ trade journal, but this could be dealt with through the inclusion of general technology journals or those with a focus on emerging technologies. Because firms are more likely to share information about new products rather than in-house process innovations, LBIO datasets have a product innovation bias. This bias is particularly unfortunate when it comes to capturing innovation in industries where process innovations are relatively more important than product innovations (i.e. low-tech industries) (Pavitt, Citation1984). Service innovations are also likely to be underreported because they are often customised to an extent that impairs their ‘news value’. This is a regrettable flaw given that one of the major trends in the manufacturing sector is the increasing role of services in business models (Eggert, Thiesbrummel, & Deutscher, Citation2015). A few studies have, however, shown it to be applicable to non-manufacturing sectors: Grawe (Citation2009) studied logistic innovations and Walker et al. (Citation2002) public services.
Some studies argue that LBIO datasets are likely to be skewed towards small firm innovation as large firms use other channels to communicate the existence of a new innovation (Acs & Audretsch, Citation1990; Coombs et al., Citation1996; Santarelli & Piergiovanni, Citation1996). However, other studies by Saarinen (Citation2005) and van der Panne (Citation2007) find no such bias.
Controlling for bias across industries and journals is an obvious remedy. For example, one approach is to cross-check the innovation ‘catch’ in a certain industry through the reading of two or multiple journals. Another is to ensure scrutiny of the editorial mission and any potential changes therein. We describe the measures taken in our study to control the comparability of the datasets in the next section (See also Supplementary Information SI, which is published online).
2.1. The LBIO dataset of this study
In this study, we use a dataset that builds on and develops two existing datasets: Sfinno (Finnish innovations) and Swinno (Swedish innovations) (see Palmberg et al., Citation1999; Saarinen, Citation2005; Sjöö, Citation2014; Taalbi, Citation2014, Citation2017a, Citation2017b; Van der Have et al., Citation2009). Two separate teams of researchers compiled the Sfinno and Swinno datasets over a period of almost twenty years.Footnote5 The two teams have followed the same basic methodology and have met regularly since the start of the Swedish project in 2008. Nonetheless, harmonising the two datasets demanded a series of revisions (see Supplementary Information, SI), the most important of which was to ensure that no product announcement was included, since these are considered to be pure advertisements by the companies and hence do not have the status of being deemed important enough to write an edited article about. The innovations that are included in our dataset are deemed to be significant in the sense that they were included in the journals by assessment of their potential importance for the industry by editors of these journals. This sharpening of the criteria for inclusion resulted in a deletion of about half the original Finnish innovations and one third of the Swedish innovations, which only had a product announcement linked to them.
The remainder of this section describes the common ground resulting from this joint reconciliation process, and more details of the process can be found in SI.Footnote6
The datasets contain innovations rather than inventions, i.e. only products, processes, and services that were already commercialised. If not explicitly stated, the publication year of the journal was taken to proxy the commercialisation year. We include only innovations where the article disclosed details about novelty and the name of a Swedish or Finnish firm. The innovations were coded on a five-digit level using NACE Rev. 1.1 (2002). The data were checked for duplicates as several innovations occurred in more than one article. The final merged datasets contained ca 6,800 innovations, of which 2,700 were developed in Finland and 4,100 in Sweden 1970–2013.
We conducted interviews with trade associations and library personnel before selecting relevant journals. We selected journals based on the following criteria: (a) inclusion of an independent editorial board; (b) a mission to report on innovation and technological development; and (c) a focus on either Finland or Sweden. A sample of fifteen journals in each country met the criteria and was assumed to reflect the industrial structure of each country (for a full list see SI). For instance, since the pulp and paper industries are important in both countries, we include both a Swedish and Finnish pulp and paper journal. Two journals with a general technology focus were included for both countries. In addition, the majority of the journals have extensive publication histories, which suits the LBIO methodology.
Interviews with present and former editors were undertaken in both countries to rule out any substantial changes in the mission or character of the journals. In these interviews, journal editors stated that their publications captured all pertinent technology events in their respective field. This is confirmed by the fact that, in most journals, the majority of issues do not actually contain innovations (see SI). This matters for the comparability between countries, as the number of innovations collected will depend on the number of journals screened. Hence, it could be argued that having the same number of journals for two different sized countries would create an upward bias in number of innovations per capita for the smaller country (here Finland). However, the number of significant innovations in the two countries is fairly proportional to their population size, although the temporal pattern differs, with relatively more innovations per capita later in the period in Finland. Nevertheless, a sensitivity analysis is available in SI, where the largest major general technology journal in Finland – which is responsible for 30.3% of the Finnish innovations – is removed. Even when excluding this journal, the same trends and overall patterns are observed.
Our conviction is that besides trends, we can also compare levels of significant innovations between the countries. There are two principal reasons for this. First of all we have conducted interviews with journal editors both in Finland and Sweden and they all claim that they select all important innovations they can find. Consequently, they do not select among a large amount of potential candidates and dismiss some important innovations. Second, and supporting this claim by editors, is that most journal issues do not contain a single innovation count by our criteria (innovation focused edited article, or an article that gives an overview of important innovations). In practice, the outcome of our study supports that innovation levels can be compared as well. There is no a priori reason to believe that the population of one of the countries should be more innovative than the other. And indeed we find that per capita the two countries are roughly equally innovative over this half century.
3. Background of Finnish and Swedish innovations
As neighbouring countries with strong historical and cultural ties (Finland was part of the Swedish Kingdom until 1809), it is not surprising that policy makers in both countries may wish to benchmark their performance to that of their Nordic neighbour. Finland and Sweden both have innovation systems with a strong coordinating state agency that stimulates innovation by providing funds as well as facilitating collaboration networks; Tekes for Finland and Vinnova for Sweden.Footnote7
Different innovation indicators give different answers to whether Finland or Sweden has been more innovative in recent times. According to European Patents per unit of GDP, Finland was slightly more innovative 2000–2005, but then fell behind Sweden 2006–2010 (see graph S4 in SI). But differences relative to GDP are relatively minor.
R&D to GDP ratios and the Summary Innovation Index suggest that both countries are among the most innovative countries in Europe. A more complex composite index, the Summary Innovation Index (SII) of the European Innovation Scoreboard, is based on 25 indicators related to innovation and sums the average score on these indicators.Footnote8 The SII suggests that Sweden is a bit ahead of Finland, but that both countries are among the most innovative countries in Europe.
Hence, we get the picture that both countries are rather similar in innovation efforts and performance, with Sweden being placed slightly above Finland in recent years. Will our new indicator of innovation output over a longer period in time change this image?
Our innovation output indicator goes back to 1970 for both countries. In order to assess the long-term innovation trends and whether these make any sense from an economic history perspective, it is necessary to know something about the development process and industrial transformation that shaped Finland and Sweden, even in the decades before 1970.
Both countries’ paths to become global innovation leaders were marked with periods of vigorous growth of new industries and obstacles to growth, but the countries followed markedly different paths of economic development. Sweden industrialised in the late nineteenth century with impressive GDP per capita growth during the first half of the twentieth century, while Finland trailed far behind as a mostly agrarian economy at the end of the Second World War. The Swedish production structure escaped the ravages of war and could respond to the surging demand after the peace in 1945. The strong growth in the 1950s and 1960s was led by machinery, metal and chemical industries, while the forest-based traditional industries, like saw mills, declined in relative importance, although paper exports continued to grow. Textiles and food production also declined (Schön, Citation2010). In Finland, the post-war period was characterised by reconstruction, resettlement and payment of war reparations to the Soviet Union. There was significant political and economic pressure on engineering industries and wood products to increase exports in order to finance the war reparations (Hjerppe, Citation1990; Myllyntaus, Citation1998).
Finland narrowed the economic gap to Sweden and other OECD countries in the 1950s as manufacturing passed agriculture as the biggest sector (measured as share of GDP) in a process of rapid industrial growth and urbanisation (Hjerppe, Citation1989; Kokkinen, Jalava, Hjerppe, & Hannikainen, Citation2007; Svanlund, Citation2010). During the 1950s and 1960s the Finnish industrial basis became more diversified, as metal and engineering grew in the economy. Still, forest-based industries remained the leading manufacturing sector, which not only generated export income, but also stimulated demand for engineering companies to develop machinery and solutions for the forest industry.
The oil crisis of the 1970s brought to a halt the rapid expansion of the 1950s and 1960s. International demand for Swedish export products fell and large parts of the manufacturing sector faced profitability problems, which led to calls for renewal. The shipbuilding and textile industries were hit hard and forced to close. There is considerable debate about the role of different drivers in this process of renewal and the resumed productivity growth (for overviews see for instance Sjöö, Citation2016; Taalbi, Citation2014). In Finland, the effects of the oil crisis were mitigated by a series of currency devaluations and bilateral trade with the Soviet Union, which enabled export of manufactured products in exchange for Soviet oil. Diversification of the Finnish production structure continued during the 1970s. While the forest sector products accounted for the largest share of exports, metal, machinery and chemical industries also accounted for substantial shares. In addition, the electrical and electronics industries, which had started to grow in the late 1960s, made a real breakthrough during the 1970s (Hjerppe, Citation1989; Myllyntaus, Citation1998; Saarinen, Citation2005), putting the Finnish industry in an advantageous position to forge ahead.
Since the mid-1970s, economic growth in both countries was driven primarily by ICT innovations. In Sweden, ASEA/ABB and SAAB were important providers of electronics/automation technology while Oy Strömberg AB (acquired by ASEA in 1987) and Valmet Oy were important automation companies on the Finnish side.
The wider diffusion of ICT in the 1970s meant broad complementarities, changing the composition of industry so that pharmaceuticals, biotechnology, computers and software increased their share of output. ICT also spurred productivity increases in old traditional heavy industries by process computers and the fine-tuning of production. The service sector increased its share of employment and value added, with business related services becoming ‘slowly but surely’ more efficient due to personal computers, even though it took quite some time to realise this productivity potential (Schön, Citation2000; Solow, Citation1987).
Both Finland and Sweden were hit by a serious recession in the early 1990s. Between 1990 and 1993 GDP fell by 13 percent in Finland and 5 percent in Sweden while stock and housing market prices fell drastically: 50% in Finland and 25% in Sweden. Impacts in Finland were more significant due to the loss of export markets when the Soviet Union collapsed in 1991, while internal factors and policy decisions strengthened and exacerbated the bust (Jonung, Kiander, & Vartia, Citation2009; Korkman & Suvanto, Citation2015). However, since the early 1990s Finland and Sweden have benefitted markedly from the rapid growth of the mobile telecommunications market across the globe. The strong international demand for telecommunication products and solutions were reflected in changes in industry structures: electrical engineering and electronics industry became the largest sector measured by production and export in Finland by the turn of the century (Rouvinen & Ylä-Anttila, Citation2003). Sweden's exports remained more diversified, with machines and vehicles carrying more weight than electronics equipment. Further, the traditional heavy industries like paper and pulp, steel and chemicals remained very important.
While the period from 1970 to 2000 was a period of Finnish catch-up, the period since the dot-com crisis has revealed a renewed gap between Sweden and Finland. In 1970, Sweden's per capita income was 32% higher, but by 2000, this gap was only 5% higher. However, this process started to reverse itself starting in 2000: by 2010 income was 8% higher in Sweden, but by 2015 it was 17% higher, suggesting slower growth in the Finnish economy. The considerable specialisation of the Finnish ICT industry, along with changes in global competition and the value chain positions made the Finnish economy and ICT sector more vulnerable than in Sweden during the dot-com crisis. The value of exports also dropped in Finland (Bank of Finland Bulletin, Citation2015). Finland did not do particularly well after the international financial crisis (2008–2010), and has had more sluggish growth rates than Sweden.
The data presented in this paper shed new light on economic growth, crises and renewal as spelled out in the aggregate and sectoral innovation output of the two countries. But for our LBIO innovation indicator to make a useful contribution, it should somehow reflect both Finland's ‘catch-up’ to Sweden, as well as the increasing role of ICT innovations.
4. Results
We present overall innovation trends in absolute terms, per capita, and in relation to R&D (Section 4.1). Next, we consider innovation development across different sectors, in particular the impact of ICT on overall trends (Section 4.2 and Section 4.3) by means of a structural decomposition.
4.1. Overall innovation trends
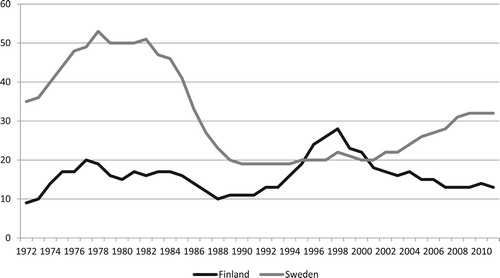
and present the overall patterns found in the data, which show that the number of innovations increase over time for both countries. This is not surprising given growth in both population and the economy. In Finland, this increase has been more or less steady, whereas in Sweden, two distinct growth periods – first in the 1970s and then again in the 1990s – are separated by a period of declining innovation. In terms of absolute numbers, Finland caught up with Sweden in the mid-1990s. The convergence took place as the annual average number of innovations in Finland increased from 40 during the 1980s to 64 during the 1990s, while the Swedish average dropped from 99 to 71 during the same period (). In the early 2000s, both countries were on par, despite Finland being a smaller economy. After 2000 the Finnish innovation count stagnated in absolute terms, whereas the Swedish upward trend continued.
Figure 1. Significant manufacturing innovations in Finland and Sweden 1970–2013, absolute numbers (dotted lines) and five year moving averages (full lines).
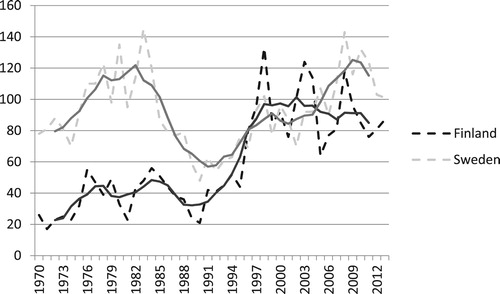
Table 1. Number of innovations: Total count and annual averages.
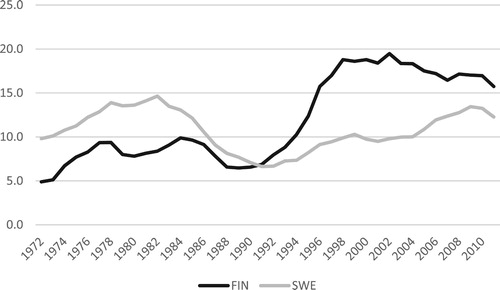
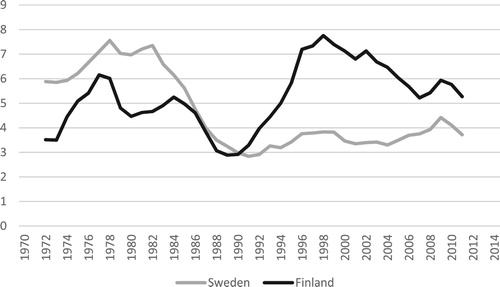
Per capita comparisons adjust for the size differences between the two countries and reveal that the Swedish manufacturing sector was, in general, more innovative during the period 1970–1990, while Finland was more innovative between 1990 and 2013 (). shows that in terms of innovativeness, Finland caught up with Sweden in 1991 and has remained ahead, although the gap is shrinking: after a dismal performance in the 1980s, the Swedish manufacturing sector has steadily become more innovative.
Figure 2. Innovations per capita (million inhabitants) in Finland and Sweden, 1970–2013 (five year centred moving averages).
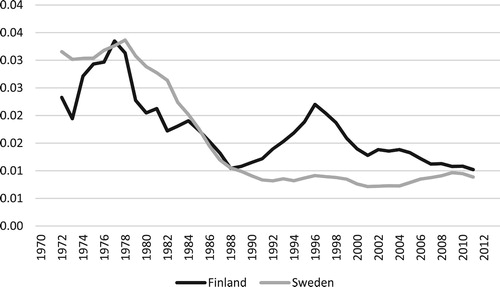
An alternative comparison – how innovation output compares to the total flow of R&D resources- is given in , which clearly suggests a downward trend, with the exception of the 1990s in Finland. This may suggest falling innovation output relative to investment in the innovation process. The result also fits well with previous studies for Sweden that discusses the so-called ‘R&D-to-economic-growth’ paradox and finds that although the falling R&D-to-value-added trend is present on the aggregate level, it is only evident in the fast-growing sectors, and therefore not an obstacle to economic growth (Ejermo & Kander, Citation2011; Ejermo, Kander, & Svensson Henning, Citation2011).
Figure 3. Ratio of innovations to R&D (million US dollars 2010) in Finland and Sweden, 1970–2013 (five year centred moving averages).
In the last couple of decades, Finland has remained ahead of Sweden in per capita terms, although our dataset extends only to 2013. This picture differs somewhat from other innovation indicators like patents and the Summary Innovation Index, which both place Sweden slightly ahead of Finland (Edquist & Zabala-Iturriagagoitia, Citation2015).
4.2. Sectoral trends and the role of ICT
We are interested in the sectoral performance that makes up this aggregate image of innovations, especially the role of ICT. We have consequently divided the innovations into four broad subcategories: (1) Metals and machinery, (2) ICT, (3) Industry except metals, machinery and ICT and (4) Other sectors (mainly services, agriculture, forestry and mining).Footnote9 In cases where we discover that finer subcategories reveal interesting findings, we disaggregate the data.
A first impression of the sectors that drive overall patterns is given in and . These figures compare our four industry categories’ contribution to the change in average innovation counts (5-year centred moving averages), represented by the tallest bars.
Figure 4. Contribution to growth in innovation counts (based on 5 year centred moving averages), Sweden.
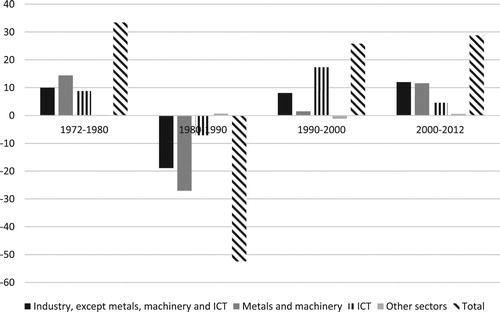
Figure 5. Contribution to growth in innovation counts (based on 5 year centred moving averages), Finland.
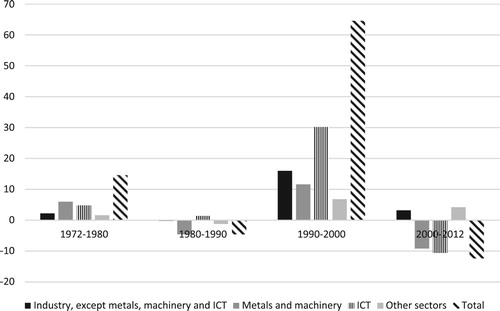
The Swedish pattern of innovation shows a strong decline in the 1980s, a recovery in the 1990s, and a continued increase from the mid-2000s. The Swedish decline between 1980 and 1990 (−52.4 innovations) can be attributed mainly to the metal and machinery industries (−27.1). Other industries with a negative development were chemicals (−4.5) and transport equipment (−4.9), both found in the Industry, except metals, machinery and ICT category. The recovery between 1990 and 2000 (25.8) is first and foremost explained by a surge in ICT innovation (17.3). Metals and machinery did not play a role for the recovery, but Industries, except metals, machinery and ICT made a sizable contribution (8). After the bust of the dot-com bubble in 2000 however, other industries, mainly chemicals (8.8) and machinery (8.0), have stood for the continued increase (28.8). So a diversification and industrial renewal of the more traditional industries was mainly responsible for the Swedish positive development after 2000.
A strong Finnish development took place in the 1990s, when the average count of innovations increased from 32.8 (1990) to 97.4 (2000), almost half of which is attributable to ICT (30.2). However, Metals and machinery (11.6), and certain Other industries such as transport equipment (3,4) and chemicals and plastics (3.0) made sizeable contributions. The new millennia saw poor performance in both Metals and machinery and ICT, a development that was mainly counteracted by innovations emanating from Other sectors. This differed from the Swedish case, where Metals and machinery saw a renewal and comeback after 2000.
4.2.1. The information and communication technology sector
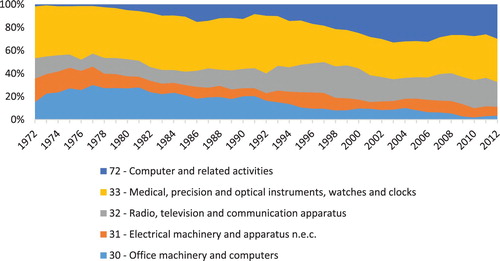
As noted, two sectors were particularly influential in shaping overall innovation patterns: the ICT and the metals and machinery sectors. The ICT sector () accounts for a sizeable share of innovations in both countries. Overall, the medical, precision and optical instruments (including devices and solutions for measurements, tests and industrial process control) comprise the largest product category responsible for 38 and 22 percent of ICT innovations in Sweden and Finland, respectively. Radio, television and communication equipment and devices represent the second largest product category in the Swedish data (19%), whereas in Finland it only accounts for 4%. The Finnish ICT innovation output is dominated by software products (NACE class 72), accounting for 22% overall, and 45.7% in the period 1990–2013. The structure of the sector's output has changed over the course of time in both countries, generally reflecting a shift from hardware to software ( and ). It is worth noting that the patterns observed are generic, rather than driven by a few (large) firms. In Sweden, Ericsson was only responsible for 86 out of the 1621 ICT innovations (5.3%). In the case of Finland, Nokia's share of the ICT innovations in our sample of significant innovations is only 4.8%.
Figure 6. Innovations in the ICT sectors in Finland and Sweden 1970–2013, five year centred moving averages.
Note: The ICT sector consists of NACE code: 30–33, 72.
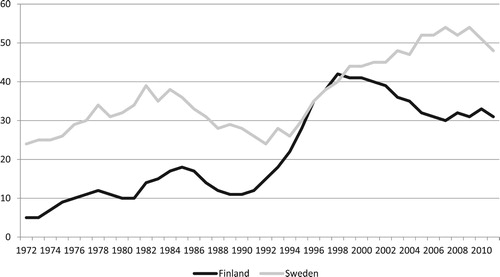
Figure 7. Distribution of ICT innovations by product class (NACE 2002, 5 year centred moving averages), Finland.
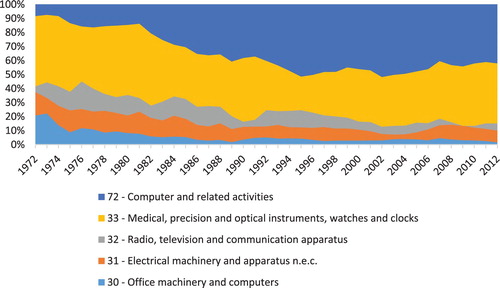
Figure 8. Distribution of ICT innovations by product class (NACE 2002, 5 year centred moving averages), Sweden.
4.2.2. The metals and machinery sector
Thus, metal and machinery innovations account for a large portion of the overall innovation count: between 1970 and 2013, metals and machinery produced the largest number of innovations in both Finland and Sweden (on average 25 and 26 percent of the annual innovation count, respectively). The drastic Swedish decline in the 1980s and some of the Finnish catch-up in the 1990s owe to changes in the innovation output of this sector. The decline of metal and machinery innovations in Sweden during the 1980s is striking (). The Swedish numbers plummeted from 35 in 1970 to 20 in 1990, and did not recover again until during the 2000s. Finland, on the other hand, did not experience high variation in the innovation counts, but did experience a marked increase in the 1990s. Hence, while the metal and machinery industry has been a stable component of the Finnish innovation activity, it accounts for a large part of the Swedish decline in the 1980s, in line with the structural decline of much of the traditional industry in Sweden.
Figure 9. Innovations in Metals and machinery sector in Finland and Sweden, 1970–2013 (5 year centred moving averages).
Note: Consists of NACE code: 27–29.
4.3. Structural decomposition
We have observed the pivotal role played by ICT and the metals and machinery industries, in keeping with the broader industrial history of the two countries. In order to further investigate the role of ICT and metals and machinery, we estimate the source of change in innovation counts on the aggregate, structural and industrial level. We do this by relating innovation patterns to economic activity. We assume that the level of innovation intensity in an economy (innovations per unit of GDP) is an indication of the level of industrial renewal, in the sense of the creation of new product combinations. Although we cannot infer a causal mechanism, we maintain that a higher ratio of innovation to value-added indicates the exploration of new opportunities, whereas a low ratio indicates the exploitation of current assets (compare March, Citation1991; Utterback, Citation1994). A higher overall innovation intensity in the economy can be achieved in two ways: (1) the innovation intensity in individual industries increases, while the structure of the economy remains the same, or (2) the structure of the economy changes so that industries with high innovation intensity become relatively more important. Industrial renewal can thus result from an increase in innovation intensity within particular industries or from structural changes between industries. We call the former a technical component and the latter a structural component. In this section, we explore the extent to which these two components contribute to the change in innovation intensity (industrial renewal) in each country. The proposition that the catch-up process in Finland is more dependent on ICT would predict a stronger structural component.
In practice, when comparing innovation counts with the value added across industries, we can either use the product category of the innovation per se, or the industry category of the innovating firm. The first comparison is sound if we wish to include firms’ diversification to new industries as an indicator of exploration of new options. The latter is preferable if we wish to compare the incomes generated from innovation in a particular industry. Even so, a single innovation may generate income streams in several industries and firms and not just in the innovative firm itself. With our analytical purpose we have chosen to examine the product category of the innovation. However, we provide a sensitivity analysis (see SI) where we replicate the results using the category of the innovating firm and show that there is no significant difference in the main results.
The overall innovation intensity trends (innovation/GDP) largely resemble those of innovation per capita (). Minor discrepancies pertain to the increase of Swedish innovation intensity from 1990s onwards, which is less pronounced than the increase of innovations per capita. For Finland, the innovation intensity in the 2000s indicates less industrial renewal than if we look only at the innovations per capita. Generally, we find falling innovation intensities in Finland in the 1980s and after 2000. Sweden saw a severe drop in the 1980s while during other periods, the intensity increased modestly.
Figure 10. Innovation intensity in Finland and Sweden 1970–2013 (innovations/constant million dollars of GDP, 2007 year prices), five year centred moving averages.
We also observe that innovation intensity varies greatly between industries. and show the innovation intensity for 12 industries and the total economy for the benchmark years 1972, 1980, 1990, 2000 and 2011, based on five year moving averages. The tables show that ICT is by far the most innovation intensive industry in both countries. This implies that when ICT takes on a more prominent role in the Finnish and Swedish economies, the overall innovation intensity increases. Hence, the ICT revolution was one reason for the strong Finnish catch-up with Swedish innovation counts in the 1990s, a catch-up caused by both increasing innovation intensity and the fact that the industry became relatively more important. In Sweden by contrast, the ICT revolution had already taken off during the 1950s and 1960s (cf Taalbi, Citation2017c), so the sector was larger in 1970 than it was in Finland and innovation intensity was relatively high. During the period, the Swedish ICT industry became less innovation intensive and hence contributed negatively to the overall innovation intensity.
Table 2. Innovation intensity of 12 industries, 5 benchmark years, 5 year moving averages (Finland).
Table 3. Innovation intensity of 12 sectors, 5 benchmark years, 5 year moving averages (Sweden).
Another sector with fairly high innovation intensity is machinery. If this industry becomes relatively less important in the structure of each country's economy it will tend to reduce overall innovation intensity. If, in addition, the industry becomes less innovation intensive, the downward trend will be reinforced. This happened in Sweden in the 1980s. Not only did the industry lose its prominent role within the manufacturing industry, there was also a clear drop in innovation intensity between 1980 and 1990. The innovation levels of the 2000s never reached those of the 1970s and 1980s. The Finnish machinery industry had lower levels of innovation intensity at the outset, saw a marked increase in the 1990s but declined again during the 2000s.
These results indicate that both technical and structural effects contributed to the overall innovation intensity of the two countries. We now proceed to determine the relative size of the two effects. We lend a framework for shift share analysis from Ang (Citation2004, Citation2005) to decompose the average annual increase in innovation output into three effects:
Activity effect (
): The change in total innovation output associated with a change in the overall level of economic activity. A larger economy would normally have more innovations.
Structure effect (
Technical effect (
Formally, for initial year and end year
of a period and 12 manufacturing industries
, we use the overall growth of value added
, the growth in industrial value added shares
and growth in innovation intensities
, to derive.
whereTo ensure comparability across periods we decompose the average annual rate of growth by taking:
The results from the decomposition exercise ( and ) can be read in the following way: the change in the overall innovation intensity can be calculated by adding the structural and technical components. The change in total number of innovations can be calculated by adding the activity, structural and technical components.
The strong Swedish innovation performance of the 1970s is explained by the technical component (TE) (higher levels of innovation intensity within individual industries), and activity change (A) (growth of the total economy). In turn, falling innovation intensities (TE) in the 1980s explain the poor innovation performance of the 1980s. This also suggests that declining innovation intensity was a general feature of the Swedish manufacturing industry, also in ICT (see and ). In fact, innovation intensities (TE) continue to contribute negatively to the total innovation performance (TOT) throughout the studied period. However, from the 1990s onwards, the poor development of the innovation intensities (TE) in Swedish industries was offset by structural changes (S). Hence, the positive innovation trend (TOT) seen during the rest of the studied period is largely explained by the growing importance of innovation-intensive industries such as ICT.
Table 4. Shift share analysis for Finland (logarithms), 12 subsectors, annual average growth rates.
Table 5. Shift share analysis for Sweden (logarithms), 12 subsectors, annual average growth rates.
In the Finnish case, the structural component (S) was the main driver of the positive development (TOT) of the 1970s, although increasing innovation intensity (TE) in individual industries also contributed positively. The structural changes mainly pertain to the inroads made by the innovation intensive ICT industry. Although still positive during the 1980s, the structural component (S) was not strong enough to counteract the negative impact of a sharply declining innovation intensity (TE) within individual industries, so both the total number of innovations (TOT) and the innovation intensity of the economy as a whole (the sum of the structural and the technical components) declined. The strong innovation performance (TOT) of the 1990s was the joint result of increasing innovation intensity (TE) within individual industries and structural change (S). After the 2000s, structural change (S) continued to have a positive impact on the total number of innovations (TOT), but could not offset the declining innovation intensity (TE) in single industries.
Since the structural component was positively contributing to the innovation performance in both countries in the 1990s, the forging ahead of Finland is explained by a growth of the innovation intensity within individual industries that outperformed that of Sweden. At the end of the studied period, both countries seem to have problems with falling innovation intensity within individual industries. In Sweden this trend is balanced by structural change and renewal, while such structural change appears to be absent in Finland.
5. Discussion
The basic results of the comparative analysis of long-run innovation trends in Finland and Sweden convey a general increase in innovation activity over time. However, rather than secular trends, the countries’ general innovation performance is best understood as reflecting both specific processes of industrial transformation as well as general economic development. First, the story of a Finnish catch-up in innovation performance compared to Sweden is perhaps not surprising against the backdrop of empirical research on Finnish economic growth (Hjerppe, Citation1989; Kokkinen et al., Citation2007; Svanlund, Citation2010). We note that the Finnish catch-up occurred mainly during the 1990s, when the country produced a higher number of innovations and was relatively more innovative than Sweden. Meanwhile, the Swedish productivity decline in the second half of the 1970s and the 1980s is matched by a drop in innovation; the subsequent recovery in innovation – driven mainly by ICT – occurred in tandem with a resurgence in productivity growth. Altogether, the Swedish trends seem to correspond well with the country's general economic performance.
The sectoral analysis has revealed how industrial renewal is spelled out in innovation output. Two partly similar and partly different stories emerge from the results of the structural decomposition. Generally speaking, Swedish innovations have largely increased as a consequence of industrial renewal in the sense of structural change since 1990, where innovative sectors have also grown more than other sectors. But up until 1990, structural change played a negligible role, and the number of innovations within each sector grew relatively more as a consequence of overall larger activity in the economy. This speaks to the notion that renewal had already taken place in the postwar era, culminating in the late 1970s. This was followed by a general decline in innovation intensity during the structural crisis of the 1980s, although the decline of metals and machinery and ICT innovation was most noteworthy. Conversely, in the period 1990–2013, we observe a vigorous structural transformation in industries with high innovation intensity. Up until 2000, the structural component was a stronger feature of the Finnish catch-up story, indicating a large role played by ICT innovation. From a historically high level in most Swedish sectors around 1980, innovation intensity has since fallen (the technical component has been negative). In Finland, the structural effect has always been positive, i.e. the sectors with higher innovation intensity have grown more than other sectors. The largest discrepancy between the two countries took place during the 1990s, when the Finnish innovation intensity within the sectors grew rapidly, while it fell in Sweden. After 2000, Sweden has done somewhat better than Finland, and this was partly due to a higher activity effect, or better growth rates in the economy at large, but more so, due to a structural change in Sweden, where innovation intensive sectors have increased more than others. The technical component has continued to be negative in both countries after 2000, which should cause some concern for two nations that want to stay in the innovation lead. It indicates a greater reliance on current assets rather the exploration of new opportunities.
We are now in a position to offer an historical interpretation of the underlying factors behind the observed patterns. First, a strong increase in ICT innovations played a role in both countries, but was of central importance in Finland. In Finland, the increase came in the form of electrical apparatus, electronic components, telecommunication, measuring and optical equipment and software. During the 1980s, a distinct shift towards knowledge-intensive production occurred in Finland; a shift that seems to have laid the foundation for the strong expansion of ICT innovations in the 1990s. The growing importance of the industry was reflected in its increasing share of high-tech products in total exports. In the course of a decade, Finnish electrical equipment, electronics, and ICT services were the largest contributors to export and GDP, a development that was, in large part, driven by the strong performance of Nokia (Lemola, Citation1994, Citation2003).
In Sweden, the bulk of ICT innovations in the early years were focused on exploiting microelectronics for computers and factory automation and were mostly carried out by large firms, e.g. Saab and ASEA (Carlsson, Citation1995; Sjöö, Citation2014; Taalbi, Citation2017a, Citation2017c). ICT innovations did not only account for renewal by way of increasing share of the total innovation output (and the total innovativeness), but it also contributed to the character of innovation in other industries. The increasing sophistication of machinery and equipment innovations during the 1970s was owed largely to the incorporation of microelectronics (e.g. computerised numeric control tools and robots). The expansion of ICT innovations came to a halt in the mid-1980s. This exhaustion can be attributed to several factors affecting investment and the structure of the Swedish ICT industry. One explanation is the emerging emphasis of investment in office and construction, rather than R&D (Schön, Citation2009). Another is the weakening of Sweden's competitive position. During the 1980s the possibilities of realising first-mover advantages neared exhaustion as competition increased from the NICs (Newly Industrialised Countries) as well as from Germany and Italy. The weakening of the domestic computer industry eventually resulted in a shakeout (Eliasson, Citation2001). Meanwhile, the emerging industries surrounding telecommunication and the Internet had yet to come to fruition (which arrived only after the deregulation of telecommunications in 1993). All of these factors likely contributed to the decrease of the ICT innovation counts during the 1980s. In the 1990s, innovation counts went up, despite the severe economic crisis in 1992–1994 (Edvinsson, Citation2005; Jonung, Citation1994) and new firms entered the market in the frenzy that eventually culminated in the burst of the dot-com bubble in 2001.
The new, less frenetic, era meant a reversal of roles as the Finnish ICT sector did not recover from the dot-com bubble in the way their Swedish counterpart did. The Finnish trend is likely a reflection of structural growth problems that emerged through the recession, more specifically the eclipse of the country's electronics and ICT cluster. This was tellingly illustrated by Nokia's failure to claim the smartphone niche against new competitors such as Apple and Google, which resulted in Microsoft's acquisition of the company's phone business in September 2013 (Ali-Yrkkö et al., Citation2013; Holmström, Korkman, & Pohjola, Citation2014). Instead, the Finnish ICT innovations in the studied dataset are mainly software, accounting for 22% overall, but as much as 45.7% in the period 1990–2013. That said, many of Nokia's innovations do belong to this product category. Sweden's ICT industry was also hit by the dot-com crisis, but recovered through a reorientation toward software innovations (famous examples of which include Skype and Spotify).
Secondly, the decline in innovations during the 1980s is a striking feature of the Swedish pattern of innovation, largely attributable to ICT and metals and machinery (). Innovation in the Finnish industries of machinery and equipment did not slump in the same way as it did in Sweden in the 1980s. During the 1970s, the opportunities brought by the advent of cheap microelectronics, coupled with the pressure to counter profitability problems, brought a surge in innovations in traditionally important industries such as machine-tools, forest machinery, but also in basic metals (see Taalbi, Citation2017b). The 1970s and early 1980s saw several ‘world's firsts’ in these industries (Sjöö, Citation2014). The stable count of machinery innovation in Finland may reflect the long and strong standing of such equipment in traditionally dominant Finnish industries like forestry, agriculture, and mining. Other notable contributions to the innovation output was left by industries that produce power and marine technologies and bio-based products (e.g. the pulp and paper industries). The strong performance in the latter category and in forestry related machinery indicates that Finnish incumbents have responded to increasing price competition and falling demand by way of both process and product innovation – a response that was not mirrored on the other side of the Baltic Sea. The 2000s saw somewhat of a revival of the machinery and equipment industry, as well as the basic metals industry. The innovation output of the two industries reflects the headway made into new methods such as additive manufacturing.
6. Concluding remarks
This paper has for the first time presented the results of an ambitious innovation indicator project for two countries, Finland and Sweden, with a consistent LBIO method over the period 1970–2013. Over the entire period the number of significant innovations in the two countries are fairly proportional to their population size, but the temporal pattern differ, and since the early 1990s Finland is relatively more innovative. Broadly speaking, the innovation story fits well with the Finnish ‘catch-up’ to Sweden in terms of economic growth.
This investigation shows that Finland started at a low level of innovation compared to Sweden in 1970, but has caught up during the 1990s. In per capita terms, Finland became more innovative in terms of launching new product innovations and major improvements to existing technologies.
The role of renewal and structural change in each country's economy – as opposed to sector-specific activity – has been surprisingly different between the two countries, especially in some decades. The Finnish catch-up and forging ahead of Sweden mainly took place in the 1990s. This decade demonstrated an equally strong structural effect from the ICT revolution in both countries, but an explanation for the Finnish success can also be found within specific sectors, where many became much more innovation intense, e.g. food and textiles and metals. However, the sector that stood out the most was ICT, which tripled its innovation intensity in Finland during the 1990s, but then saw falling intensity around 2000. In Sweden the ICT innovation intensity peaked around 1980 and then fell.
What can our long-term significant innovation data highlight about innovation levels and trends? Does it support the gloomy perspective of faltering rates of innovation? The picture is somewhat mixed. First, there are no consistent falling trends in absolute levels of significant innovations in Finland or Sweden. In Finland, there is in fact a distinct increase over time. For Sweden, we observe two dinstinct periods of growth and decline. Although the final peak in 2013 ends higher than the original starting point in 1970, there is no clear long-run trend, but rather a ‘long swing’ pattern in the Swedish material. Furthermore, when we look at the innovations per capita there is a sluggish trend in Sweden since the 1970s, and the trend is only somewhat increasing in Finland. More importantly, within many sectors we see worrying signs of long-term falling innovation intensities: Since 1980 for Sweden, and since the 1980s (and again since 2000) in Finland.
We also observed that innovation counts have declined in relation to R&D, suggesting decreasing returns to search since the 1970s. This points to a bottleneck in the rising complexity and intractability of innovation processes, as noted by other authors (Brynjolfsson & McAfee, Citation2011; Strumsky, Lobo, & Tainter, Citation2010). This finding confirms the phenomena of diminishing returns to R&D and that innovation itself is a costly enterprise (Ejermo et al., Citation2011; Bloom et al., Citation2017). This could be because of a roadblock to growth and innovation due to the towering complexity of the search and innovation processes themselves. Despite a long-term dataset, our contribution to this debate should be viewed with caution, as it presents evidence only from two small, albeit innovative, countries. Future studies should additionally investigate the trends of value added, R&D, patents and significant innovations in a consistent way on a sectoral level in a long-term perspective, to advance our understanding of R&D-to-growth paradoxes and the long-term innovativeness of countries. Further, although these innovations are significant enough to be included in our sample (based on their ex ante expected importance), we have not confirmed their significance ex post. We plan to do that by interviews, surveys and expert panels. A pilot interview has already revealed that some of the innovations were ground-breaking in the sense of laying the foundation for a new vigorous company, but most of them were not. If such groundbreaking innovations vary over time, it will shed new light on the technology exhaustion debate.
In addition to the empirical results regarding long-term innovation, an important contribution is the application of a consistent LBIO method, which could be applied to other countries. The methodological considerations of harmonising the two LBIO datasets from Finland and Sweden have underscored the importance of creating a strict definition of what constitutes a significant innovation identifed in a journal and the need for consistency in data collection over time (see SI). Our experience suggests that researchers can avoid data quality problems by focusing on edited articles only and omitting product announcements. As with all time series data, there is a need for a long-term commitment to update the database regularly on the basis of a consistent list of journals. A key future challenge in applying this method across countries is determining the appropriate number of journals to include in the data collection, relative to the size of the studied country.
Given that LBIO data collection is time consuming, universities or agencies that decide to embark on such projects should be willing and able to undertake large investments. Compared to investments in medical and technical research, these costs may be considered relatively small, and are probably worthwhile for nations that want to monitor and evaluate their innovation activities over time.
appendix_AK.docx
Download MS Word (90.1 KB)Acknowledgements
We would like to acknowledge the financial support from TEKES and VINNOVA, for the UDIT project: Understanding Diverging Innovation Trends in Finland and Sweden. We would like to give special thanks to Frank van der Most for data base work, to several assistants on both the Swedish and Finnish sides for data collection: Maria Mäntylä (started as a research assistant but was hired during the process), Ilkka Jokipii, Eero Kettunen, Mikko Kuusisto, Mila Lehenkari, Suvi Leväsluoto, Emma Rilla, Paavo-Matti Toivanen, Ville Tuppurainen, Mathias Johansson, Amanda Kander, Nora Zolotov, Axel Ek, Linnea Karlsson.
Disclosure statement
No potential conflict of interest was reported by the authors.
Additional information
Funding
Notes
1 See http://ec.europa.eu/research/innovation-union/index_en.cfm?pg=why (11.3.2016).
2 ‘Significant innovations’ is based on judgement of editors of trade journals that chose to write an edited article, see Method section in SI.
3 Furthermore, the resulting dataset contains only those innovations that, to the editor, seem to stand out from the crowd (Archibugi, Citation1988; Archibugi & Pianta, Citation1996; Makkonen & van der Have, Citation2013). Given that the innovations have passed multiple rounds of editorial discussions before making it to the pages of a journal, we assume that they can be taken to signal an important development and, as such, are valid indicators of industrial renewal. Admittedly, the assessment is often made ex-ante. When the publications hit the newsstand the transforming effect of these innovations have yet to materialize. The ex post significance of the Swedish innovations are currently being investigated through interviews, which will be followed up by surveys in the spring of 2018.
4 The Swedish Government recently requested that Statistics Sweden (SCB) improve data collection on innovation and R&D in the private and public sectors. Within this framework, SCB has developed and piloted a method to survey research and development in Swedish micro-firms employing 1 to 9 co-workers (Statistiska Centralbyrån, Citation2016).
5 The Finnish SFINNO project, managed by VTT Technical Research Centre of Finland, started in 1998. The Swedish SWINNO project, based on the Finnish template, started in 2008 and is managed by researchers at the Department of Economic History at Lund University.
6 The data collection process has been documented extensively elsewhere (Sjöö, Citation2014; Sjöö, Taalbi, Kander, & Ljungberg, Citation2014; Taalbi, Citation2014).
7 For an overview of the innovation systems and public stimulation of innovations in Finland and Sweden in this period, see Torregrosa, Pelkonen, Oksanen, and Kander (Citation2017).
8 The number of indicators included in the European Innovation Scoreboard measurement framework was increased from 25 to 27 in the 2017 edition (European Commission, Citation2017).
9 The sector division is based on the following NACE rev. 1.1 (2002) classification: ICT corresponds to NACE30-33 and 72, Machinery & Metals comprehend NACE 27–29, Manufacturing except ICT, machinery and metals encompasses NACE 15–26 and 34–37.
References
- Acs, Z. J., & Audretsch, D. B. (1990). Innovation and small firms. Cambridge, MA: MIT Press.
- Aghion, P., & Howitt, P. (1998). Endogenous growth theory. Cambridge, MA: MIT Press.
- Alegre-Vidal, J., Lapiedra-Alcamí, R., & Chiva-Gómez, R. (2004). Linking operations strategy and product innovation: An empirical study of Spanish ceramic tile producers. Research Policy, 33(5), 829–839. doi: 10.1016/j.respol.2004.01.003
- Ali-Yrkkö, J., Kalm, M., Pajarinen, M., Rouvinen, P., Seppälä, T., & Tahvanainen, A. (2013). Microsoft acquires Nokia: implications for the two companies and Finland. ETLA Brief No 16. Retrieved from http://pub.etla.fi/ETLA-Muistio-Brief-16.pdf
- Ang, B. W. (2004). Decomposition analysis for policymaking in energy: Which is the preferred method? Energy Policy, 32(9), 1131–1139. doi: 10.1016/S0301-4215(03)00076-4
- Ang, B. W. (2005). The LMDI approach to decomposition analysis: A practical guide. Energy Policy, 33(7), 867–871. doi: 10.1016/j.enpol.2003.10.010
- Archibugi, D. (1988). In search of a useful measure of technological innovation (to make economists happy without) discontenting technologists. Technological Forecasting and Social Change, 34(3), 253–277. doi: 10.1016/0040-1625(88)90071-6
- Archibugi, D., & Pianta, M. (1996). Innovation surveys and patents as technology indicators: The state of the art. In Innovation, patents and technological strategies (pp. 17–56). Paris: OECD.
- Arundel, A., & Kabla, I. (1998). What percentage of innovations are patented? Empirical estimates for European firms. Research Policy, 27(2), 127–141. doi: 10.1016/S0048-7333(98)00033-X
- Bank of Finland. (2015). A brief history of Finnish foreign trade. Bank of Finland Bulletin 5/2015. Bank of Finland publications. Helsinki: Government Printing Centre.
- Bloom, N., Jones, C. I., Van Reenen, J., & Webb, M. (2017). Are ideas getting harder to find? (National Bureau of Economic Research No. 23782). Retrieved from http://www.nber.org/papers/w23782
- Brynjolfsson, E., & McAfee, A. (2011). Race against the machine: How the digital revolution is accelerating innovation, driving productivity, and irreversibly transforming employment and the economy. Lexington, MA: Digital Frontier Press.
- Brynjolfsson, E., & McAfee, A. (2014). The second machine age: Work, progress, and prosperity in a time of brilliant technologies. New York: WW Norton & Company.
- Carlsson, B. (1995). Technological systems and economic performance: The case of factory automation. Dordrecht: Kluwer.
- Cohen, W. M., Nelson, R. R., & Walsh, J. P. (2000). Protecting their intellectual assets: appropriability conditions and why US manufacturing firms patent (or not). (NBER working paper No. 7552). Retrieved from http://www.nber.org/papers/w7552
- Coombs, R., Narandren, P., & Richards, A. (1996). A literature-based innovation output indicator. Research Policy, 25(3), 403–413. doi: 10.1016/0048-7333(95)00842-X
- Cowen, T. (2011). The great stagnation: How America ate all the low-hanging fruit of modern history, got sick, and will (eventually) feel better. New York: Dutton.
- Dong, J., Li, W., Cao, Y., & Fang, J. (2016). How does technology and population progress relate? An empirical study of the last 10,000 years. Technological Forecasting and Social Change, 103, 57–70. doi: 10.1016/j.techfore.2015.11.011
- Edquist, C., & Zabala-Iturriagagoitia, J. M. (2015). The Innovation Union Scoreboard is flawed: the case of Sweden–not the innovation leader of the EU–updated version. Papers in Innovation Studies 2015/16. Lund University, CIRCLE. Retrieved from https://ideas.repec.org/p/hhs/lucirc/2015_016.html
- Edvinsson, R. (2005). Growth, accumulation, crisis: With new macroeconomic data for Sweden 1800–2000 (Doctoral dissertation). Stockholm: Stockholm University.
- Edwards, K. L., & Gordon, T. J. (1984). Characterization of innovations introduced on the US market in 1982. Glastonbury: Futures Group.
- Eggert, A., Thiesbrummel, C., & Deutscher, C. (2015). Heading for new shores: Do service and hybrid innovations outperform product innovations in industrial companies? Industrial Marketing Management, 45, 173–183. doi: 10.1016/j.indmarman.2015.02.013
- Eichengreen, B. (2015). Secular stagnation: The long view. American Economic Review, 105(5), 66–70. doi: 10.1257/aer.p20151104
- Ejermo, O. A., & Kander, A. (2011). Swedish business research productivity. Industrial and Corporate Change, 20(4), 1081–1118. doi: 10.1093/icc/dtr023
- Ejermo, O., Kander, A., & Svensson Henning, M. S. (2011). The R&D-growth paradox arises in fast-growing sectors. Research Policy, 40(5), 664–672. doi: 10.1016/j.respol.2011.03.004
- Eliasson, G. (2001). The emergence and the disappearance of a Swedish computer industry: A competence bloc analysis of the chance factor KTH. Stockholm: Stockholm University.
- European Commission. (2014). For a European industrial renaissance. Brussels: COM 14/2.
- European Commission. (2017). European innovation scoreboard 2017. Retrieved from https://ec.europa.eu/growth/industry/innovation/facts-figures/scoreboards_en
- Flor, M. L., & Oltra, M. J. (2004). Identification of innovating firms through technological innovation indicators: An application to the Spanish ceramic tile industry. Research Policy, 33(2), 323–336. doi: 10.1016/j.respol.2003.09.009
- Fontana, R., Nuvolari, A., Shimizu, H., & Vezzulli, A. (2013). Reassessing patent propensity: Evidence from a dataset of R&D awards, 1977–2004. Research Policy, 42(10), 1780–1792. doi: 10.1016/j.respol.2012.05.014
- Gordon, R. (2012). Is US economic growth over? Faltering innovation confronts the six headwinds (NBER Working Paper No. 18315). Retrieved from http://www.nber.org/papers/w18315
- Gordon, R. J. (2016). The rise and fall of American growth: The US standard of living since the civil war. Princeton: Princeton University Press.
- Grawe, S. J. (2009). Logistics innovation: A literature-based conceptual framework. International Journal of Logistics Management, 20(3), 360–377. doi: 10.1108/09574090911002823
- Greve, H. (2003). A behavioral theory of R&D expenditures and innovations: Evidence from shipbuilding. Academy of Management Journal, 46(6), 685–702.
- Grossman, G. M., & Helpman, E. (1991). Innovation and growth in the world economy. Cambridge, MA: MIT Press.
- Grossman, G. M., & Helpman, E. (1994). Endogenous innovation in the theory of growth. Journal of Economic Perspectives, 8(1), 23–44. doi: 10.1257/jep.8.1.23
- Hjerppe, R. (1989). The Finnish economy 1860–1985: Growth and structural change. Helsinki: Bank of Finland.
- Hjerppe, R. (1990). Kasvun vuosisata. Helsinki: VAPK-Kustannus.
- Holmström, B., Korkman, S., & Pohjola, M. (2014). The nature of Finland’s economic crisis and the prerequisites for growth. Memorandum. Retrieved from https://vnk.fi/documents/10616/339615/The+nature+of+Finland%E2%80%99s+economic+crisis+and+the+prerequisites+for+growth+-memorandum/07f3b69a-25cb-4347-a713-b0f91c23a931
- Huebner, J. (2005). A possible declining trend for worldwide innovation. Technological Forecasting and Social Change, 72(8), 980–986. doi: 10.1016/j.techfore.2005.01.003
- Jones, C. I. (1995). R&D-based models of economic growth. Journal of Political Economy, 103(4), 759–784. doi: 10.1086/262002
- Jonung, L. (1994). 1990-talets ekonomiska kris i historisk belysning: Efterskrift till Erik Lundbergs bok ‘Ekonomiska kriser förr och nu’. Stockholm: SNS.
- Jonung, L., Kiander, J., & Vartia, P. (2009). The great financial crisis in Finland and Sweden: The dynamics of boom, bust and recovery, 1985–2000. In L. Jonung, J. Kiander, & P. Vartia (Eds.), Bust and recovery (pp. 19–70). Cheltenham: Edward Elgar Publishing.
- Kasparov, G., & Thiel, P. (2012, November 8). Our dangerous delusion of tech progress. Financial Times.
- Kleinknecht, A., & Bain, D. (Eds.). (1993). New concepts in innovation output measurement. London: Macmillan.
- Kokkinen, A., Jalava, J., Hjerppe, R., & Hannikainen, M. (2007). Catching up in Europe: Finland’s convergence with Sweden and the EU15. Scandinavian Economic History Review, 55(2), 153–171. doi: 10.1080/03585520701435996
- Korkman, S., & Suvanto, A. (2015). Finland and Sweden in cross-country comparison: What are the lessons? In T. M. Andersen, M. Bergman, & S. E. H. Jensen (Eds.), Reform capacity and macroeconomic performance in the Nordic countries (pp. 278–305). Oxford: Oxford University Press.
- Kurzweil, R. (1999). Spiritual machines: The merging of man and machine. The Futurist, 33(9), 16–21.
- Kurzweil, R. (2005). The singularity is near: When humans transcend biology. London: Duckworth.
- Kurzweil, R. (2013). Augmentation and transcendence [T&S interview]. IEEE Technology and Society Magazine, 32(1), 5–6. doi: 10.1109/MTS.2013.2247723
- Lemola, T. (1994). Characteristics of technology policy in Finland. In S. Vuori, & P. Vuorinen (Eds.), Explaining technical change in a small country: The Finnish national innovation system (pp. 184–200). Heidelberg: Physica-Verlag.
- Lemola, T. (2003). Country report: Transformation of Finnish science and technology policy. Science Studies, 16(1), 52–67.
- Makkonen, T., & van der Have, R. P. (2013). Benchmarking regional innovative performance: Composite measures and direct innovation counts. Scientometrics, 94(1), 247–262. doi: 10.1007/s11192-012-0753-2
- March, J. G. (1991). Exploration and exploitation in organizational learning. Organization Science, 2(1), 71–87. doi: 10.1287/orsc.2.1.71
- Mokyr, J. (2014). Secular stagnation? Not in your life. In C. Teulings, & R. Baldwin (Eds.), Secular stagnation: facts, causes and cures (pp. 83–89). London: CEPR Press and VoxEU.org.
- Myllyntaus, T. (Ed.). (1998). Economic crises and restructuring in history: Experiences of small countries. St. Katharinen: Scripta Mercaturae Verlag.
- OECD. (2005). Innovation policy and performance: A cross-country comparison. Paris: OECD Publishing.
- Palmberg, C., Leppälahti, A., Lemola, T., & Toivanen, H. (1999). Towards a better understanding of innovation and industrial renewal in Finland: A new perspective. Espoo: VTT.
- van der Panne, G. (2007). Issues in measuring innovation. Scientometrics, 71(3), 495–507. doi: 10.1007/s11192-007-1691-2
- Pavitt, K. (1984). Sectoral patterns of technical change: Towards a taxonomy and a theory. Research Policy, 13(6), 343–373. doi: 10.1016/0048-7333(84)90018-0
- Romer, P. M. (1986). Increasing returns and long-run growth. Journal of Political Economy, 94(5), 1002–1037. doi: 10.1086/261420
- Rouvinen, P., & Ylä-Anttila, P. (2003). Case study: Little Finland’s transformation to a wireless giant. In S. Dutta, B. Lanvin, & F. Paua (Eds.), The global information technology report 2003–2004 (pp. 87–108). New York: Oxford University Press.
- Saarinen, J. (2005). Innovations and industrial performance in Finland, 1945–1998 (Doctoral dissertation). Lund: Lund University.
- Santarelli, E., & Piergiovanni, R. (1996). Analyzing literature-based innovation output indicators: The Italian experience. Research Policy, 25(5), 689–711. doi: 10.1016/0048-7333(95)00849-7
- Schön, L. (2000). Electricity, technological change and productivity in Swedish industry, 1890–1990. European Review of Economic History, 4(2), 175–194. doi: 10.1017/S1361491600000046
- Schön, L. (2009). Technological waves and economic growth: Sweden in an international perspective 1850–2005. CIRCLE Working Papers 2009/6. Lund: Lund University.
- Schön, L. (2010). Sweden’s road to modernity: An economic history. Stockholm: SNS förlag.
- Sjöö, K. (2014). Innovation and transformation in the Swedish manufacturing sector, 1970–2007 (Doctoral dissertation). Lund: Lund University.
- Sjöö, K. (2016). Innovation and industrial renewal in Sweden, 1970–2007. Scandinavian Economic History Review, 64(3), 258–277. doi: 10.1080/03585522.2016.1218928
- Sjöö, K., Taalbi, J., Kander, A., & Ljungberg, J. (2014). SWINNO: A database of Swedish innovations, 1970–2007 (Lund Papers in Economic History. General Issues; No. 133). Lund: Lund University.
- Solow, R. (1987, July 12). We’d better watch out [Book review], New York Times.
- Statistiska Centralbyrån. (2016). Forskning och utveckling i företag med 1–9 anställda år 2013: En pilotundersökning. Forskning och utveckling inom företagssektorn 2016:1. Stockholm: Statistics Sweden.
- Strumsky, D., Lobo, J., & Tainter, J. A. (2010). Complexity and the productivity of innovation. Systems Research and Behavioral Science, 27(5), 496–509. doi: 10.1002/sres.1057
- Svanlund, J. (2010). Svensk och finsk upphinnartillväxt: Faktorpris-och produktivitets-utjämning mellan Finland och Sverige 1950–2000 (Doctoral dissertation). Umeå: Umeå University.
- Taalbi, J. (2014). Innovation as creative response: Determinants of innovation in the Swedish manufacturing industry, 1970–2007 (Doctoral dissertation). Lund: Lund University.
- Taalbi, J. (2017a). Development blocks in innovation networks: The Swedish manufacturing industry, 1970–2007. Journal of Evolutionary Economics, 27(3), 461–501. doi: 10.1007/s00191-017-0491-y
- Taalbi, J. (2017b). What drives innovation? Evidence from economic history. Research Policy, 46(8), 1437–1453. doi: 10.1016/j.respol.2017.06.007
- Taalbi, J. (2017c). Origins and pathways of innovation in the third industrial revolution: Sweden, 1950–2013. (Lund Papers in Economic History; No. 159). Lund: Lund University.
- Torregrosa, S., Pelkonen, A., Oksanen, J., & Kander, A. (2017). Impact of innovation policy on firm innovation: A comparison of Finland and Sweden, 1970–2013 (Lund Papers in Econmoic History; No. 160). Lund: Lund University.
- Utterback, J. (1994). Mastering the dynamics of innovation: How companies can seize opportunities in the face of technological change. Boston, MA: Harvard Business School Press.
- Van der Have, R., Saarinen, J., Pesonen, P., & Rilla, N. (2009). Innovation as objective: The SFINNO approach. In J. Saarinen, & N. Rilla (Eds.), Changes in innovation: Towards an improved understanding of economic renewal (pp. 9–19). Basingstoke: Palgrave Macmillan.
- Vijg, J. (2011). The American technological challenge: Stagnation and decline in the 21st century. New York: Algora Publishing.
- Villar, C., Pla-Barber, J., & Alegre, J. (2012). Unravelling the moderating effects of size and experience on product innovations and exports: A study in a medium knowledge-intensive industry. Technology Analysis & Strategic Management, 24(2), 219–238. doi: 10.1080/09537325.2012.647650
- Walker, R. M., Jeanes, E., & Rowlands, R. (2002). Measuring innovation: Applying the literature-based innovation output indicator to public services. Public Administration, 80(1), 201–214. doi: 10.1111/1467-9299.00300
- Weitzman, M. L. (1998). Recombinant growth. The Quarterly Journal of Economics, 113(2), 331–360. doi: 10.1162/003355398555595