Abstract
The objective of this study was to determine if interaction between phytochemical mixtures and low level exposure to pesticides would modify tissue endogenous antioxidants in rats. Two experiments were conducted using dietary flavonoid (F) and oral pesticide (P) mixtures (FM, PM) on changes in the activities of superoxide dismutase (SOD), glutathione peroxidase (GPX) and glutathione concentrations (GSH) in male Sprague Dawley rats (150–175 g) fed for 2 or 4 weeks the AIN 93M diet with or without equal amounts of quercetin, rutin, catechin (FM) at 1.0 mM or 5 mM/kg diet, and with/without PM fed orally at 0.1 mL/d/5d/wk (PM = chlorpyrifos, endosulfan, thiram at 25% LD50 in oil). Our data indicate that (compared to corresponding Control groups): (i) While, 2 weeks of feeding reduced liver and small intestinal mucosal (IM) SOD activity in the PFM1 (PM+FM1) group, 4 weeks of feeding increased only liver SOD activity in PM, FM1, FM5 and PFM1 and PFM5 groups; (ii) Liver and IM GSH levels increased in PFM groups after 2 or 4 weeks of exposure; plasma GSH increased in the groups fed FM5 with or without PM; (iii) Liver GPX activity declined in both 2 and 4 week experiments in the FM and PFM groups, respectively. These data suggests that metabolic interaction between FM and PM, and duration of exposure, can modify endogenous antioxidants. Data also underscore the prooxidant properties of flavonoids.
Introduction
The detrimental health effects of chemicals in foods and/or the environment depend on several factors such as levels of exposure, duration of exposure, potency of the chemicals and the interaction between chemicals in a mixture. Though most studies are conducted with individual chemicals, animals and humans are exposed to multiple chemicals in a complex mixture. Moreover, these chemicals can interact with each other depending on their metabolism in different tissues.[ Citation 1 ] Human diets also contain phytochemicals such as flavonoids that are metabolized by the same pathway as toxic man-made chemicals such as pesticides and other environmental pollutants.
Phytochemicals (polyphenols) are natural compounds found in most foods, especially in fruits and vegetables, and are secondary metabolites of plants that are metabolized by the biotransforming Phase I and Phase II enzymes in the liver and the gastrointestinal tract. The major Phase I enzymes include cytochrome P450 and flavin monooxygenases, which can be induced or inhibited by either xenobiotics or natural chemicals or their residues.[ Citation 2 , Citation 3 ] The increased activity of these enzymes also leads to the accumulation of reactive oxygen species (ROS), which in turn can promote cell/receptor binding, protein and DNA adduct formation, induction or inhibition of enzymes and increased lipid peroxidation—an endpoint of reactive oxygen species (ROS) accumulation.[ Citation 4 , Citation 5 ] Thus, the consumption of purified phytochemicals at pharmaceutical levels could potentially result in toxicity. The availability and use of these so called nutraceuticals is not under the purview of federal regulatory agencies, therefore, it is necessary to establish not only adverse effects of these phytochemicals, but to also determine levels of consumption that will provide maximum benefits to health.[ Citation 6 ]
Studies in cultured cells have amply established the antioxidant properties of flavonoids and other phytochemicals.[ Citation 7 ] Several studies also indicate that some of these chemicals could also have undesirable toxic side effects. At high concentrations phytochemicals can produce oxidative stress by auto-oxidation and redox cycling.[ Citation 8 ] More recently, it has been shown that at low levels flavonoids provide antioxidant protection, but at high levels they cause DNA damage and apoptosis (cell death).[ Citation 9 ] These data have been obtained in isolated cells and need to be validated in the whole animal as the compounds are metabolized in the liver as well as in the small intestines, which also act as a barrier for absorption. The metabolites absorbed from the small intestines could further increase the load in the liver that in turn could initiate metabolic reactions leading to the development of oxidative stress and subsequent cellular damage. Additionally, exposure to low levels of commonly used pesticides is reported to induce oxidative stress as indicated by malondialdehyde accumulation and/or glutathione depletion, inhibition or induction of ROS and quenching endogenous antioxidant enzymes such as superoxide dismutase, glutathione peroxidase and catalase in rat tissues.[ Citation 10 , Citation 11 , Citation 12 , Citation 13 ]
The objective of this study was based on the hypothesis that the ingestion of phytochemical mixtures along with simultaneous low level exposure to pesticides would modify tissue antioxidants. Herein, data are presented on the changes in some tissue endogenous antioxidants in young adult rats exposed orally to a mixture of pesticides and fed a mixture of flavonoids in the diet for different durations.
Materials and methods
Chemicals
Pesticides [Endosulfan, an organochlorine (α-β -Endosulfan: 1,4,5,6,7-7 hexachloro-5-norbornene-2,3dimethanol cyclic sulfite, CAS #115-29-7), Thiram, a carbamate (tetramethylthiuram disulfide, CAS #137-26-8) and Chlorpyrifos, an organophosphate (phosphorothioic acid O,O-diethyl O-(3,5,6-trichloro-2-pyridinyl) ester, CAS# 2921-88-2] were purchased from Chem Service, West Chester, PA. Flavonoids, quercetin (CAS #6151-25-3), rutin (CAS #207671-50-9) and catechin (CAS #88191-48-4) and all other analytical grade chemicals were purchased from Sigma Life Sciences, St. Louis, MO or Roche Diagnostics, Indianapolis, IN. Glutathione assay kit (GSH-420) was purchased from Oxis Health Products, Inc., Portland, OR).
Animal experiments
These experiments were approved by the Institutional Review Board of Kentucky State University. Young adult male Sprague Dawley rats (Harlan Sprague Dawley, Indianapolis, IN), 150–175 g, were used in these experiments. The rats were housed in suspended polypropylene cages with stainless steel mesh bottom screens and kept in rooms with 12 hour light and dark cycles, with temperature at 20° C and relative humidity at 40–60%. After 3 days of acclimation, the rats were weighed and randomly allotted to the experimental groups such that all groups had similar average initial body weights. The rats had free access to food and distilled drinking water throughout these studies.
As suggested by Safe[ Citation 1 ] in a review, for public health reasons, exposure to natural and man-made chemicals must consider intake and potency of chemicals that act through various and similar metabolic pathways. Also, though the Toxic Equivalency Factor (TEF) has been used for many classes of chemicals, it has limited applications as there are problems with the dietary intake of toxic equivalents (TEQ), which are in addition, complicated by several other factors.[ Citation 1 ] Since exposure to man-made chemicals is widespread in most agricultural communities, we chose to use an equivalent mixture of the most commonly used pesticides, even though this population group may be exposed to a much wider array of various types of pesticides.[ Citation 14 ] Similarly, because of the unavailability of flavonoid composition of foods and analytical data on actual levels of different flavonoids in human diets, an equivalent mixture of purified citrus flavonoids were used as they are the most prevalent nutritional additives in nutraceuticals and also have the highest antioxidant potency.[ Citation 7 ]
The rats were fed a control diet, AIN 93M, which contained 4% soybean oil. The experimental diets contained 2% soybean oil and the remaining 2% of the same oil was used to disperse the flavonoids in the experimental diets. The diets and soybean oil were purchased from Dyets, Inc., Bethlehem, PA. The oil was sufficient to dissolve the flavonoids that was added to the experimental diets and mixed for 2 hours in Hobart dry food mixer to ensure the complete distribution; each of the flavonoids (FM), quercetin, rutin and catechin were added at either 1.0 or 5.0 mM/kg diet. FM1 diet contained 0.30 g of quercetin, 0.61 g of rutin, 0.29 g catechin per kg diet; FM5 diet had 1.5 g quercetin, 3.05 g rutin, 1.45 g catechin per kg diet. The pesticide mixture (PM) contained Chlorpyrifos, Endosulfan and Thiram at a dosage level of 25% of LD50 (20.5, 30.3 and 160.0 mg/kg body weight, respectively). Depending on average body weight of the PM groups each week, the amount of pesticides were calculated, weighed and dissolved in a known amount of soybean oil such that they received 25% of LD50 dose of the PM in 0.1 mL of this oil that was fed by gavage to ensure full consumption of the pesticides 5 days/week, for the duration of each experiment.
To determine the effects of short-term and long-term exposure to low or high levels flavonoids in the diet with and without pesticide exposure on endogenous antioxidants status two separate experiments were conducted: Experiment 1 = 4 groups of rats, 6/group, Experiment 2 = 6 group of rats, 6/group. All had free access to the control or FM containing experimental diets. Rats in the Control and FM fed groups were gavage fed plain soybean oil and the pesticide exposed groups (PM, PM+FM1 and/or PM+FM5) were gavage fed 0.1 mL oil containing dissolved PM (levels as described in the above paragraph) every weekday morning. The last gavage treatment was 24 hr prior to termination of the experiments. The feeding and exposure duration of Experiment 1 was 2 weeks; the groups were labeled: 1) CON (control); 2) PM; 3) FM1; 4) PFM1; Experiment 2 was for 4 weeks; the groups were labeled:1) CON; 2) PM; 3) FM1; 4) FM5; 5) PFM1; 6) PFM5. (In the second experiment, two extra groups were added to test the effects of high levels of flavonoids, FM5).
At the end of the two experimental periods, the animals were terminated with light diethyl ether (anesthetic grade) anesthesia, opened with a midline incision and about 8 mL of blood was drawn from the abdominal vena cava with a 10 mL syringe containing 200 μl of 2% heparin in 0.89% NaCl. The blood was transferred to conical centrifuge tubes and kept on ice. The liver and small intestines were excised, immediately rinsed in ice cold saline, cleansed of extraneous tissue and excess moisture removed with lint free kimwipes and kept on ice. All tissues were quickly weighed and aliquots of liver for various analyses were transferred to cryovials. The small intestines were rinsed with ice-cold phosphate buffered saline (PBS), slit open and mucosa was collected and homogenized in a known volume of PBS and aliquots were stored in cryovials for different analyses. Blood was centrifuged at 400 × g for 30 minutes to separate plasma; erythrocytes were washed thrice with ice cold PBS after removal of the buffy coat; the washed erythrocytes were then hemolyzed in an equal volume of ice cold distilled water. Aliquots of plasma and erythrocyte suspension were transferred to cryovials. All samples were stored at −80° C and all analyses were completed within 3 months of storing samples as the enzymes and GSH were stable for this period.
Biochemical analysis
The activity of Zn, Cu superoxide dismutase (SOD) in the erythrocytes, liver and mucosa was analyzed by the method of Sun, et al.[ Citation 15 ] To destroy Mn SOD, the erythrocyte hemolysate and tissue supernatants were extracted as follows: 0.2 mL of hemolysate or tissue supernatant was diluted with 3.8 mL ice cold distilled water and extracted with 1.0 mL ethanol and 0.6 mL chloroform; the tubes were centrifuged at 400 × g for 10 minutes after mixing on a vortex mixer for one minute. The extracts were transferred to clean sealed tubes and stored at −80°C for no more than one week (SOD in the extract was stable for this duration). Protein content of the mucosa was estimated using bicinchoninic acid.[ Citation 16 ] Erythrocyte hemoglobin content was determined by the cyanmethemoglobin method using Drabkin's reagent. The activity of glutathione peroxidase (GPX) in plasma and liver and small intestinal mucosa was measured by the method of Flohé and Gunzler.[ Citation 17 ] Total glutathione (GSH) concentrations in these tissues were assayed with OXIS GSH-420 kits. All analyses were performed in duplicate. Enzyme activities were expressed as follows: SOD as units = nM of protein required to inhibit free radical generation by 50% × 100 per g tissue or mg hemoglobin in erythrocytes or g protein in the mucosa; GPX as μ M nicotinamide adenine dinucleotide phosphate reduced (NADPH) oxidized/min/mg hemoglobin or g tissue or L plasma or g protein in the mucosa; GSH as μ M/g tissue or /L plasma or g protein in the mucosa.
Statistical analysis
The data from Experiments 1 and 2 were statistically analyzed by least squares One Way analysis of variance (ANOVA) using Sigma Stat 2.0 for desktop computers (SPSS Science, Chicago, IL). Significant differences between means were determined by the Student Neuman-Keuls test on means for each experiment.
Results
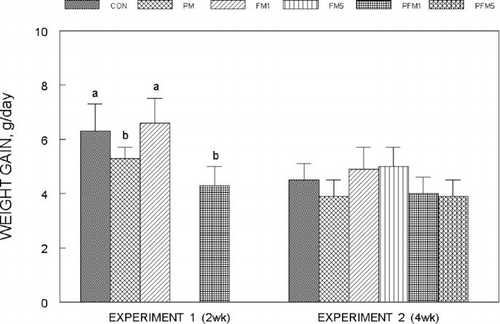
The oral feeding of PM to rats did not cause any distress or adverse reactions and they appeared normal throughout these experiments. In Experiment 1 (2 week exposure): oral administration of PM decreased both feed intake () and weight gain () by about 25% as compared to the CON, while feeding PM for 4 weeks (Experiment 2) did not alter either feed intake or weight gain, which was about 4–5 g/day in all the groups. The average intake of FM from the diet was similar: Experiment 1: FM1 = 23 ± 2.4 mg/day; the intake of FM in the PFM1 group was about 23% lower than the CON and was related to the lower feed intake. In Experiment 2 the average FM intake was: FM1/PFM1 groups = 19.3 ± 1.2 mg/day; FM5/PFM5 groups = 100.75 ± 9.1 mg /day; these levels did not modify either feed intake or weight gain in the rats.
Fig. 1 Changes in feed intake of rats fed control or flavonoid mixture containing diets (FM; groups: FM1 or FM5)) with or without pesticide mixture (PM; groups: PM, PFM1 or PFM5) fed orally by gavage for either 2 weeks (Experiment 1) or 4 weeks (Experiment 2). Means ± SD; 6 rats/group. One way analysis of variance (ANOVA) indicated significant differences between the means; means not sharing a superscript are significantly different at P ≤ 0.05. FM: equimolar mixture of quercetin, rutin and catechin added to the diet at 1 mM or 5 mM/kg bodyweight; PM: endosulfan, chlorpyrifos and thiram at 25% of LD50 in oil fed at 0.1 mL/day/5days a week.
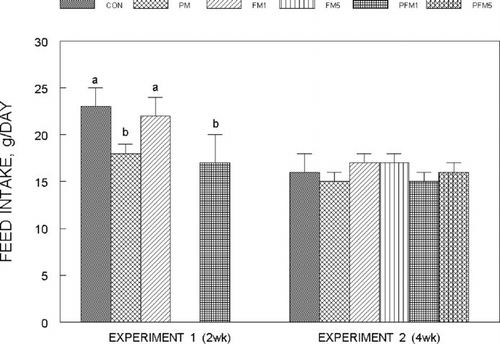
Fig. 2 Weight gain of rats fed control or flavonoid mixture containing diets (FM; groups: FM1 or FM5)) with or without pesticide mixture (PM; groups: PM, PFM1 or PFM5) fed orally by gavage for either 2 weeks (Experiment 1) or 4 weeks (Experiment 2). Means ± SD; 6 rats/group. One way analysis of variance (ANOVA) indicated significant differences between the means; means not sharing a superscript are significantly different at P ≤ 0.05. FM: equimolar mixture of quercetin, rutin and catechin added to the diet at 1 mM or 5 mM/kg bodyweight; PM: endosulfan, chlorpyrifos and thiram at 25% of LD50 in oil fed at 0.1 mL/day/5 days a week.
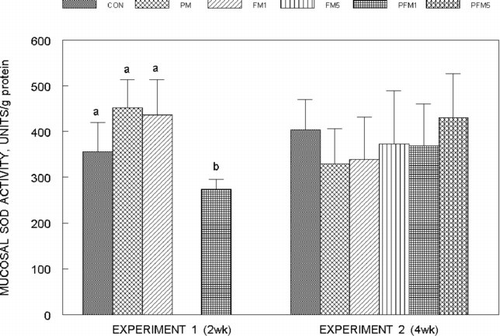
Liver SOD activity in Experiment 1 and 2 is shown in . Liver SOD decreased by 17% in the PFM1 group of Experiment 1 as compared to the CON and was unchanged in the PM or FM1 groups, while in Experiment 2, SOD activity increased by an average of 50% in all FM and PFM groups compared to the corresponding CON (P ≤ 0.05). Two weeks of exposure to PM or FM1 did not modify SOD activity in the small intestinal mucosa, but PFM1 decreased SOD by 30% (; P ≤ 0.05), while in Experiment 2, mucosal SOD activity of all groups was similar. In both experiments, erythrocytes SOD activity was not influenced by either PM or FM alone or in combination (data are not presented).
Fig. 3 Liver superoxide dismutase activity in rats fed control or flavonoid mixture containing diets (FM; groups: FM1 or FM5)) with or without pesticide mixture (PM; groups: PM, PFM1 or PFM5) fed orally by gavage for either 2 weeks (Experiment 1) or 4 weeks (Experiment 2). Means ± SD; 6 rats/group. One way analysis of variance (ANOVA) indicated significant differences between the means; means not sharing a superscript are significantly different at P ≤ 0.05. FM: equimolar mixture of quercetin, rutin and catechin added to the diet at 1 mM or 5 mM/kg bodyweight; PM: endosulfan, chlorpyrifos and thiram at 25% of LD50 in oil fed at 0.1 mL/day/5 days a week.
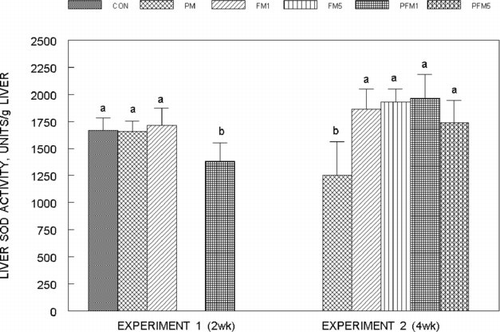
Fig. 4 Small intestinal mucosal superoxide dismutase activity in rats fed control or flavonoid mixture containing diets (FM; groups: FM1 or FM5)) with or without pesticide mixture (PM; groups: PM, PFM1 or PFM5) fed orally by gavage for either 2 weeks (Experiment 1) or 4 weeks (Experiment 2). Means ± SD; 6 rats/group. One way analysis of variance (ANOVA) indicated significant differences between the means; means not sharing a superscript are significantly different at P ≤ 0.05. FM: equimolar mixture of quercetin, rutin and catechin added to the diet at 1 mM or 5 mM/kg bodyweight; PM: endosulfan, chlorpyrifos and thiram at 25% of LD50 in oil fed at 0.1 mL/day/5days a week.
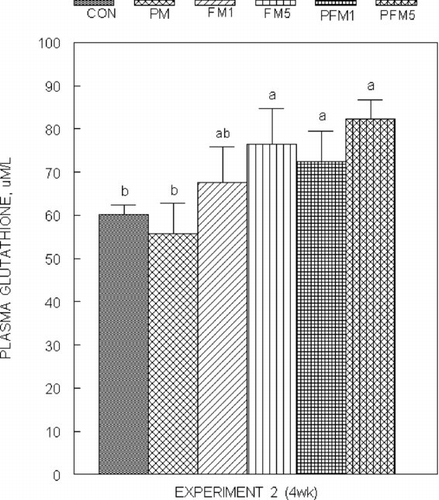
Liver glutathione (GSH) concentrations () were not modified by PM or FM1 or FM5 either alone or in combination in both Experiments 1 and 2, though, that of the PFM5 group was 25% (Experiment 2) higher than the corresponding CON (P ≤ 0.05); mucosal GSH concentrations () followed a similar trend, and the increase in the PFM5 group was 44% versus the CON (Experiment 2; P ≤ 0.05). Plasma glutathione levels in Experiment 2 were on an average 27% higher in the FM5, PFM1 and PFM5 groups than the CON (); plasma from Experiment 1 could not be analyzed for glutathione due to unexpected loss of samples. No differences were found in erythrocyte GSH levels.
Fig. 5 Liver glutathione concentrations in rats fed control or flavonoid mixture containing diets (FM; groups: FM1 or FM5)) with or without pesticide mixture (PM; groups: PM, PFM1 or PFM5) fed orally by gavage for either 2 weeks (Experiment 1) or 4 weeks (Experiment 2). Means ± SD; 6 rats/group. One way analysis of variance (ANOVA) indicated significant differences between the means; means not sharing a superscript are significantly different at P ≤ 0.05. FM: equimolar mixture of quercetin, rutin and catechin added to the diet at 1 mM or 5 mM/kg bodyweight; PM: endosulfan, chlorpyrifos and thiram at 25% of LD50 in oil fed at 0.1 mL/day/5 days a week.
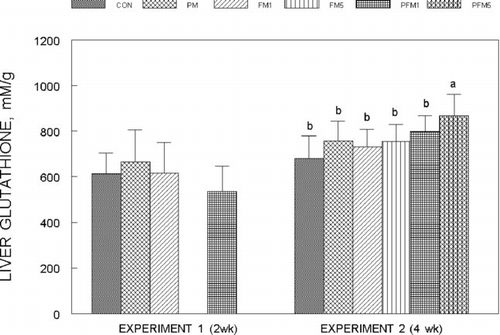
Fig. 6 Changes in glutathione concentrations in the small intestinal mucosa of rats fed control or flavonoid mixture containing diets (FM; groups: FM1 or FM5)) with or without pesticide mixture (PM; groups: PM, PFM1 or PFM5) fed orally by gavage for either 2 weeks (Experiment 1) or 4 weeks (Experiment 2). Means ± SD; 6 rats/group. One way analysis of variance (ANOVA) indicated significant differences between the means; means not sharing a superscript are significantly different at P ≤ 0.05. FM: equimolar mixture of quercetin, rutin and catechin added to the diet at 1 mM or 5 mM/kg bodyweight; PM: endosulfan, chlorpyrifos and thiram at 25% of LD50 in oil fed at 0.1 mL/day/5 days a week.
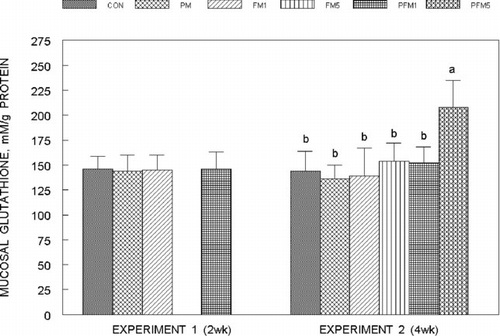
Fig. 7 Plasma glutathione concentrations in rats fed control or flavonoid mixture containing diets (FM; groups: FM1 or FM5)) with or without pesticide mixture (PM; groups: PM, PFM1 or PFM5) fed orally by gavage for 4 weeks (Experiment 2). Means ± SD; 6 rats/group. One way analysis of variance (ANOVA) indicated significant differences between the means; means not sharing a superscript are significantly different at P ≤ 0.05. FM: equimolar mixture of quercetin, rutin and catechin added to the diet at 1 mM or 5 mM/kg bodyweight; PM: endosulfan, chlorpyrifos and thiram at 25% of LD50 in oil fed at 0.1 mL/day/5 days a week.
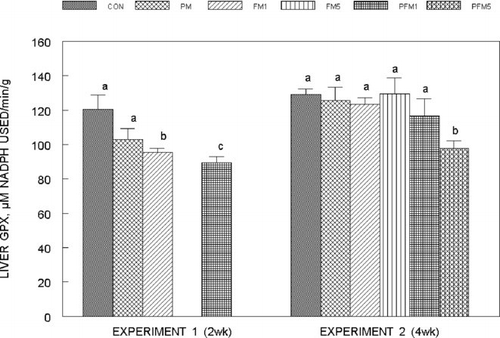
The activity of liver glutathione peroxidase (GPX) () after 2 weeks of exposure (Experiment 1) declined significantly by 21% and 26% in the FM1 and PFM1 as compared to the CON group; whereas after 4 weeks of exposure (Experiment 2) liver GPX activity decreased by 24% only in the PFM5 group as compared to the corresponding CON. The changes in mucosal and erythrocyte GPX activities in both experiments were not significantly different and activities were on average: mucosa = 8.74 ± 0.86 μ M NADPH used/min/mg protein; erythrocytes 13.41 ± 0.92 μ M NADPH used/min/mg hemoglobin.
Fig. 8 Glutathione peroxidase activity in the liver of rats fed control or flavonoid mixture containing diets (FM; groups: FM1 or FM5)) with or without pesticide mixture (PM; groups: PM, PFM1 or PFM5) fed orally by gavage for either 2 weeks (Experiment 1) or 4 weeks (Experiment 2). Means ± SD; 6 rats/group. One way analysis of variance (ANOVA) indicated significant differences between the means; means not sharing a superscript are significantly different at P ≤ 0.05. FM: equimolar mixture of quercetin, rutin and catechin added to the diet at 1 mM or 5 mM/kg bodyweight; PM: endosulfan, chlorpyrifos and thiram at 25% of LD50 in oil fed at 0.1 mL/day/5 days a week.
Discussion
Xenobiotic chemicals such as pesticides may affect the metabolism of natural chemicals such as flavonoids and modify their antioxidant potential with concomitant exposure, and also trigger molecular events that could increase their health risk.[ Citation 18 ] The results of our present study indicate that interaction between the pesticide and flavonoid mixtures modified endogenous antioxidants superoxide dismutase and glutathione peroxidase activities, and glutathione levels in the short term (2 weeks) and long term (4 weeks) experiments: (i) While, 2 weeks of feeding reduced liver and small intestinal mucosal SOD activity in the PFM1 group, 4 weeks of feeding significantly increased only liver SOD activity in all PM, FM and PFM groups; (ii) Liver, small intestinal mucosal glutathione levels increased in the PFM groups, while plasma glutathione levels increased in the groups fed FM at high levels with or without PM exposure for 4 weeks; (iii) Liver glutathione peroxidase activity declined in both the 2 week and 4 week Experiments in the FM and PFM groups, respectively.
The enzyme Zn, Cu superoxide dismutase (SOD) is mainly responsible for quenching (dismutating) free radical oxygen in most tissues to hydrogen peroxide, and any modification of this enzyme activity could be related to the development of oxidative stress. The modulation of SOD activity by pesticides is reported to be variable with low doses of some pesticides not altering, but higher doses increasing activity in the liver and other tissues.[ Citation 11 , Citation 13 , Citation 19 , Citation 20 ] More recently, Gao et al.[ Citation 21 , Citation 22 ] have shown that feeding of flavonoid rutin at 2.25 g/kg body weight to mice or rats did not alter hepatic Zn, Cu SOD activity, but significantly decreased catalase activity along with an increase in total antioxidant status in the liver. The present data suggest that the increase in liver SOD activity after long-term feeding of FM with and without PM exposure may be a result of increased intracellular free radical oxygen accumulation that may have been generated by auto-oxidation and/or metabolism of FM by the drug metabolizing Phase I enzyme cytochrome 450 1A1.[ Citation 4 , Citation 18 ]
Glutathione, a thiol tripeptide, is the most important endogenous antioxidant that is found in mM concentrations in tissues and is responsible for maintaining the cellular redox state along with smaller thiols such as thioredoxin, glutaredoxin and peroxiredoxin.[ Citation 23 ] The major function of glutathione is to scavenge intracellular free radicals and peroxides under normal conditions. The enzyme γ -glutamylcysteine synthetase is responsible for glutathione synthesis and is reportedly activated by quercetin in HEP G2 cells at higher than lower concentrations, which indicates transcriptional control of the enzyme and glutathione synthesis.[ Citation 24 ] However, according to Moskaug et al.[ Citation 23 ] in vivo feeding experiments with flavonoid rich diets do not uniformly induce the enzyme. Our present data show that there were almost parallel increases in total glutathione levels in the liver, small intestinal mucosa and plasma of groups fed high FM5 concentrations with or without PM exposure for 4 weeks. This suggests that the addition of purified flavonoids to the diet could increase tissue and circulating total glutathione concentrations after prolonged administration and to some extent support the studies of Carlsen et al.[ Citation 24 ] in cultured HEP G2 cells. The increase in glutathione concentrations may be related to the role of this thiol in the detoxification of the electrophiles and free radicals;[ Citation 25 , Citation 26 ] these functions of glutathione have been recently reviewed by Pastore et al.[ Citation 27 ]
Glutathione peroxidase is an antioxidant seleno–enzyme (found in most tissues) that reduces hydrogen peroxide and alkyl peroxide in tissues and uses glutathione as an essential redox substrate. Previous studies have shown that glutathione peroxidase activity is influenced by pesticide exposure. Pyrethroid pesticides are reported to decrease the activity in erythrocytes, whereas, low level organophosphates and chlorpyrifos–ethyl appear to increase the activity of glutathione peroxidase in the liver and erythrocytes after dermal exposure.[ Citation 11 , Citation 12 , Citation 28 , Citation 29 , Citation 30 ] The decrease in liver glutathione peroxidase activity in our current 2 week and 4 week experiments in groups fed FM with or without PM could be due to the greater utilization of glutathione for detoxification of electrophiles and free radicals produced by the flavonoids and their metabolites.
In this study, equimolar levels of flavonoids quercetin, rutin and catechin were added to the experimental diets because of their greater antioxidant capacity and also since the proportion of different flavonoids in foods or diet is not predictable.[ Citation 31 ] The daily average intake of flavonoids is reported to range from 75 mg in Europe to 500–1000 mg in the US.[ Citation 32 , Citation 33 ] The effective level of pesticide mixture exposure in our present study was 7.5% of LD50 of each pesticide or a total of 22.5% LD50;of this only a small fraction of the pesticides would have been absorbed.[ Citation 34 ] Moreover, humans are exposed to higher levels of natural chemicals than xenobiotics such as pesticides and other environmental chemicals.[ Citation 35 ] Thus, the levels of the mixture of pesticides and flavonoids used in our present study would be well within human exposure and consumption levels, respectively. In both the 2 and 4 week experiments the levels of flavonoids and pesticides used did not induce any signs of toxicity. Though in the 2 week study there was a slight decrease in feed intake and growth rate in pesticide-exposed groups, this was not apparent after 4 weeks of feeding and the bodyweight gain of rats was within normal range. The decrease in feed intake could be attributed to the taste imparted by the pesticide mixture to which the rats adapted after feeding of the pesticide mixture for 4 weeks such that their average feed intake and consequently their weight gain were similar to the control group.
Conclusions
Taken together the results of the present study suggest that feeding of diets containing high concentrations of an equimolar mixture of flavonoids with and without exposure to low levels of pesticides significantly modified tissue superoxide dismutase, increased total glutathione levels and reduced glutathione peroxidase activity. These changes may be largely attributed to both the antioxidant and prooxidant properties of flavonoids and the prooxidant or the inhibitory effects of pesticide metabolites on endogenous antioxidants. More importantly, this study underscores the prooxidant properties of flavonoids and as suggested by Moskaug and coworkers[ Citation 23 ] reiterates the risk of altering the balance of the intracellular redox regulator glutathione with the use of excessive flavonoid supplements.
Acknowledgments
The authors thank Joyce Owens, Animal Facility Manager and Cecil Butler for his able and unstinting assistance in oral gavage feeding, and for the care of experimental animals. This research was supported by the US Department of Agriculture (USDA) Evans Allen Grant to Kentucky State University (Grant # KYX-50-17H).
References
- Safe , S. H. 1998 . Hazard and risk assessment of chemical mixtures using toxic equivalency factor approach . Environ. Health. Perspect. , 106 ( Suppl 4 ) : 1051 – 1058 .
- Tordoir , W. F. and Stittert , N. J. 1994 . Organochlorines . Toxicology , 91 ( 1 ) : 51 – 57 .
- Heidli , C. C. , Snyder , R. , Kinoshita , R. and Steinberg , N. 1998 . Investigation of cytochrome P450 enzyme induction and DNA adduct formation in male CD/1 mice following oral administration of toxaphene . J. Appl. Toxicol. , 8 ( 3 ) : 173 – 178 .
- Klaunig , J. E. , Xu , Y. , Isenberg , J. S. , Bachowski , S. , Kolaja , K. L. , Kiang , J. , Stevenson , D. and Salborg , E. F. Jr. 1998 . The role of oxidative stress in chemical carcinogenesis . Environ. Hlth. Perspect. , 106 ( Suppl 1 ) : 289 – 295 .
- Janssen , Y. M. N. , Van Houton , B. , Borm , P. J. A. and Mossman , B. T. 1993 . Cell and tissue responses to oxidative stress . Lab. Invest. , 69 ( 3 ) : 261 – 274 .
- Renwick , A. G. 2006 . Toxicology of micronutrients: adverse effects and uncertainty . J. Nutr. , 136 ( 3, Suppl ) : 493S – 501S .
- Knekt , P. , Kumpulainen , J. , Jarvinen , R. , Heliovarra , M. , Reunanen , A. , Hakkulinen , T. and Aromaa , A. 2002 . Flavonoid intake and risk of chronic diseases . Am. J. Clin. Nutr. , 76 ( 3 ) : 560 – 568 .
- Yoshino , M. , Haneda , M. , Naruse , M. and Murakami , K. 1999 . Prooxidant activity of flavonoids: copper dependent strand breaks and the formation of 8-hydroxy-2′deoxyguanosine in DNA . Mol. Genet. Metab. , 68 ( 4 ) : 468 – 472 .
- Watjen , W. , Michels , G. , Steffan , B. , Niering , P. , Chovolou , Y. , Kampkotter , A. , Tan-Thi , Q-H. , Proksch , P. and Kahl , R. 2005 . Low concentrations of flavonoids are protective in rat H411E cells whereas high concentrations cause DNA damage and apoptosis . J. Nutr. , 135 ( 3 ) : 525 – 531 .
- Bachowski , S. , Xu , Y. , Stevenson , D. E. , Walborg , E. J. Jr. and Klaunig , J. E. 1998 . Role of oxidative stress in the selective toxicity of dieldrin in the mouse liver . Appl. Pharmacol. Toxicol. , 150 ( 2 ) : 301 – 309 .
- Bebe , F. N. and Panemangalore , M. 2003 . Exposure to low doses of endosulfan and chlorpyrifos modifies endogenous antioxidants in tissues of rats . J. Environ. Sci. Health, B Part , 38 ( 3 ) : 349 – 363 .
- Panemangalore , M. and Bebe , F. N. 2000 . Dermal exposure to pesticides modifies antioxidant enzymes in tissues of rats . J. Environ. Sci. Health, B Part , 35 ( 4 ) : 399 – 416 .
- Panemangalore , M. , Dowla , H. A. and Byers , M. 1999 . Occupational exposure to agricultural chemicals: effect on the activities of some enzymes in the blood of farm worker . Intl. Arch. Environ. Hlth. , 72 ( 2 ) : 94 – 98 .
- Hakkert , B. C. 2001 . Refinement of risk assessment of dermally and intermittently exposed pesticide workers: a critique . Ann. Occup. Hyg. , 45 ( 1001 ) : S23 – S28 .
- Sun , Y. , Oberley , L. W. and Li , Y. 1988 . A Simple Clinical Assay of Superoxide Dismutase . Clin. Chem. , 34 ( 3 ) : 497 – 500 .
- Smith , P. K. , Krohn , R. J. , Hermanson , G. T. , Mallia , A. K. , Gartner , F. H. , Provenzano , M. D. , Fujimoto , E. K. , Goeke , N. M. and Klenk , D. 1985 . Measurement of protein using bicinchoninic acid, Anal . Biochem. , 150 ( 1 ) : 76 – 85 .
- Flohé , L. and Gunzler , W. A. 1984 . Assays of Glutathione Peroxidase . Meth. Enzymol. , 105 ( 1 ) : 114 – 120 .
- Yang , C. S. 2006 . Dietary factors may modify cancer risk by altering xenobiotics metabolism and many other mechanisms . J. Nutr. , 136 ( 10, Suppl ) : 2685S – 2686S .
- Junquiera , V. B. C. , Koch , O. R. , Arisi , A. C. , Fusaro , A. P. , Azzalis , L. A. , Barros , S. B. , Cravero , A. , Farre , S. and Videla , L. A. 1997 . Regression of morphological alterations and oxidative stress-related parameters after acute lindane induced hepatotoxicity . Toxicology , 111 ( 2–3 ) : 199 – 205 .
- Nasuti , C. , Cantalamessa , F. , Falcioni , G. and Gabbianelli , R. 2003 . Different effects of Type II Type I pyrethroids on erythrocyte plasma membrane properties and enzymatic activities in rats . Toxicology , 191 ( 2–3 ) : 233 – 244 .
- Gao , Z. , Xu , H. and Huang , K. 2002 . Effect of rutin supplementation on antioxidant status and iron, copper, and zinc content in mouse liver and brain . Biol. Trace Elem. Res. , 88 ( 3 ) : 271 – 279 .
- Gao , Z. , Xu , H. , Chen , X. and Chen , H. 2003 . Antioxidant status and mineral contents of tissues of rutin and baicalin fed rats . Life Sci. , 73 ( 12 ) : 1599 – 1607 .
- Moskaug , J. O. , Carlsen , H. , Myhrstad , M. C. W. and Blomhoff , R. 2005 . Polyphenols and glutathione synthesis . Am. J. Clin. Nutr. , 81 ( 1; Suppl ) : 277S – 283S .
- Carlsen , H. , Myhrstad , M. C. , Thoresen , M. , Moskaug , J. O. and Blomhoff , R. 2003 . Berry intake increases the activity of γ glutamylcytsteine synthetase promoter in transgenic mice . J. Nutr. , 133 ( 7 ) : 2137 – 2140 .
- Lee-Hilz , Y. Y. , Boerboom , A. M. , Westphal , A. H. , Berkel , W. J. , Aarts , J. M. and Rietjens , I. M. 2006 . Prooxidant activity of flavonoids induces EpRE-mediated gene expression . Chem. Res. Toxicol. , 19 ( 11 ) : 1449 – 1505 .
- Boots , A. W. , Li , H. , Schins , R. P. , Duffin , R. , Heemskerk , J. W. , Bast , A. and Haenen , G. R. 2007 . The quercetin paradox . Toxicol. Appl. Pharmacol. , 222 ( 1 ) : 89 – 96 .
- Pastore , A. , Federici , G. , Bertini , E. and Piedmonte , F. 2003 . Analysis of glutathione: implication in redox and detoxification . Clin. Chim. Acta , 333 ( 1 ) : 19 – 39 .
- Gabbanielli , R. , Falcioni , G. , Nasuti , C. and Cantalamessa , F. 2002 . Cypermethrin - induced plasma membrane perturbation on erythrocytes from rats: reduction of fluidity in the hydrophobic core and in glutathione peroxidase activity . Toxicology , 175 ( 1–3 ) : 91 – 101 .
- Guletkin , F. , Ozturk , M. and Akdogan , M. 2000 . Effect of organophosphate insecticide chlorpyrifos-ethyl on lipid peroxidation and antioxidant enzymes . Arch. Toxicol. , 74 ( 9 ) : 533 – 538 .
- Bebe , F. N. and Panemangalore , M. 2005 . Pesticides and essential minerals modify endogenous antioxidants and cytochrome P450 in tissues of rats . J. Environ. Sci. Health, B Part , 40 ( 5 ) : 769 – 784 .
- Noroozi , M. , Angerson , W. J. and Lean , M. E. J. 1998 . Effects of flavonoids and vitamin C on oxidative DNA damage to human lymphocytes . Am. J. Clin. Nutr. , 67 ( 6 ) : 1210 – 1218 .
- Skibola , C. T. and Smith , M. T. 2000 . Health impacts of excessive flavonoid intake . Free Rad. Res. Biol. Med. , 29 ( 3–4 ) : 375 – 383 .
- Mennen , L. I. , Walker , R. , Benneteau-Pelissero , C. and Scalbert , C. 2005 . Risks and safety of polyphenol consumption . Am. J. Clin. Nutr. , 81 ( Suppl ) : 326S – 329S .
- Gallo , M. A. and Lawryk , N. J. 1991 . “ Organophosphate pesticides ” . In Handbook of Pesticide Toxicology , Edited by: Hayes , E. J. and Laws , E. R. Volume 2 , 917 – 1123 . San Diego, CA : Academic Press .
- Silkworth , J. B. Jr. and Brown , J. F. 1996 . Evaluating the impact of exposure to environmental contaminants on human health . Clin. Chem. , 42 ( 8 ) : 1345 – 1349 . part 2