
Abstract
The impact of the growing environment on the aroma of agricultural products such as wine, coffee, or tea has been investigated in detail, leading to the concept of regional identity; however, there have been only limited studies examining regional variation in hops. A systematic investigation of Cascade and Mosaic® hops from the 2020 harvest year grown at 39 different locations in Oregon and Washington was performed using chemical/instrumental and human sensory analyses, which revealed significant between-state and within-state differences for both varieties, suggesting substantial regional and subregional identity effects. A subset of 14 hop samples was selected to produce standardized single-hop beers (IPA) in pilot scale. Sensory evaluation of the beers revealed similar regional-dependent results as observed for the hops with slightly stronger fruity, citrus, and tropical notes but weaker herbal, grassy, and woody notes in the beers compared to hops, suggesting that the regional identity effect was observable in beer.
Introduction
Hops (Humulus lupulus) are one of the most important raw materials for beer production. In beer, hops provide bitterness, caused primarily by the isomerization of hop α-acids,[Citation1] as well as the characteristic hop aroma resulting from volatile compounds in the essential oil fraction,[Citation2] which can differ greatly depending on hop variety,[Citation3] hop quantity, and processing technology.[Citation4] Hop aroma is an important and often the most defining product characteristic for hop-forward beer styles. In the course of the growing craft beer market, there is a demand for increased product diversity from aroma hops.[Citation5] In 2020, the USA (40%), Germany (39%), China (6%), and the Czech Republic (5%) were the leading countries in terms of hop production volume.[Citation6] The global popularity of hop-forward beers is driven by a broad consumer appeal of aroma hops, thereby heightening the influence that American hops such as Citra®, Cascade, and Mosaic® have globally.[Citation7] Several previous studies demonstrate that with the same hop variety, the sensory and chemical properties of hops grown in different countries vary significantly. In this context, it has been reported that comparable hop varieties grown in Canada, the UK, and the USA, as well as dry-hopped lager beers produced from these hops, exhibit significantly different sensory profiles.[Citation8] Similar differences in the analytical and brewing characteristics were observed between Cascade and Comet hops grown in Yakima, Washington (WA), USA and grown in Hallertau, Germany.[Citation9] Furthermore, it has been reported that Cascade hops grown in Italy showed significant differences in bitter acids and xanthohumol content compared to those grown in the USA, Germany, and Slovenia.[Citation10] The fruity black currant-like aroma compound, 4-mercapto-4-methylpentan-2-one (4MPP), was quantified in beers produced from 15 hop varieties grown in different countries but was, in contrast to beers brewed with European hops, only present in beers brewed with hops from the USA, New Zealand, and Australia.[Citation11]
These studies focused on the impact that different global growing regions have on hop quality parameters. However, there are limited published studies examining the impact of regional or subregional growing environments within the same country or growing region(s) on hop quality parameters. Morcol et al. recently suggested a strong difference in hexyl glucosides, important bound aroma precursors in hops, between two growing regions within the USA: the Yakima Valley in central Washington and the Kootenay River Valley in northern Idaho (ID). Interestingly, these regional differences were not observed for all glycosidically bound aroma precursors.[Citation12] It has been demonstrated by Pepi et al. that it is possible to distinguish hops grown in different regions of Italy by analyzing major and minor geochemical elements in hop cones to identify their origin.[Citation13] However, the impact of the growing region on hop aroma and quality was not assessed in this study. In another study, the effect of the local environment on the hop variety Amarillo grown at different locations in the northwestern USA (WA and ID) was investigated, thereby revealing divergent flavor observations and different hop essential oil compositions in beers brewed with Amarillo hops.[Citation14] Comparable differences were observed for Centennial and Sterling hops grown at five different locations in the Willamette Valley, Oregon (OR), USA.[Citation15] A recent study investigated the chemical and aroma differences between Mosaic, Simcoe, and Strata hops grown at eleven different locations throughout the Willamette Valley in Oregon, USA.[Citation16] While hop variety had the largest influence on the differences between hop samples, the growing regions were shown to result in significantly different properties between hops of the same variety.
For other products such as wine,[Citation17,Citation18] coffee[Citation19] or cannabis,[Citation20] the concept of regional identity or terroir is far more advanced and has been established as a commonly used discrimination criterion.[Citation21–22] Within the scope of previous studies, the term regional identity or terroir has been defined as the sum of all environmental factors influencing an agricultural product including climate, soil, and cultivar,[Citation23] but it may also include agronomic elements since growing factors such as irrigation demand and disease pressure are often a function of the growing region.
In times of a growing appreciation for regionally and/or locally produced beer,[Citation24] reinforcing the concept of hop regional identity provides an opportunity for hop growers and the hop processing industry to add value to their products by investigating and understanding hop quality traits that are influenced by a growing region, a subregion or potentially even a single field.[Citation25] Cascade and Mosaic® represent two of the most important aroma hop varieties grown in the USA in the past several years.[Citation26] However, there is, to our knowledge, no data published on the regional identity of these two hop varieties grown in the Willamette Valley (OR, USA) and the Yakima Valley (WA, USA).
Therefore, the objectives of this study were to 1) chemically characterize 39 Cascade and Mosaic® hop samples from the 2020 harvest year grown in different regions of Oregon’s Willamette Valley and Washington’s Yakima Valley, by analyzing hop acids via HPLC-DAD and by quantitating selected compounds in the hop essential oil via GC-FID, 2) to sensorially characterize the aroma of these hop samples using a trained panel, 3) to combine chemical and sensory results by applying multivariate statistics to define groups and identify overall differences among the samples caused by regional influences and 4) to produce dry-hopped beers from a selection of these hop samples on a pilot-scale to evaluate if the regional effects are similarly noticeable in the final beers.
Experimental
Hops
Cascade and Mosaic® hops grown commercially in the Willamette Valley (OR) and the Yakima Valley (WA) were included in this study. Cascade hop sites included ten fields in Oregon (CO1 − CO10) and nine fields in Washington (CW1 − CW9), while Mosaic® sample plots were located in eight fields in Oregon (MO1 − MO8) and twelve fields in Washington (MW1 − MW12, ).
Figure 1. Field locations of the Cascade (C) and Mosaic® (M) hops grown in the Willamette Valley, Oregon (A, left) and (B) the Yakima Valley, Washington (B, right). Labeling convention is variety, state, and field number; for example, CO7 refers to Cascade hops grown in Oregon at field number 7.
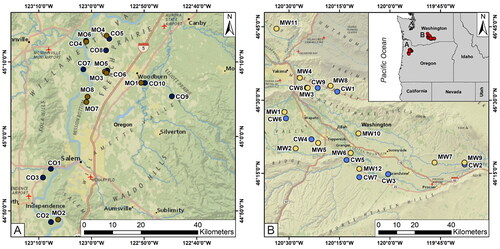
During late May−early June 2020, each site was scouted with each farm’s owner or farm manager and a consulting soil scientist to identify a location within each hop field that was representative of the site in terms of soil composition, lack of historical growing abnormalities or difficulties, and representative plant vigor for the site. Each sample plot was located well inside the borders of each hop field at a minimum of 20 m from the edge of the field to prevent edge effects related to wind or sun exposure from influencing hop qualities. For Cascade fields, a plot consisting of 5 adjacent rows by approximately 20 hills long was identified, and plants were tagged with a plant-specific identification tag. Within each of the 5 rows, hop plants were chosen every 3 − 5 plants to achieve a sample set of 20 plants per plot. The selections were based on presentation of typical vigor for the field being sampled. Due to higher anticipated yield, the Mosaic® plots required only 15 plants in total at each site, and they were sampled from a 5 row × 15 hill subplot.
To alleviate potential concerns about genetic impurity of Cascade fields included in the study, each individual plant was DNA fingerprinted for clonal purity using Single Nucleotide Polymorphic (SNP) markers. Seven SNP markers that have been identified by Henning et al.[Citation27] were used to validate the clonal purity. Leaf material was collected from each individual plant included in the study (N = 380, 19 fields × 20 plants per field), these were then pooled together five leaf samples at a time using a 96 cell BioArk Leaf Kit (LGC Biosearch Technologies, Novato, CA). The DNA extraction and KASP genotyping was performed by LGC Biosearch Technologies. The results were analyzed and concluded to contain no genetic off types in all test samples.
Field management throughout the growing season was at the discretion of the grower but the research team collected management data including timing of hop pruning and stringing of hop plants, fertilization amounts and type throughout the growing season, and the number of pesticide and insecticide applications.
Hops were harvested within 1.5 days of the commercial harvest date as determined by the grower. The harvest window for Cascade was August 23 – September 6, 2020, and for Mosaic® it was September 1 − September 19, 2020. Hops were picked in Oregon using a mobile picker (Hopster® Hopharvester, Rochester, NY) and in Washington using a single, on-farm smaller-scale picker (WOLF WHE 140/1 Anlagen-Technik GmbH, Geisenfeld, Germany). The cones were placed into mesh bags (5 − 15 kg wet, depending on bag size) and transported to a commercial hop farm near Independence, OR or Toppenish, WA where they were dried alongside and covered with loose hops in a commercial kiln at 57 °C. Post drying, the hops from Oregon were transported to Oregon State University for pelletizing, while those from Washington were pelletized on site and the farm performing the hop drying. After pelletizing, the hops were stored in vacuum-evacuated and nitrogen-flushed high-barrier bags at −18 °C. The dry matter of the hop cones at harvest ranged from 19.3% to 26.8% (wt/wt), while the moisture content of the hop pellets ranged from 4.3% to 9.7% as determined using standard methods.[Citation28]
Beers
Single-hop standardized beers (IPA, dry-hopped) were simultaneously brewed at a 2.5 hL pilot-scale as described previously[Citation29] by applying the same brewing process for each beer and just varying the hops used for the kettle (targeting 40 IBU) and whirlpool hop addition (300 g/hL) as well as dry-hopping (800 g/hL) and fermentation at 20 °C, using the standard ale yeast strain Wyeast 1056 (Wyeast Laboratories, Hood River, OR). The fermentation performance was monitored daily by measuring the decrease in apparent extract with a DMA 35 Density Meter (Anton Paar, Ashland, VA) as documented in the Supporting Information (Tables S1 and S2). All 14 beers were similarly aged at the point of chemical and sensory analysis. Final ethanol concentrations by volume were measured with an Alcolyzer ME (Anton Paar) and ranged from 6.76% to 6.82% vol/vol.
Reference compounds
The compounds 3-carene, (E)-β-caryophyllene, caryophyllene oxide, p-cymene, farnesene, geranial, geraniol, geranyl acetate, geranyl butyrate, α-humulene, humulene epoxide I, humulene epoxide II, limonene, linalool, 3-methylbutanoic acid, methyl geranate, methyl heptanoate, myrcene, neral, nerol, α-pinene, β-pinene, terpinen-4-ol, and α-terpineol were purchased from Sigma Aldrich (St. Louis, MO). International Calibration Extract ICE-4 containing 10.98% cohumulone, 31.60% adhumulone, 13.02% colupulone, 13.52% adlupulone, 42.58% total α-acids, and 26.54% total β-acids was purchased from ASBC (Saint Paul, MN).
Miscellaneous chemicals and reagents
Diethyl ether, hexane, hydrochloric acid, methanol, methyl cyclohexane, and phosphoric acid were purchased from Merck (Darmstadt, Germany). Octan-2-ol was purchased from Alfa Aesar (Heysham, UK).
GC-FID
An HP 5890 Series II gas chromatograph coupled with an FID detector (both Hewlett-Packard, Palo Alto, CA) was equipped with a fused silica column, Zebron ZB-1, 30 m × 250 μm × 0.25 μm film (Phenomenex, Torrance, CA, USA). Operating conditions were as described in the literature.[Citation30]
HPLC-DAD
An HPLC 1200 system coupled with a G1315B DAD (both Agilent, Santa Clara, CA) was equipped with a Kinetex EVO C18 LC column, 30 × 2.1 mm, 2.6 µm particle size, 100 Å pore size (Phenomenex, Torrance, CA), and it was operated according to the literature.[Citation31]
UV-Spectrophotometer
A UV-1700 PharmaSpec spectrophotometer (Shimadzu, Columbia, MD) was used to determine the hop storage index (HSI).
Quantitation of hop acids
Total α-acids, and total β-acids were determined by means of HPLC-DAD and as previously described using International Calibration Extract ICE-4 (ASBC) as the calibration standard.[Citation31]
Hop storage index (HSI)
The HSI of hop samples was determined by UV-spectrophotometer as described in the literature.[Citation32]
Quantitation of selected hop essential oil compounds
Hydrodistillation was performed to determine the total amount of hop essential oil in the homogenized hop grist according to the literature.[Citation33] GC-FID was applied to quantitate selected terpenes and terpenoids in the hop essential oil as previously described based on octan-2-ol as an internal standard.[Citation30]
Sensory evaluation of the hop aroma
The sensory panel consisted of 12 individuals from Oregon State University (7 males and 5 females, age 22–56), who had experience evaluating hop and beer aroma and previous experience on a descriptive panel. All subjects gave their informed consent for inclusion before they participated in the sensory analysis. Approval for this work was granted by Institutional Review Board at OSU (Study Number IRB-2019-0247). Panelists were trained to perform ultra-flash profiling (UFP) to evaluate the aroma of the hop samples.[Citation34,Citation35] A room with neutral stimulus was selected for panel execution, and conditions were held consistent across sensory sessions. Hop pellets were stored in vacuum bags at −18 °C and ground before the sensory evaluation using a QB3000 grinder (Shark Ninja, Newton, MA) for 2 × 10 s at 1200 rpm. By applying UFP to the hop samples, a pool of 14 attributes was developed to best represent the observed aroma differences. Training sessions were performed using food references and aroma references for each attribute, respectively. Data collection was performed using Compusense Cloud 21.0.7713.26683 (Compusense, Ontario, Canada). Separate sensory sessions were performed for Oregon Cascade hop samples (N = 10), Washington Cascade hop samples (N = 9), Oregon Mosaic® hop samples (N = 8), and Washington Mosaic® hop samples (N = 12). Ground hop samples (4 g each) were presented simultaneously in black, sealed 50 mL flat plastic cups labeled with three-digit random codes. General randomization was utilized for the samples, and the panelists were asked to assign attributes from the agreed-upon lexicon to each of the samples by using a check-all-that-apply (CATA) approach.[Citation36] Outputs included a frequency table outlining attributes used to describe the aroma of each sample.
Sensory evaluation of the beer aroma
Sensory analysis of beers was performed as previously described for hop samples by applying the same attribute lexicon and the same panel. Separate sensory sessions were performed for the Cascade-derived beer samples (N = 7) and the Mosaic®-derived beer samples (N = 7). A 50 mL sample of each beer was presented simultaneously in 250 mL beer sensory glasses and evaluated at ∼15 °C.
Statistical analysis
Cochran’s Q test, Correspondence Analysis (CA), Kruskal-Wallis test, Agglomerative Hierarchical Clustering (AHC), and Multiple Factor Analysis (MFA) were performed using XLSTAT Premium 2020.5.1 (Addinsoft, NY, U.S.A.). Box and Whisker plots were obtained using RStudio 1.4.1103 (RStudio, Boston, MA) and ggplot2 3.3.2.[Citation37]
Results and discussion
Characterization of hops
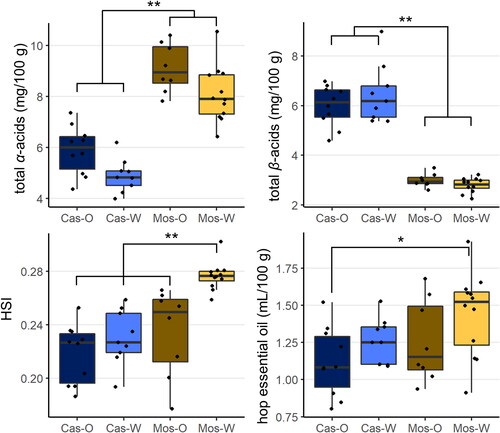
The hop quality parameters total α-acids, total β-acids, HSI, and the total amount of hop essential oil were determined for all 39 Cascade and Mosaic® hop samples grown in Oregon and Washington to perform a first characterization. To allow for better comparability between samples, data were normalized to a hop moisture content of 8% (). The concentration of total α-acids and β-acids ranged from 4.0 − 10.5 mg/100 g and 2.0 − 8.8 mg/100g, respectively. A Kruskal-Wallis test was applied to the data (which was not normally distributed for all parameters) revealing that the Mosaic® samples overall showed significantly higher concentrations of α-acids and lower concentrations of β-acids compared to the Cascade samples and that there were no significant differences based on growing region (OR vs. WA). The concentration ranges for both hop varieties were within the expected published ranges.[Citation38–40] The Hop Storage Index (HSI), which is commonly used to estimate losses of α-acids and β-acids during harvest, handling, and storage of hops ranged from 0.18 to 0.30. Overall, there were no significant differences in HSI, suggesting a limited effect of regional identity on this parameter, except for the Washington Mosaic® samples, which had significantly higher HSI values of 0.26 − 0.30. While these values were in line with typical HSI for fresh hops and the respective industry specifications,[Citation39] the significantly higher values for the Washington Mosaic® fields have been attributed to the high wind event in the Yakima Valley just prior to the Mosaic® harvest that impacted this variety throughout the entire valley (M. Raver, personal communication, April 20. 2021). However, the specific impact of this wind event on the quality of the hops from this region are in parts still unclear. The total amount of hop essential oil as obtained by hydrodistillation ranged from 0.80 to 1.92 mL/100 g, which was in line with data previously reported for Cascade (1.2 − 2.1 mL/100 g)[Citation38] and Mosaic® hops (1.0 − 1.5 mL/100 g).[Citation40] There was no apparent growing region effect on total oil content within each hop variety, but there was a significant difference between the Washington Mosaic® hops and the Oregon Cascade hops.
Figure 2. Total α-acids, total β-acids, Hop Storage Index (HSI), and total essential oil content in hops as a function of variety, Cascade (Cas) versus Mosaic® (Mos), and growing region, Oregon (O) and Washington (W). Asterisks indicate significant differences between the sample groups according to Kruskal-Wallis test (* for p ≤ 0.05, ** for p ≤ 0.01). Black dots represent the respective data of the individual hop samples within each sample group.
Quantitation of selected hop essential oil compounds
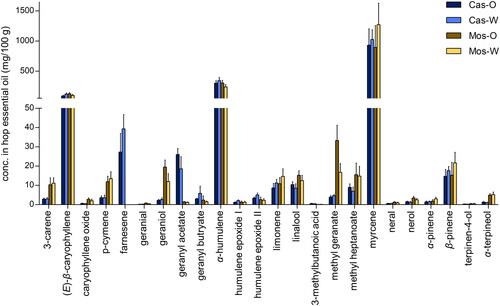
To assess the volatile composition of the hop samples, the hydrodistilled hop essential oil was analyzed for 24 different terpene and terpenoid compounds with quantitation achieved via GC-FID. Although other hop essential oil constituents such as thiols also play an important role in the hop aroma, these terpenes and terpenoids are known to significantly contribute to the hop aroma and the aroma of dry-hopped beers,[Citation2,Citation40–44] especially in the case of the two hop varieties investigated in this study. A Kruskal-Wallis Test was applied for each quantitated hop oil compound to identify significant differences between the four sample groups (by state of origin and variety). From a varietal comparison perspective, farnesene was present in Cascade but not Mosaic®, and it was more abundant in the Washington Cascade samples () although these differences were slightly below the significance threshold (Kruskal-Wallis Test, p > 0.05). Geranyl acetate was significantly higher in the Cascade hops compared to the Mosaic® hops, and it was found at higher concentrations in the Oregon Cascade samples. Mosaic® hops were significantly higher in 3-carene, p-cymene, geraniol, methyl geranate, methyl heptanoate, and α-terpineol compared to Cascade hops. Geraniol and methyl geranate were more abundant in the Mosaic® samples originating from Oregon compared to those originating from Washington. The remaining 16 compounds exhibited no significant differences between the two varieties or growing regions. The compounds geraniol, geranyl acetate, geranyl butyrate, α-humulene, humulene epoxides I and II, linalool, methyl geranate, myrcene, neral, and α-terpineol have previously been quantitated in Cascade hops grown in Washington by Lam et al,[Citation39] and the concentrations that we observed in the present study fall mostly in line with their results. Differences between the hop samples within each of the four groups (Cas-O, Cas-W, Mos-O, and Mos-W) will be discussed in the section “Assessment of Hop Terroir” to evaluate subregional variation.
Figure 3. Concentrations averaged across all fields within each state (by variety) of selected compounds quantitated in the hop essential oil by GC-FID, calculated from the means of duplicate or triplicate analytical replicates for each sample (CV ≤ 20%, N = 8 − 12).
Sensory evaluation of the hop aroma
The aroma of the 39 Cascade and Mosaic® hop samples was evaluated by applying CATA using a trained sensory panel. The frequency, at which the predetermined attributes were selected by the panelists to describe the aroma of the hop samples (CATA) ranged from 7 (burnt) to 264 (resinous), representing a range from 0.01% to 56% of the highest possible frequency (39 samples × 12 panelists = 468, Table S3). Four out of the 14 attributes were selected at frequencies < 25% of the maximum frequency among all attributes (which was resinous) and in addition showed no significant differences between samples according to Cochran’s Q test. These four attributes were therefore excluded to reduce noise in the dataset. The remaining ten attributes in order of decreasing frequency were resinous, sweaty, citrus, tropical, herbal, grassy, vegetal, woody, floral, and fruity. These observations were well in line with recent studies reporting the aroma of Cascade hops as resinous, citrus, tropical, herbal, and fruity (grown in Washington, Oregon, and Idaho)[Citation3]; as fruity, floral, citrus, and herbal (grown in Washington)[Citation9]; as citrus, herbal, woody, floral, and fruity (grown in Washington)[Citation43]; as well as grassy, citrus, and floral (grown in Oregon and Canada).[Citation8] Compared to Amarillo, Citra, Hallertau Blanc, Sorachi Ace, and Saaz hops, the aroma of Cascade hops grown in Washington has been described as especially floral with a moderate citrus note, potentially as the result of high amounts of geraniol and linalool.[Citation44] In contrast, the aroma of Mosaic® hops grown in Washington has been reported as sweaty, citrus, grassy, herbal, vegetal (onion), and floral.[Citation40]
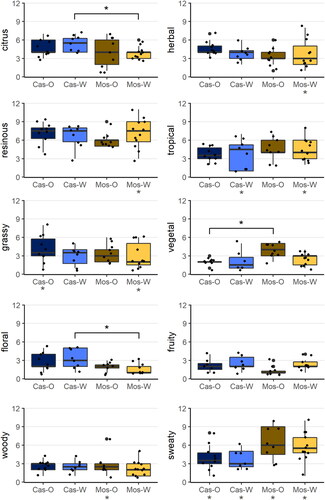
To evaluate differences in aroma between the two hop varieties and growing regions, the samples were grouped accordingly (Cas-O, Cas-W, Mos-O, and Mos-W) to create a Box and Whisker plot for each attribute (). Based on the Kruskal-Wallis test (brackets and asterisks above the Box-Whisker-plots), significant differences were observed in the frequency of citrus, vegetal, and floral attributes between at least two of the four sample groups. Most of these differences were between Cascade and Mosaic® hops, which was to be expected given they are aromatically different hops. Based on the amount of variation within each of the four sample groups, Cochran’s Q test (asterisks below each group name) revealed significant aroma differences for the attributes herbal (Mos-W), resinous (Mos-W), tropical (Cas-W and Mos-W), grassy (Cas-O and Mos-W), woody (Mos-O), and sweaty (all four groups), indicating that the Mosaic® hops grown in Washington exhibited the highest amount of subregional variation. Overall, it was also observed that for most attributes, the variation within the Mosaic® groups was larger than within the two Cascade groups. This reflects the especially complex aroma of Mosaic® hops as reported throughout the literature, which can have very different properties depending on a variety of factors including the origin.[Citation16,Citation40]
Figure 4. CATA sensory attribute frequencies (count data) for hop aroma descriptors assigned by a trained sensory panel (N = 12). Asterisks indicate significant differences between and within sample groups according to Kruskal-Wallis test and Cochran’s Q test, respectively (* for p ≤ 0.05, ** for p ≤ 0.01). Black dots represent the sum of attribute frequencies among the 12 panelists for each hop sample.
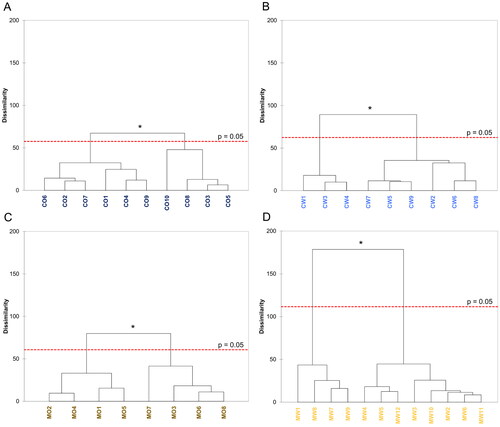
To further investigate and visualize differences between the hop samples within each of the four groups separated by state of origin and variety, an Agglomerative Hierarchical Clustering (AHC) was applied to the previously obtained sensory results (CATA) by calculating their overall dissimilarities displayed in the form of dendrograms (). Overall, AHC revealed two significantly different categories of samples within each of the four groups (p ≤ 0.05). The Mosaic samples from Washington exhibited the largest amount of variation within their group as indicated by a dissimilarity of 180 between samples MW1, MW7, MW8, and MW9 on one side and the significantly different remaining eight samples on the other side (), confirming previous observations (). On the contrary, Oregon Cascade samples had the lowest amount of sensory variations as indicated by a dissimilarity of up to 70, which nonetheless resulted in significant differences between a group consisting of CO1, CO2, CO4, CO6, CO7, and CO9 and a second group consisting of CO3, CO5, CO8, and CO10 (). A similar trend was observed for the Cascade samples from Washington with a dissimilarity of up to 95 and samples CW1, CW3, and CW4 being significantly different from the rest of the group (). The Oregon Mosaic samples could be separated into two significantly different groups with a dissimilarity of 80 consisting of four samples each (MO1, MO2, MO4, and MO5 vs. MO3, MO6, MO7, and MO8). Furthermore, a number of subcategories down to the individual samples or pairs of samples were identified for each of the four sample groups, however, these subcategories were not significantly different compared to each other (p > 0.05).
Figure 5. Agglomerative Hierarchical Clustering (AHC) applied to the sensory results obtained by CATA of the Cascade hops grown in Oregon (A) or Washington (B) and Mosaic® hops grown in Oregon (C) or Washington (D) displayed as dendrograms indicating their overall dissimilarities within each group. Dashed red lines represent the significance threshold of p = 0.05 with groupings above the line exhibiting significant differences.
Assessment of hop terroir
Combining the chemistry and sensory datasets via multiple factor analysis (MFA) enabled further assessment of regional (Oregon vs. Washington) and subregional differences among the 39 analyzed hop samples to identify overall regional identity or terroir within each hop variety (). In total, 34 variables were included in the MFA, of which 24 were chemical parameters (quantitative) and ten were sensory attributes (frequency data, qualitative). The chemistry and sensory groups were weighed equally in the MFA.
Figure 6. Multiple Factor Analysis applied to the combined volatile and nonvolatile chemistry and human sensory CATA results for Cascade hops (panels A & B) and Mosaic® hops (panels C & D) grown in Oregon and Washington.
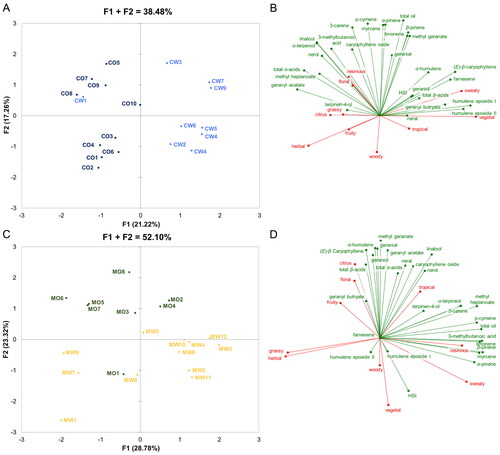
The MFA biplot for the Cascade hops displays 38.48% of the total variation in the dataset divided between factors F1 (21.22%) and F2 (17.26%, ). Furthermore, the analysis revealed a clear separation between Cascade samples from the two different regions on axis F1 with samples from Oregon being located in the left half (quadrants one and three), whereas samples from Washington are located in the right half (quadrants two and four) of the figure. Sample CW1 however forms an exception by showing proximity to the Oregon samples located in the upper left quadrant. The Cascade samples from Oregon were characterized by higher amounts of α-acids, 3-carene, caryophyllene oxide, geranyl acetate, linalool, 3-methylbutanoic acid, methyl heptanoate, nerol, terpinen-4-ol, and α-terpineol as well as strong citrus, floral, fruity, herbal, and resinous aroma (). In contrast, the Cascade hops from Washington exhibited higher amounts of β-acids, farnesene, geraniol, geranyl butyrate, humulene epoxides I and II, methyl geranate, neral, β-pinene, and total hop essential oil as well as stronger tropical and sweaty aroma.
Subregional differences between the Cascade hops grown in Oregon and those grown in Washington can be observed on axis F2 with a comparable amount of variation between the two states. These differences can mostly be attributed to the compounds p-cymene, geranial, limonene myrcene, and α-pinene as well as the aroma attributes woody, resinous, and floral. Thereby, samples CO5, CO7, CO9, and CW3 exhibited high concentrations of these compounds and strong floral and resinous aroma as well as weak woody aroma. On the contrary, samples CO1 − 4, CO6, CW2, CW4 − 6, and CW8 showed a lower abundance of the beforementioned compounds, weaker floral and resinous aroma, and stronger woody aroma. In the hop sample CO10, none of the chemical parameters or aroma attributes were especially strong or weak as shown by its location near to the origin. Thus, this sample exhibited moderate values for all 34 variables. Overall, the variables did not contribute equally to the separation of the Cascade hops as displayed by a shorter (weaker contribution) or longer distance (stronger contribution) from the origin in the respective direction. Thus, compounds geraniol, geranyl butyrate, α-humulene, neral, and terpinen-4-ol as well as HSI and total β-acids contributed relatively little to the within-Cascade variation as was the case for the aroma attributes citrus, floral, fruity, and grassy.
The MFA biplot of the Mosaic® dataset displayed 52.10% of the total variation in the dataset divided between factors F1 (28.78%) and F2 (23.32%, ). Similar to the previously discussed Cascade hops, there was a clear separation between the samples originating from the two different states, which is mostly shown on axis F2 with the Mosaic® samples from Oregon being located in the upper half and those from Washington mostly located in the lower half of the biplot. The exception was sample MO1 which was located in proximity to the Washington Mosaic® samples in the lower left quadrant. The Mosaic® hops originating from Oregon were mostly characterized by high concentrations of α-acids, β-acids, (E)-β-caryophyllene, geranial, geraniol, geranyl butyrate, α-humulene, linalool, methyl geranate, and neral as well as strong citrus, floral, fruity, and tropical aroma (). In contrast, the Mosaic® hops originating from Washington exhibited higher concentrations of humulene epoxides I and II, myrcene, α-pinene, β-pinene, and a higher HSI as well as a stronger sweaty, vegetal, and woody aroma.
Subregional differences between the Mosaic® hops grown in Oregon and those grown in Washington can mostly be observed on axis F1, whereby the variation among Washington grown hops was slightly higher than the variation among the Oregon grown hops. These subregional differences can mostly be attributed to the compounds 3-carene, p-cymene, 3-methylbutanoic acid, methyl heptanoate, terpinen-4-ol, α-terpineol, and the amount of total hop essential oil as well as the aroma attributes grassy, herbal, and resinous. The samples MO2, MO4, MW2 − 4, MW6, and MW10 − 12 exhibited high amounts of these compounds as well as total hop essential oil, a strong resinous aroma, and a weak grassy and herbal aroma, while samples MO5 − 7, MW1, MW7, and MW9 showed lower amounts of the aforementioned compounds as well as total hop essential oil, a stronger grassy and herbal aroma, and a weaker resinous aroma. In the hop sample MW5, none of the chemical parameters or aroma attributes were especially strong or weak as shown by its location near to the origin. Thus, this sample exhibited moderate values for all 34 variables.
Similar to the previous observations for the Cascade hops, the variables differed greatly in their contribution to the separation of the Mosaic® hops. Geranyl butyrate, humulene epoxides I and II, and terpinene-4-ol as well as the aroma attribute woody contributed relatively little, whereas the majority of the variables exhibited medium to high contributions. The compound farnesene is not found in Mosaic® hops and thus did not contribute to (sub)regional variation as it did for Cascade hops.
Transfer of the hop terroir effect to beer
A subset of 14 out of the 39 hop samples was selected based on the previously discussed chemical and sensory differences (4 × CO, 3 × CW, 3 × MO, 4 × MW) to produce dry-hopped single-hop beers on a 2 hL pilot-scale and to evaluate if the aroma differences observed for the hops was transferred to the final product beer. The aroma of these beers was evaluated by applying the same trained sensory panel and the same methodology as previously described for the hop aroma evaluation. Detailed frequency data obtained by the beer aroma evaluation is given in the supporting information (Table S4). Similar to the previous results for the hop samples (cf. Table S3), 5 out of the 14 aroma attributes were selected at relatively low frequencies (< 25% of the maximum frequency) among attributes (citrus) and were excluded for further evaluation. In contrast to the hops, the attribute melon was selected at a frequency above the threshold (27%) and was therefore relevant for beer aroma, whereas the attributes woody and grassy, which were selected at frequencies of 36% and 49% in the hops, respectively, were on average less relevant in the beers (18% and 25%). Overall, most of the major aroma attributes identified in the hops also played an important role for the aroma of the beers. However, the importance of the attributes resinous, sweaty, and herbal decreased from hops to beers, whereas the attributes citrus, tropical, fruity, and floral were more important in the beers than they were in the hops. This is well in line with the known formation of fruity and floral aroma fermentation-derived volatiles such as esters[Citation45–47] and a reduction of grassy, vegetal, and herbal aroma compounds such as aldehydes during the brewing process.[Citation48,Citation49] Statistical analysis using a Cochran’s Q test revealed significant differences between the beers for the attributes fruity (p = 0.038), resinous (p = 0.020), and herbal (p = 0.010).
A Correspondence Analysis applied to the sensory results of the Cascade beers overall included 70% of the variation in the dataset (). Factor F1 was primarily defined by the attributes sweaty, resinous, melon, and floral, accounting for ∼2/3 of the displayed variation, whereas factor F2 was mostly defined by the attributes vegetal, herbal, and fruity and covered the remaining ∼1/3 of the displayed variation. One group of beer samples consisting of CO2, CO4, and CW2 exhibited a dominant tropical, floral, and melon aroma with sample CW2 also possessing strong fruity notes. Beers CW1, CW9, and CO5 formed a second group sharing several aroma properties such as sweaty, resinous, and herbal as well as a lower frequency of citrus notes with the aroma of CW9 as the most sweaty and the aroma of CW1 as the most resinous and herbal. Sample CO10 was clearly separated from the other beers with a primarily vegetal and slightly citrus aroma. Overall, there was a high amount of variation in aroma properties between the beers produced from Cascade hops showing three major groupings. The variation between samples containing hops from the two growing regions was comparable in scale to the variation between samples containing hops from the same growing regions. However, the aroma attribute vegetal was only of major importance in one of the beers brewed with Oregon Cascade hops (CO10).
Figure 7. Correspondence Analysis for the CATA results of the beer aroma evaluated by a trained sensory panel for beers brewed with Cascade (A) or Mosaic® (B) hops originating from Oregon or Washington.
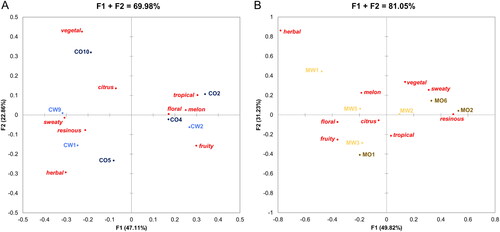
The same statistical approach was applied to the results of the Mosaic® beers yielding 81% of the aroma variation being described by the first two factors, with factor F1 contributing with 50% and factor F2 contributing with 31%. Factor F1 was mostly defined by the attributes floral, fruity, and resinous, whereas factor F2 was defined by attributes such as vegetal, sweaty, and tropical. Similar to the Cascade beers, the beers containing Mosaic® hops showed a high amount of variation in aroma properties. The differences between samples containing hops from the two growing regions were comparable in scale to the differences between samples containing hops from the same growing regions. The two beers MO2 and MO6, which contained Mosaic® hops from Oregon had a dominant resinous and sweaty as well as a slightly vegetal aroma, whereas samples MO1 and MW3 exhibited a fruity, tropical, and slightly citrus and floral aroma. Furthermore, the aroma of the beer MW5 was characterized by melon, citrus, and floral notes. Sample MW2 was located close to the origin of the plot, indicating that this beer did not have a particularly strong aroma in any specific attribute but possessed weaker notes of almost all attributes. Beer MW1 was separated from the other samples by possessing a strong herbal aroma, which was not perceived in any of the other beers. Overall, the beers containing Mosaic® hops from Oregon had a slightly more vegetal, sweaty, and resinous aroma, whereas the beers containing Mosaic® hops from Washington seemed to exhibit a more fruity, floral, and herbal aroma.
In summary, there has been a limited number of studies investigating hop regional identity either on a global level (between states or countries)[Citation8–11] or on a local level (within one specific region).[Citation12–16] This study for the first time combined these two different perspectives on hop regional identity by conducting a large-scale investigation and performing a systematic side-by-side comparison of hops from different states, regions, and subregions. Our results revealed a high amount of variation in aroma and chemical composition between and among Cascade and Mosaic® hops grown in Oregon and Washington. This regional identity effect was observed on a regional (between state) and a local (within state) level. By combining chemical hop analysis and sensory evaluation of the hop aroma, significant differences were identified that clearly separated the hop samples from the two growing regions. Furthermore, significant differences were observed between hops from different local fields within each of the two regions, which was well in line with the results previously reported by Van Simaeys et al. for Mosaic® hops grown at different locations throughout the Willamette Valley in Oregon.[Citation16] The differences identified in this study, which were either caused by regional or local identity were comparable in scale and were identified for both investigated hop varieties, although their distinct characteristics led to a qualitatively different outcome for the Cascade and the Mosaic® hops. As shown by the aroma properties of the beers produced with a subset of these Cascade and Mosaic® hops, the amount of variation between the hops from the different regions and fields within each of those regions was mostly transferred from the hops to the finished beers.
These results are relevant for hop growers in the Pacific Northwest of the United States as well as brewers utilizing hops from this major hop growing region to either produce regionally unique beers or to blend hops in a way that results in standardized and constant beer quality. The degree to which other commonly used Oregon- and Washington-grown aroma hop varieties such as Citra®, Simcoe®, Centennial, Amarillo®, or Strata™ display regional differences must be examined through additional research, and future studies must be carried out over several years to gauge the amount of variation between different harvest years amid changing environmental conditions, as well as the persistence of the regional and subregional differences. There are, up to this point, only a very limited number of studies published that address this for Cascade and Mosaic® hops, however, recent studies on other hop varieties such as Saaz, Agnus, Admiral, Wye Challenger, and First Gold reported a high dependency of hop quality parameters such as the concentration of α-acids, β-acids, desmethylxanthohumol, and xanthohumol on the climatic conditions.[Citation50–52] In this context, it has been shown that especially the amount of precipitation and irrigation play an important role. To address this environmental effect for Cascade and Mosaic® hops grown in Oregon and Washington, further studies on the present dataset will be conducted to investigate which environmental parameters (such as soil characteristics, chemical composition, microbiome, weather and climatic conditions, and agronomic parameters such as irrigation, fertilization, or harvest date) impact the resulting hop characteristics to provide a better understanding of factors that influence the regional identity of hops.
Supporting information
Fermentation performance during the brewing trials as monitored by daily measurements of the apparent extract; Frequency of the aroma attributes selected during CATA sensory evaluation of the hop and beer samples by a trained sensory panel.
Nomenclature
Adhumulone, (6S)-2-(2,3-dimethylbutanoyl)-3,5,6-trihydroxy-4,6-bis(3-methylbut-2 enyl)cyclohexa-2,4-dien-1-one; adlupulone, 3,5-dihydroxy-2-(2-methylbutanoyl)-4,6,6-tris(3-methylbut-2-enyl)cyclohexa-2,4-dien-1-one; (E)-β caryophyllene, (1 R,9S)-4,11,11-trimethyl-8-methylidenebicyclo[7.2.0]undec-4-ene; caryo-phyllene oxide, (1 R,4R,10S)-4,12,12-trimethyl-9-methylidene-5-oxatricyclo[8.2.0.04,6]dode-cane; cohumulone, 3,5,6-trihydroxy-4,6-bis(3-methylbut-2-enyl)-2-(2-methylpropanoyl)cyclohe-xa-2,4-dien-1-one; colupulone, 3,5-dihydroxy-4,6,6-tris(3-methylbut-2-enyl)-2-(2-methylpropa-noyl)cyclohexa-2,4-dien-1-one; p-cymene, 1-methyl-4-(propan-2-yl)benzene; farnesene, 3,7,11-trimethyldodeca-2,4,6,10-tetraene; geranial, (2E)-3,7-dimethylocta-2,6-dienal; geraniol, (2E)-3,7-dimethylocta-2,6-dien-1-ol; geranyl acetate, (2E)-3,7-dimethylocta-2,6-dien-1-yl acetate; geranyl butyrate, (2E)-3,7-dimethylocta-2,6-dien-1-yl butanoate; α-humulene, (1E,4E,8E)-2,6,6,9-tetramethylcycloundeca-1,4,8-triene; humulene epoxide I, (4E,7E)-1,5,9,9-tetramethyl-12-oxabicyclo[9.1.0]dodeca-4,7-diene; humulene epoxide II, (1 R,3E,7E,11R)-1,5,5,8-tetramethyl-12-oxabicyclo[9.1.0]dodeca-3,7-diene; limonene, 1-methyl-4-(prop-1-en-2-yl)cyclohex-1-ene; linalool, 3,7-dimethylocta-1,6-dien-3-ol; methyl geranate, methyl (2E)-3,7-dimethylocta-2,6-dienoate; myrcene, 7-methyl-3-methylideneocta-1,6-diene; neral, (2Z)-3,7-dimethylocta-2,6-dienal; nerol, (2Z)-3,7-dimethylocta-2,6-dien-1-ol; α-pinene, 2,6,6-trimethylbicyclo[3.1.1]hept-2-ene; β-pinene, 6,6-dimethyl-2-methylidenebicyclo[3.1.1]heptane; terpinen-4-ol, 4-methyl-1-(propan-2-yl)cyclohex-3-en-1-ol; α-terpineol, 2-(4-methylcyclohex-3-en-1-yl)propan-2-ol
| Abbreviations | ||
| DAD | = | diode array detector |
| GC | = | gas chromatography |
| FID | = | flame ionization detector |
| HPLC | = | high performance liquid chromatography |
Supplemental Material
Download MS Word (41.6 KB)Acknowledgements
The authors thank 4-B Farms, B&D Farms, BC Hop Company, Black Star Ranch, B. T. Loftus, C & C Hop Farm, Carpenter Ranches, Coleman Agriculture, F & B Farms, Gasseling Ranches, Greenleaf Hop Farm, John I. Haas, Mark McKay Farms, Oasis Farms, Olsen Brothers Ranches, Perrault Farms, Sauve & Son Farms, Shinn & Son, Sodbuster, Tributary Hop Farms, Van Horn Farms, and Wenas Hop Company for providing hop material. We thank Richard W. Molitor, Lindsey Rubottom, and Karli Van Simaeys, Oregon State University, OR for their skillful assistance. We are also grateful to Jeff Clawson, Oregon State University, for producing beers in the OSU pilot research brewery. Finally, we thank Leandra Weydt for creating .
Disclosure statement
The authors declare no competing financial interest.
Additional information
Funding
Literature cited
- Hahn, C. D.; Lafontaine, S. R.; Pereira, C. B.; Shellhammer, T. H. Evaluation of Nonvolatile Chemistry Affecting Sensory Bitterness Intensity of Highly Hopped Beers. J. Agric. Food Chem. 2018, 66, 3505–3513. DOI: 10.1021/acs.jafc.7b05784.
- Rettberg, N.; Biendl, M.; Garbe, L.-A. Hop Aroma and Hoppy Beer Flavor: chemical Backgrounds and Analytical Tools: A Review. J. Am. Soc. Brew. Chem. 2018, 76, 1–20. DOI: 10.1080/03610470.2017.1402574.
- Lafontaine, S. R.; Pereira, C. B.; Vollmer, D. M.; Shellhammer, T. H. The Effectiveness of Hop Volatile Markers for Forecasting Dry-Hop Aroma Intensity and Quality of Cascade and Centennial Hops. Brewing Sci. 2018, 71, 116–140.
- Lafontaine, S. R.; Shellhammer, T. H. Investigating the Factors Impacting Aroma, Flavor, and Stability in Dry-Hopped Beers. Tech. Quart. Master Brew. Ass. Am. 2019, 56, 13–23.
- Dobis, E. A.; Reid, N.; Schmidt, C.; Goetz, A. J. The Role of Craft Breweries in Expanding (Local) Hop Production. J. Wine Econ. 2019, 14, 374–382. DOI: 10.1017/jwe.2019.17.
- Shahbandeh, M. Global Share Hop Production 2020, by Major Producer 3/22/2021, 2021.
- Georgensgmuend, H. M. Barth Haas Report Hops 2019/2020. Joh. Barth & Sohn GmbH & Co KG.: Nuremberg, Germany, 2020.
- Barry, S.; Muggah, E. M.; McSweeney, M. B.; Walker, S. A Preliminary Investigation into Differences in Hops’ Aroma Attributes. Int. J. Food Sci. Technol. 2018, 53, 804–811. DOI: 10.1111/ijfs.13656.
- Forster, A.; Gahr, A. A Comparison of the Analytical and Brewing Characteristics of Cascade and Comet Hop Varieties as Grown in Yakima (USA) and Hallertau (Germany). Brew. Sci. 2014, 67, 137–148.
- Rodolfi, M.; Chiancone, B.; Liberatore, C. M.; Fabbri, A.; Cirlini, M.; Ganino, T. Changes in Chemical Profile of Cascade Hop Cones according to the Growing Area. J. Sci. Food Agric. 2019, 99, 6011–6019. DOI: 10.1002/jsfa.9876.
- Kishimoto, T.; Kobayashi, M.; Yako, N.; Ida, A.; Wanikawa, A. Comparison of 4-Mercapto-4-Methylpentan-2-One Contents in Hop Cultivars from Different Growing Regions. J. Agric. Food Chem. 2008, 56, 1051–1057. DOI: 10.1021/jf072173e.
- Morcol, T. B.; Negrin, A.; Matthews, P. D.; Kennelly, E. J. ( Humulus lupulus L.) Terroir Has Large Effect on a Glycosylated Green Leaf Volatile but Not on Other Aroma Glycosides. Food Chem. 2020, 321, 126644–126651. DOI: 10.1016/j.foodchem.2020.126644.
- Pepi, S.; Chicca, M.; Telloli, C.; Roma, A. D.; Grisenti, P.; Tessari, U.; Vaccaro, C. Discrimination of Geographical Origin of Hop (Humulus lupulus L.) Using Geochemical Elements Combined with Statistical Analysis. Environ. Geochem. Health 2019, 41, 1559–1576. DOI: 10.1007/s10653-018-0232-7.
- Van Holle, A.; Landschoot, A. V.; Roldán-Ruiz, I.; Naudts, D.; Keukeleire, D. D. The Brewing Value of Amarillo Hops (Humulus lupulus L.) Grown in Northwestern USA: A Preliminary Study of Terroir Significance. J. Inst. Brew. 2017, 123, 312–318. DOI: 10.1002/jib.433.
- Verhoeven, E.; Coleman, L.; Weaver, G.; Townsend, S.; Gallagher, A.; Shellhammer, T. H. First Steps toward Understanding the Regional Identity of Hops Grown in the Willamette Valley, Oregon. Tech. Quart. Master Brew. Ass. Am. 2019, 56, 141–148.
- Van Simaeys, K. R.; Fechir, M.; Gallagher, A.; Stokholm, A.; Weaver, G.; Shellhammer, T. H. Examining Chemical and Sensory Differences of New American Aroma Hops Grown in the Willamette Valley, Oregon. J. Am. Soc. Brew. Chem. 2021, 1–9. DOI: 10.1080/03610470.2021.1968271.
- Tomasino, E.; Harrison, R.; Sedcole, R.; Frost, A. Regional Differentiation of New Zealand Pinot Noir Wine by Wine Professionals Using Canonical Variate Analysis. Am. J. Enol. Vitic. 2013, 64, 357–363. DOI: 10.5344/ajev.2013.12126.
- Vaudour, E. The Quality of Grapes and Wine in Relation to Geography: Notions of Terroir at Various Scales. J. Wine Rec. 2002, 13, 117–141. DOI: 10.1080/0957126022000017981.
- Teuber, R. Geographical Indications of Origin as a Tool of Product Differentiation: The Case of Coffee. Center for International Development and Environmental Research, Justus-Liebig-University: Giessen, Germany, 2007.
- Mudge, E. M.; Brown, P. N.; Murch, S. J. The Terroir of Cannabis: Terpene Metabolomics as a Tool to Understand Cannabis sativa Selections. Planta Med. 2019, 85, 781–796.
- Schüßler, L. Protecting ‘Single-Origin Coffee’ within the Global Coffee Market: The Role of Geographical Indications and Trademarks. J. Int. Trade Law Policy 2009, 10, 149–185.
- Vaudour, E.; Costantini, E.; Jones, G. V.; Mocali, S. An Overview of the Recent Approaches to Terroir Functional Modelling, Footprinting and Zoning. Soil 2015, 1, 287–312. DOI: 10.5194/soil-1-287-2015.
- Van Leeuwen, C.; Friant, P.; Choné, X.; Tregoat, O.; Koundouras, S.; Dubourdieu, D. Influence of Climate, Soil, and Cultivar on Terroir. Am. J. Enol. Vitic. 2004, 55, 207–217.
- Atallah, S. S.; Bazzani, C.; Ha, K. A.; Nayga, R. M. Does the Origin of Inputs and Processing Matter? Evidence from Consumers’ Valuation for Craft Beer. Food Qual. Prefer 2021, 89, 104146–104155. DOI: 10.1016/j.foodqual.2020.104146.
- Staples, A. J.; Malone, T.; Sirrine, J. R. Hopping on the Localness Craze: What Brewers Want from State-Grown Hops. Manage. Decis. Econ. 2021, 42, 463–473. DOI: 10.1002/mde.3246.
- George, A. 2020 Statistical Report. Hop Growers of America: Yakima, WA, 2021
- Henning, J. A.; Coggins, J.; Peterson, M. Simple SNP-Based Minimal Marker Genotyping for Humulus lupulus L. Identification and Variety Validation. BMC Res. Note. 2015, 8, 1–12.
- ASBC methods of analysis. Hops Method 4. Moisture. Approved 1958, rev. 1976, 2008– American Society of Brewing Chemists, St. Paul, MN, 2008.
- Rubottom, L. N.; Lafontaine, S. R.; Hauser, D. G.; Pereira, C.; Shellhammer, T. H. Hop Kilning Temperature Sensitivity of Dextrin-Reducing Enzymes in Hops. J. Am. Soc. Brew. Chem. 2022, 80, 75–83. DOI: 10.1080/03610470.2021.1903290.
- ASBC Methods of Analysis. Hops Method 17. Hop Essential Oils by Gas Chromatigraphy-Flame Ionization Detection. 2004. American Society of Brewing Chemists, St. Paul, MN, 2004.
- ASBC Methods of Analysis. Hops Method 14. α-Acids and β-Acids in Hops and Hop Extracts by HPLC. Approved 1970, rev. 1976, 1989, 2008. American Society of Brewing Chemists, St. Paul, MN, 2008.
- ASBC Methods of Analysis. Hops Method 12. Hop Storage Index (HIS). Approved 1979, rev. 1981. American Society of Brewing Chemists, St. Paul, MN, 2008.
- ASBC Methods of Analysis. Hops Method 12. Total Essential Oils in Hops and Hop Pellets by Steam Distillation. Approved 1988, rev. 2008. American Society of Brewing Chemists, St. Paul, MN, 2008.
- Dehlholm, C.; Brockhoff, P. B.; Meinert, L.; Aaslyng, M. D.; Bredie, W. L. Rapid Descriptive Sensory Methods–Comparison of Free Multiple Sorting, Partial Napping, Napping, Flash Profiling and Conventional Profiling. Food Qual. Prefer. 2012, 26, 267–277. DOI: 10.1016/j.foodqual.2012.02.012.
- Varela, P.; Ares, G. Sensory Profiling, the Blurred Line between Sensory and Consumer Science. A Review of Novel Methods for Product Characterization. Food Res. Int. 2012, 48, 893–908. DOI: 10.1016/j.foodres.2012.06.037.
- Ares, G.; Antúnez, L.; Giménez, A.; Roigard, C. M.; Pineau, B.; Hunter, D. C.; Jaeger, S. R. Further Investigations into the Reproducibility of Check-All-That-Apply (CATA) Questions for Sensory Product Characterization Elicited by Consumers. Food Qual. Prefer 2014, 36, 111–121. DOI: 10.1016/j.foodqual.2014.03.010.
- Wickham, H. Elegant Graphics for Data Analysis. Springer: New York, 2016.
- Sharp, D. C.; Townsend, M. S.; Qian, Y. Effect of Harvest Maturity on the Chemical Composition of Cascade and Willamette Hops. J. Am. Soc. Brew. Chem. 2014, 72, 231–238.
- Lam, K. C.; Foster, R. T.; II.,.; Deinzer, M. L. Aging of Hops and Their Contribution to Beer Flavor. J. Agric. Food Chem. 1986, 34, 763–770. DOI: 10.1021/jf00070a043.
- Probasco, G.; Perrault, J.; Varnum, S.; Hysert, D. Mosaic (HBC 369): A New Flavor Hop Variety. J. Am. Soc. Brew. Chem. 2017, 75, 6–10.
- Trochine, A.; González, S. B.; Burini, J. A.; Cavallini, L.; Gastaldi, B.; Reiner, G.; Sofrás, F. M. S.; Baren, CWv.; Lira, P. D. L.; Retta, D.; et al. Chemical Characterization of the Two Major Hop Varieties Produced in Patagonia (Argentina) for the Brewing Industry. Brewing Sci. 2020, 73, 95–102.
- Vollmer, D. M.; Shellhammer, T. H. Influence of Hop Oil Content and Composition on Hop Aroma Intensity in Dry-Hopped Beer. J. Am. Soc. Brew. Chem. 2016, 74, 242–249.
- Nance, M. R.; Setzer, W. N. Volatile Components of Aroma Hops (Humulus lupulus L.) Commonly Used in Beer Brewing. J. Brew. Distill. 2011, 2, 16–22.
- Cibaka, M.-L. K.; Ferreira, C. S.; Decourrière, L.; Lorenzo-Alonso, C.-J.; Bodart, E.; Collin, S. Dry Hopping with the Dual-Purpose Varieties Amarillo, Citra, Hallertau Blanc, Mosaic, and Sorachi Ace: Minor Contribution of Hop Terpenol Glucosides to Beer Flavors. J. Am. Soc. Brew. Chem. 2017, 75, 122–129.
- Steensels, J.; Meersman, E.; Snoek, T.; Saels, V.; Verstrepen, K. J. Large-Scale Selection and Breeding to Generate Industrial Yeasts with Superior Aroma Production. Appl. Environ. Microbiol. 2014, 80, 6965–6975.
- Pires, E. J.; Teixeira, J. A.; Brányik, T.; Vicente, A. A. Yeast: The Soul of Beer’s Aroma: A Review of Flavour-Active Esters and Higher Alcohols Produced by the Brewing Yeast. Appl. Microbiol. Biotechnol. 2014, 98, 1937–1949. DOI: 10.1007/s00253-013-5470-0.
- Schieberle, P. Primary Odorants of Pale Lager Beer. Z. Lebensm Unters Forch. 1991, 193, 558–565. DOI: 10.1007/BF01190873.
- Trueba, P. B.; Jaskula-Goiris, B.; Ditrych, M.; Filipowska, W.; Brabanter, J. D.; Rouck, G. D.; Aerts, G.; Cooman, L. D.; Clippeleer, J. D. Monitoring the Evolution of Free and Cysteinylated Aldehydes from Malt to Fresh and Forced Aged Beer. Food Res. Int. 2021, 140, 110048–110058.
- Ditrych, M.; Filipowska, W.; Rouck, G. D.; Jaskula-goiris, B.; Aerts, G.; Andersen, M. L.; Cooman, L. D. Investigating the Evolution of Free Staling Aldehydes throughout the Wort Production Process. Brewing Sci. 2019, 72, 10–17.
- De Keukeleire, J.; Janssens, I.; Heyerick, A.; Ghekiere, G.; Cambie, J.; Roldán-Ruiz, I.; Van Bockstaele, E.; De Keukeleire, D. Relevance of Organic Farming and Effect of Climatological Conditions on the Formation of α-Acids, β-Acids, Desmethylxanthohumol, and Xanthohumol in Hop (Humulus lupulus L.). J. Agric. Food Chem. 2007, 55, 61–66.
- De Keukeleire, J.; Ooms, G.; Heyerick, A.; Roldan-Ruiz, I.; Van Bockstaele, E.; De Keukeleire, D. Formation and Accumulation of α-Acids, β-Acids, Desmethylxanthohumol, and Xanthohumol during Flowering of Hops (Humulus lupulus L.). J. Agric. Food Chem. 2003, 51, 4436–4441.
- Donner, P.; Pokorný, J.; Jezek, J.; Krofta, K.; Patzak, J.; Pulkrábek, J. Influence of Weather Conditions, Irrigation and Plant Age on Yield and Alpha-Acids Content of Czech Hop. Plant Soil Environ. 2020, 66, 41–46. DOI: 10.17221/627/2019-PSE.