
Abstract
Understanding the role barley variety plays in the overall flavor profile of beer is an area of research of interest to barley breeders, maltsters, and brewers. Here we build on previous research on the effect of barley variety on beer flavor by focusing on commercial-type malts and beers. A selection of three winter-habit, elite malting lines – two released varieties and one experimental – were grown in three locations across Oregon and California and harvested in summer 2020. Each was malted to the specifications of Pilsner-style malt. Beers were produced to mimic offerings of the industry partner and utilized a small portion of specialty malt and higher hopping rates than previous work. All beers underwent descriptive sensory analysis and Projective Mapping (Napping®) to characterize and determine the magnitude of separation between samples. Malting and brewing performance differed among the nine entries, but sensory outcomes showed only minor separation and few significant differences in the descriptive analysis. The results here showed that there is correlation between malt modification and sensory outcomes and ultimately confirmed that barley variety and growing location contributes to beer flavor. However, the overall contributions are nuanced, particularly in commercial-ty3pe malts and beers.
Introduction
Research on barley (Hordeum vulgare) genotype contribution to beer flavor is still a novel area of focus within the field of malting barley breeding. Beginning in 2017, a series of nine publications began to explore this relationship. However, prior research has primarily focused on this effect in non-commercial, research-scale malts and beers and only recently has work been performed to evaluate the impact of barley variety on commercial-type malts and beers akin to those produced by craft brewers. This work aims to contribute to the understanding of the influence of barley variety on beer flavor by incorporating elite malting barley lines in craft beers similar to those in the brewing partner’s portfolio.
Previous studies on barley genotype contribution to beer flavor have mostly been performed independently, but they have directly built upon each other in the development of a detailed assessment pipeline. Early work found that barley genotype and growing environment affect beer flavor and that this is not only a result of the degree of malt modification. These studies utilized micro-scale (500 g) research malts and nano-brewed (<1 L) research beers for sensory evaluation.[Citation1,Citation2] Subsequent work integrated chemical profiling and showed that metabolomics can be used to differentiate between malt house, malt type, and barley genotype and that coupling this with beer sensory can be an effective tool in identifying barley lines of interest.[Citation3,Citation4] With the addition of malt hot steep sensory, Windes et al. (2021) investigated two sets of genetically distinct germplasm using mini-scale (90 kg) research malts and research lager beers (2.5 hL) designed to minimize fermentation and hop sensory contributions.[Citation5] This work found that there were subtle differences in malt hot steep and beer sensory outcomes between and within the two sets of germplasm. Similar work by Craine et al. (2021) evaluated micro-malts (2.5 kg) and small-scale single malt, single hop ales (11.3 L) in a consumer sensory panel.[Citation6] Their results were more pronounced than in the previous studies as the control variety (Copeland) was distinguished from the experimental lines in both hot steep and beer sensory. This workflow was applied to experimental barley lines derived from crosses with the heirloom variety Maris Otter® and found significant differences in malt sensory and chemical composition, though actual beer sensory differences were limited.[Citation7] This study utilized mini-scale malts and a research ale recipe (2.5 hL) designed to emphasize base malt flavor. There is limited understanding of the genetic basis of barley variety contribution to beer flavor. Recent work traced flavor outcomes attributable to barley to specific quantitative trait loci also linked with dormancy and plant height, using the full Oregon Promise population[Citation8] from which Herb et al.[Citation2] selected a subset. Finally, recent work by Morrissy et al. (2022) was the first that evaluated commercial-type malts produced in a novel mini-scale floor malting system and brewed in a recipe in alignment with the industry partner’s commercial lagers.[Citation9] They found significant differences between the beers using descriptive analysis but an overall preference between the two was not significant.
While research on barley contribution to beer flavor is an emerging area of work, the effect of genotype,[Citation10] growing environment,[Citation11,Citation12] and the respective interaction[Citation13] on malt quality has been well studied. The companion work to this manuscript by Halstead et al. (2022) evaluated these effects as well as the impact of nitrogen management on grain and malt quality of the three lines used here and two additional experimental entries in the same three growing environments.[Citation14] That work found that environment, genotype, and the interaction were significant in driving malt quality primarily via their respective effects on grain protein. This work expands upon the results by evaluating genotype and environment on beer flavor.
This study evaluated a set of three barley lines: two commercial varieties (Thunder and Lightning) and one accession from elite malting trials (DH140963). Lines were grown at research facilities in Corvallis, OR, Pendleton, OR, and Tulelake, CA and were malted to produce a commercial-type Pilsner malt and used to produce a commercial-type Golden Ale style beer. This work aimed to build on the previous work investigating barley genotype contribution to beer flavor. Further it asked whether growing environment or the interaction with genotype also contribute to beer flavor and if this effect is emphasized in commercial-style malts and beers due to synergistic interactions with specialty malt, hops, and yeast.
Experimental
Barley
Three barley lines were selected for this experiment: the released varieties Thunder and Lightning and the experimental line DH140963 selected from the Oregon State University (OSU) – Barley Project breeding program. Their respective pedigrees and growth habits are shown in . Thunder is a released variety that has an American Malting Barley Association (AMBA) recommendation for malting[Citation15] and is one of the most widely planted winter-habit malting barley varieties in Oregon and Idaho. Lightning is a released variety without an AMBA recommendation but has seen some commercial adoption in the craft industry and is of interest to growers due to its disease resistance and facultative growth habit. DH140963 is an experimental line selected from the breeding program’s elite malting trials and was previously in the AMBA assessment pipeline but is no longer being considered for a variety release. To avoid confusion between varieties and experimental lines, all will hereby be referred to as lines.
Table 1. Barley lines used in this study with their pedigrees and growth habits.
Barley was grown at three locations (identifiers in parentheses): the OSU Hyslop Crop Science Research Laboratory, Corvallis, OR (COR); the OSU Columbia Basin Agricultural Research Center, Pendleton, OR (PEN); and the University of California Intermountain Research and Extension Center, Tulelake, CA (TUL). These locations represent a high rainfall, dryland, and irrigated growing environment, respectively. Lines were planted in fall of 2019 and harvested in summer of 2020. Grain was planted in single replicate strips in order to generate sufficient seed for the requisite batch sizes for malting and brewing. All fields were managed under standard protocol for malting barley at the respective research station.[Citation14]
Malting
Malting for brewing was performed in the OSU mini-malter using approximately 90 kg batches as described in Windes et al.[Citation5] but steeping parameters were adjusted to temper modification to produce a Pilsner-style malt[Citation16,Citation17] and the protocol was based on prior data from micro-malting trials with the same entries.[Citation14] Additional adjustments were made to accommodate for water sensitivity issues in some of the entries. The full malting protocols are provided in Supplemental 2 and . Malting scale is defined by Morrissy et al.[Citation9] and the malts used in this work were produced on the mini-scale.
Table 2. Germination energy, water sensitivity, and germinative capacity for each entry.
Barley and malt quality analysis
Barley grain analysis was performed using ASBC Methods of Analysis (Barley-2, Physical Tests; Barley-3, Germination). Protein and moisture were measured using a FOSS Infratec-NOVA near-infrared grain analyzer (Hillerød, Denmark).
In-process assessments were taken to monitor malting progress. Steep-out moisture was measured with an A&D MX-50 moisture balance analyzer (Wood Dale, Illinois, U.S.A) at the end of each steep cycle and during the first two days of germination. To monitor modification at the end of germination, growth count index was performed. The acrospires of 100 kernels were measured as a percentage of the kernel length. Acrospires <25% the length of kernels were weighted at a coefficient of 0.25; 25–50% at 0.50; 50–75% at 0.75; 75–100% at 1.0; and acrospires longer than the kernel at 1.25. The counts were multiplied by their weight coefficient and summed up for a cumulative growth count; maximum value = 125.
Malts were analyzed for a number of quality parameters at Hartwick College Center for Craft Food & Beverage (Oneonta, New York, U.S.A) using ASBC Methods of Analysis (Malt-4, Extract; Malt-6, Diastatic Power; Malt-7, ɑ-Amylase; Malt-8, Protein; Malt-12, Friability; Beer-31, Free Amino Nitrogen). These parameters were used to calculate malt index scores based on the Agricultural Research Service Cereal Crop Research Unit guidelines for all-malt specifications (maximum value = 70).[Citation18] This system assigns a numerical score to the results of each assay based on an established range that reflects the needs of all-malt brewers; the higher the score, the more appropriate the malt is for AMBA defined all-malt brewing.
Brewing and beer analysis
Ales were prepared at Deschutes Brewery (Bend, Oregon, USA) using an Esau and Hueber four-vessel, 2.5 hL brewery. Each of the entries was brewed separately in June and July, 2021. The brewing recipe and protocol was designed with the intention of producing a commercial type Golden Ale that would still emphasize malt characteristics. Each brew used 34.5 kg of base malt made with each respective line. Other key ingredients were 1.8 kg of Munich Malt 10°L (Great Western Malting, Vancouver, WA, USA), English Ale Yeast (A-68 London Ale II, BSI, Woodland Park, CO, USA), and Nugget and Crystal T-90 hop pellets (Barth-Haas, Yakima, WA, USA and Crosby Hop Farm, Woodburn, OR, USA respectively), targeting 20 bitterness units in the final beer. Beer was packaged in 20 L kegs at 2.5 v/v of carbonation, dissolved oxygen was below 30 ug/L for all beers. The full brewing protocol is provided in Supplemental 3. Brewing quality analysis was performed at Deschutes Brewery using ASBC Methods of Analysis (Beer-2, Specific Gravity; Beer-4, Alcohol; Beer-9, pH; Beer-10, Color; Beer-23a, Beer Bitterness; Beer-25b, Diacetyl).
Sensory
A sensory panel consisting of 29 individuals from OSU (16 male-identifying and 13 female-identifying, age 22–61) was chosen. The panelists were selected based on previous sensory experience performing descriptive evaluation of hops, malt, and beer. All panelists gave their informed consent for inclusion prior to participation, and approval for this work was granted by Institutional Review Board at OSU (Study Number IRB-2019-0247).
Panelist training included Ultra-Flash Profiling and Projective Mapping (or Napping®) to assess the aroma, taste, and mouthfeel of beer samples.[Citation19,Citation20] A room with a neutral stimulus was selected for sensory evaluation. Using Ultra-Flash Profiling, 18 aroma attributes, three taste attributes, and four mouthfeel-related attributes were defined to characterize the malt-forward beers produced in this study and to best represent the anticipated differences among the beers. Panelists underwent a single training session on the selected attributes with food or aroma references to familiarize themselves with the respective sensory perceptions (). Two commercial beers were included in the training to serve as a reference and represent the extremes of the expected aroma, taste and mouthfeel-related properties anticipated in the research beers. Reference beers were served alongside the beer samples during each sensory session as a warmup for the panelists and to compare the unknown samples.
Table 3. Malt quality data for the Pilsner type malts.
During the sensory sessions, 50 mL of each beer sample were presented simultaneously in 250 mL beer sensory glasses covered with plastic lids and labelled with three-digit random codes using general randomization. For Projective Mapping, panelists were asked to carry out spatial placement of the beer samples based on their overall sensory differences by using a paper poster board (22” × 22”) with overall similar samples being located in close proximity and different samples being located far apart before transcribing their physical locations using a digital ballot (Compusense Cloud 21.0.7713.26683, Compusense, Ontario, Canada). In the check-all-that-apply (CATA) assessment,[Citation21] panelists were asked to evaluate samples by selecting a number of attributes from the agreed-upon aroma, taste and mouthfeel lexicon (). The panelists were asked to select at least two aroma attributes, one taste attribute and one of the three mouthfeel characteristics (watery, medium, or full, astringent as an optional addition) for each sample. The overall aroma attribute frequencies were sorted from most frequently to least frequently used while comparing the overall frequency of each attribute to that of the most frequently used one and calculating the respective percentage. Aroma attributes that were used at frequencies greater than 25% in comparison were included in the subsequent statistical analysis.
Statistics
Data collection, statistical analysis, and graphical demonstration of data were performed using Microsoft Excel (version 16.16.27) and the R environment for statistical computing.[Citation22] Analysis of variance (ANOVA) and least significant difference (LSD) mean comparison were used to evaluate germination and water sensitivity data. Principal component analysis (PCA) was used to evaluated malting data. Pearson’s correlation test was used to compare select malting, brewing, and sensory parameters. Sensory data were analyzed using XLSTAT Premium 2020.5.1 (Addinsoft, NY, USA). Multiple factor analysis (MFA) was used to evaluate the X and Y coordinate data obtained by Projective Mapping, whereas Correspondence Analysis (CA) was used to assess the frequencies of the aroma, taste, and mouthfeel attributes assigned by the panelists via CATA. Cochran’s Q-test was applied to identify significant differences between the samples for each specific attribute.
Results
Agronomics
All entries met agronomic expectations except for Thunder-COR which showed low plump percentage (retention on 6/64” screen) and the lowest overall test weight (TW) (). Grown under standard field management for each location all entries maintained the low grain protein content required for all-malt brewing (≤12.0%). Due to the planting constraints (large, single replicate plots), statistical analysis was not applied to the agronomic results except germination energy. There were some general trends based on growing location and line which are shown in . On average, grain protein was lowest at Tulelake (9.7%) compared to Pendleton (11.1%) and Corvallis (11.4%). Tulelake also had the highest TW and plump. However, these numbers were not much higher than Pendleton, and Corvallis’ average was disproportionately reduced by exceptionally low numbers from Thunder-COR relative to all other entries. In terms of line means, Lightning had the highest grain protein and TW, while DH140963 had the lowest grain protein and highest plump grain percentage.
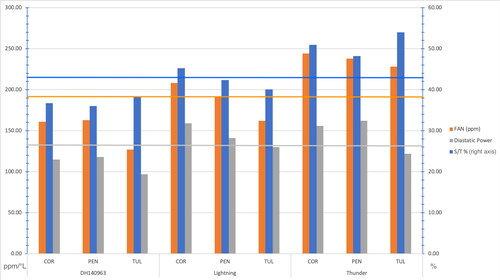
Figure 1. Malting data showing proteolytic modification for each line at each location with grand means shown with the respective horizontal lines. S/T ratio measured on right axis.
Five of nine entries showed acceptable germination energy with the other four just below the AMBA recommended value (≥98%) (). An ANOVA showed a significant difference between lines (p = 0.0285), with Lightning accounting for three of the four entries below 98%. Water sensitivity was problematic in Corvallis and Pendleton and there was a significant interaction effect (p = 0.0024) between line and location with only the entries from Tulelake showing acceptable results in the 8 mL test. The significant line by location interaction was confirmed using a larger selection of samples in the companion work to this study that additionally included two other experimental malting lines and two nitrogen treatments.[Citation14,Citation23] While extended storage between harvest and malting did improve the mild dormancy seen with Lightning, it did not improve water sensitivity for any line (data not shown).
Malting
Malting protocols were customized for each entry in order to achieve a balanced modification and to meet malt quality expectations for a Pilsner-type malt commonly used in the craft brewing industry. Steep out moisture and growth count index were measured in order to monitor the malting progress (). Steep out moisture for Thunder was targeted lower than that of the other lines based on historic malting information (data not shown), and while generally meeting the target, growth count index and subsequent malt quality analysis showed that modification was still high. DH140963 exhibited the opposite with a steep out moisture that was targeted higher in comparison in order to promote hydration and modification. Two of the DH140963 entries (COR and TUL) required supplemental moisture during germination, however growth count and overall modification were still lower than expected. All Lightning entries required supplemental moisture. Lightning-PEN suffered a mechanical error during steeping due to a power outage and the protocol was adjusted in real time to meet target moisture (see ) and due to grain availability a second replicate was not possible. Interestingly, this entry still maintained even-modification as shown in both and .
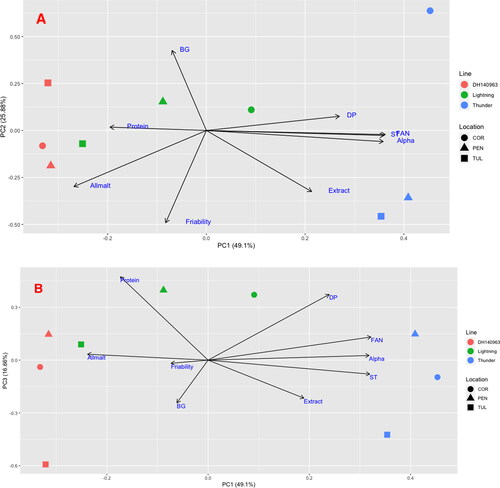
Figure 2. Principal component analysis of malt quality results. The first three principal components explained 91.64% of the variance. shows PC1 and 2 and shows PC1 and 3.
Overall, malts produced by mini-malting exhibited a wide range of quality outcomes () and were more similar to the set produced by Windes et al.[Citation5] than compared to the more uniform malts produced by Morrissy et al.[Citation7] All lines met or exceeded the AMBA guideline for extract (>81.0%). Thunder was most over-modified in comparison with the soluble to total protein ratio (S/T) and free amino nitrogen (FAN) exceeding AMBA guidelines and was above the grand mean across all lines and locations as is shown in and . Thunder-COR and Thunder-PEN also exceeded the AMBA guideline and the grand mean for diastatic power (DP). Even the entry with the lowest grain protein (Thunder-TUL) exceeded the proteolytic modification specifications for all-malt brewing. The Thunder-COR entry was also cytolytically under-modified with low friability (79.1%) and high β-glucan (289 mg/L). While below AMBA guidelines for some parameters, DH140963 (all locations) and Lightning-TUL produced malt most similar to commercial Pilsner-style malt. DH140963-COR and DH140963-PEN had the two highest all-malt scores respectively. However, S/T was the only malt quality parameter to significantly correlate (Pearson’s r = −0.698) with all-malt score ().
Table 4. Pearson’s correlation coefficients for key malting and brewing quality parameters.
Principal component analysis of malt quality outcomes is shown in , with PC1 and PC2 accounting for 74.98% of the variance between key malt quality parameters and PC3 accounting for an additional 16.66%. For this portion of the analysis, color, moisture, and soluble protein were removed from the data set. Between PC1 and PC2 () there were two primary groupings: the first was DH140963-COR, DH140963-PEN, and Lightning-TUL, which plotted with protein and all-malt score; the second was Thunder-PEN and Thunder-TUL, which plotted with Extract, AA, DP, and FAN. Lightning-PEN and Lightning-COR plotted closest to the center, indicating that they were about average in all parameters. There was minor separation by line with all line-entries grouping in a pattern with the exception of Thunder-COR, which was a clear outlier. As expected, the Thunder entries primarily plotted with proteolytic modification outcomes while the DH140963 entries plotted on the opposite side of the graph. There were no location-based groupings. Lightning-PEN plotted closest to the center, indicating its even modification. shows similar trends but with more distinct line-based groupings.
Brewing
Brewhouse performance metrics, like malt quality metrics, were variable, with noticeable differences in recovered extract, attenuation (real degree of fermentation - RDF), and brewhouse yield (). Brewhouse yield (BHY) – as measured by the relative recovered extract out of the brewhouse – ranged from 64.6% (DH140963-TUL) to 74.2% (DH140963-COR). Bitterness (IBU) for each line was below target and the deviation between the values may have contributed to sensory outcomes. Diacetyl (VDK) levels for all beers were below the lowest sensory threshold reported in the literature (17 ug/L).[Citation24]
Table 5. Brewing quality data for the Golden-ale type beer produced with each entry.
Correlation coefficients between malting and brewing quality outcomes are shown in . There was no significant correlation between malt extract and any parameters associated with BHY or wort extract, with the highest extract line (Thunder-PEN) only seeing the fourth highest BHY. There was a significant negative correlation between β-glucan and original extract (OE) indicating that the disparate β-glucan results may have affected lautering efficacy, but there was no correlation between β-glucan and BHY. Deviations in RDF may have been a result of differences in hydrolytic enzymes as DH140963-TUL had the lowest attenuation as well as the lowest DP and ɑ-amylase (AA), both being notably lower than all other lines. However, the correlations between RDF and either of the enzyme measurements were not significant. Color varied between 2.67 SRM and 4.10 SRM, which was not surprising as there was a similar range for wort color and there was a significant positive correlation between wort color and beer color. This indicates the color contribution of Munich malt was likely consistent in all beers. Interestingly, there was a significant positive correlation between extract and malt and beer color as well as between AA and malt and beer color. This may have been a line effect as Thunder had both high extract and high proteolytic modification, which has previously been reported in other studies.[Citation5,Citation14]
Sensory
In the CATA analysis, the panel selected 10 of 18 aroma attributes at a response rate that was greater than 25%, but only one attribute – bread (p = 0.0009) – was significantly different among the samples (). This indicates a complex aroma profile of the craft style Golden ale, but very limited difference between samples. Overall beers scored the highest in grainy, vegetal, and bread. Thunder-PEN and Thunder-TUL formed one significant grouping with a high bread aroma selection rate while DH140963-COR formed its own group with a low bread selection rate. No taste or mouthfeel attributes showed significant differences between the beers that were mostly described as sweet and thin-bodied (watery). This is interesting as there was a broad spread in final extract (RE). Bitterness was the second most selected taste attribute ranging from five (Thunder-PEN) to 13 responses (DH140963-PEN), but the difference among entries was not significant indicating the varying IBU levels of the beers did not significantly affect sensory outcome. Correlation coefficients between malting and CATA sensory results are reported in . Analysis shows significant positive correlations between the bread attribute and extract (Pearson’s r = 0.69), S/T (Pearson’s r = 0.82), FAN (Pearson’s r = 0.74), and ɑ-amylase (Pearson’s r = 0.75) indicating an overall positive relationship between bread aroma and modification.
Table 6. CATA frequency for aroma, taste, and mouthfeel.
Table 7. Pearson’s correlation coefficients for malting parameters and CATA sensory descriptors that were reported above the 25% threshold.
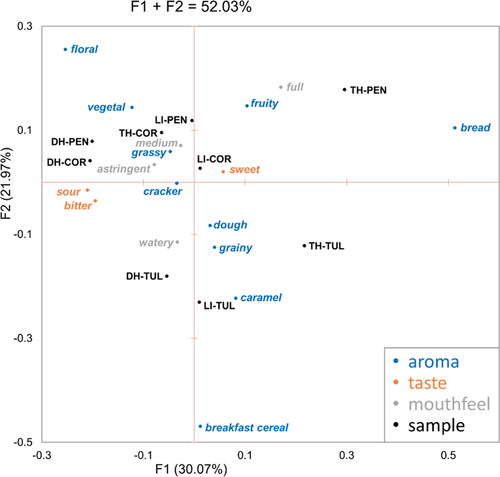
While Thunder-PEN and Thunder-TUL scored high for bread, they plotted differently in the CA of CATA response data (), with Thunder-PEN grouping closer to fruity and full mouthfeel while Thunder-TUL grouped near dough, grainy, and caramel. DH140963-PEN, DH140963-COR, and Thunder-COR plotted closest to the attributes vegetal, sour, and astringent. Most other lines grouped very close together and Lightning-COR plotted as the most neutral of all beers. However, given the scale of the CA, trends here indicate only minor separation.
Figure 3. Correspondence Analysis (CA) applied to the beer sensory results obtained by CATA with a trained sensory panel evaluating aroma, taste, and mouthfeel overall accounting for 52.03% of the total variation in the data set. Barley line is abbreviated with first two letters of each: TH = Thunder; LI = Lightning; DH = DH140963.
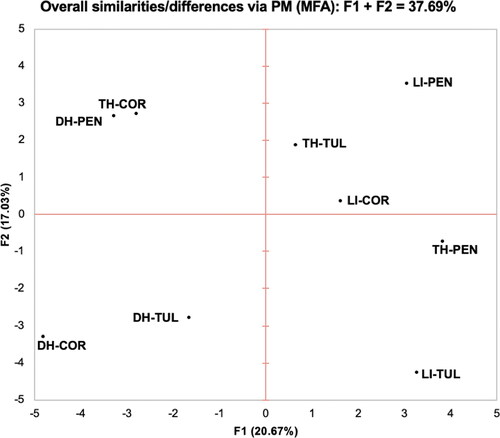
A multiple factor analysis (MFA) applied to the results of the projective mapping, as shown in , revealed that there were differences between the beers that were not captured by the CATA sensory evaluation. These differences allowed for a further distinction between the beers with a large amount of variation between the beers and a few distinct groupings. Thunder-COR and DH140963-PEN had the tightest grouping and mapped distinctly away from all other entries. DH140963-COR and DH140963-TUL were the next tightest grouping. All other entries mapped on the other vertical half of the plot. Lightning-TUL was the only entry to not group with any others.
Figure 4. Multiple Factor Analysis (MFA) applied to the beer sensory results obtained by Projective Mapping (PM) with a trained sensory panel evaluating overall sensory differences between beer samples accounting for 37.69% of the total variation in the data set. Barley line is abbreviated with first two letters of each: TH = Thunder; LI = Lightning; DH = DH140963.
Discussion
Development of malting barley lines specifically for use in craft malting and brewing is a novel area of research with increased industry interest.[Citation25] Much of the work for the craft sector has focused on agronomics and breeding[Citation26–28] and not on flavor outcomes, per se. Existing work on the contribution of barley genotype to beer flavor has been primarily limited to the evaluation of research type malts (i.e., laboratory-malted on small scale) and beers (i.e., nano-brewed) with malting protocols designed to optimize modification in order to meet malt specifications as outlined by AMBA. However, research type malts are not always akin to the commercial malts utilized by brewers. The all-malt quality guidelines outlined by AMBA do not completely line up with the desires of the craft industry.[Citation25,Citation29] The enzyme potential, as measured as DP and ɑ-amylase is often in excess of what craft all-malt brewers require; and further, many craft brewers look for malts with lower proteolytic modification even at the expense of higher β-glucan.
Malting protocols were designed to target Pilsner malt specifications and the protocols were developed based on historic malting data and current season micro-malting evaluations. Steep out moisture was used as the primary driver to control modification with targets specific to each entry. However, despite low grain protein for all entries and malting procedures designed to produce Pilsner-style malt, the entries showed a spread of outcomes ranging from under- to over-modified. Additionally, water sensitivity in many of the entries posed a challenge and this required additional adjustments to the malting protocol. Steeping regimes were adjusted to limit each water immersion based on malt house experience; this is similar to the adjustments made by Craine et al.[Citation6] The high water sensitivity is likely a result of late season precipitation in Corvallis and Pendleton.[Citation14,Citation30] Overall, Lightning was the lowest-performing line in dormancy and water sensitivity assessments, though this is not unexpected based on previous results.[Citation31] However, the adjustments made to the malting protocol were successful in managing water sensitivity as there is not a strong relationship between it and all-malt score (R2 = 0.0833). This does not refute the findings of Halstead et al.,[Citation14] but rather indicates the power of bespoke protocols on coaxing quality malt from out-of-specification grain.
No entry met all AMBA guidelines for all-malt brewing but two of the entries – Lightning-PEN and Lightning-TUL – were only out of specification for one parameter (FAN and β-glucan, respectively). Thunder was most prone to over modification with all three entries having the highest FAN and S/T ratio of the set, which is unsurprising based on its industry use for malt for adjunct brewing.[Citation32] Thunder-COR was the most exceptional malt as it was both proteolytically over-modified and cytolytically under-modified. Barley line was a greater driver of malt quality than location, which is not unexpected given these lines were bred for multi-environment adaptation.
Malts performed differently in the brewhouse with some correlation between the malt quality and beer quality parameters. However, brewhouse water adjustments were made to meet specification extract; the only exception being DH140963-TUL, which had the lowest RDF and given the lack of a significant correlation between hydrolytic enzymes and RDF, may have suffered from fermentation issues. If DH140963-TUL is removed from the data set, the final RE was within 0.73°P for all entries and the RDF was within 4.56% as compared to 1.26°P and 9.12% respectively when DH140963-TUL is included. The other main difference out of the brewhouse was final beer color which, as mentioned, correlated strongly with incoming malt color.
Despite the disparate malt and beer quality data, the beers were all described positively with grainy, bread, caramel, and fruity making up four of five of the most frequently selected aroma descriptors with only vegetal being seen as negative.[Citation33] The attributes selected by the panel indicate the beers were high in malt-associated aromas but given the similarity among entries this may be driven by the small inclusion of Munich malt.[Citation34] It is possible that even at only 5% of the total grist composition, the specialty malt contribution was powerful enough to mute distinctive, but subtle, sensory differences provided by the base malt. Bread was the only attribute that differed significantly among samples with two of the Thunder entries (PEN and TUL) scoring the highest, which is likely related to their high proteolytic modification as shown by correlation coefficients () and thus possible high levels of Maillard reaction products or similar compounds.[Citation3] While there are other significant relationships between malt quality and CATA attributes, as bread was the only significant descriptor, further conclusions to the correlation between malting and differing sensory attributes cannot be made.
While there was only one significant difference in the CATA sensory analysis, the sensory panel was able to separate the beers into distinct groupings in the projective mapping assessment. The discrepancy in projective mapping and CATA is most likely due to sensory properties other than aroma, taste, and mouthfeel attributes included in the selected CATA lexicon. This may have led to unconscious separation by panelists in the projective mapping analysis based on variables that contribute to the overall sensory profile of a beer but that are not reflected in a CATA analysis, such as color[Citation35] or ABV.[Citation36,Citation37] Thunder-COR and DH140963-PEN formed the tightest grouping in projective mapping and may be related to their beer color as they were the darkest and third darkest beers, respectively. Interestingly these lines were on the opposite ends of the spectrum for all-malt scores as Thunder-COR was the lowest and DH140963-PEN was the second highest, indicating that the malt scoring system may not be a predictor of beer flavor. There were no location-based groupings but a slight grouping by line as both Lightning and DH140963 mapped on opposite halves of the MFA. All but one quadrant of the MFA included at least two lines and all quadrants included at least two locations, with the upper right quadrant including two lines and all three locations (Thunder-TUL, Lightning-COR, Lightning-PEN). Other than the lower left quadrant, the groupings in each did not show obvious correlation to malt or beer analysis and this may indicate that sensory separation may be influenced by the interaction between line and location in ways that are not measured here. Overall, the results display limited differences among beers brewed with the different lines and further separation of these samples, given the nuance between them, would likely only be detectable by a more highly trained panel.[Citation38]
Conclusion
Investigation into the role barley genotype plays in beer flavor has been explored in a series of studies, and this work sought to further understand this relationship in commercial-type malts and beers. Three elite malting lines were evaluated at three locations and taken through malting, brewing, and sensory trials. Malts and beers were prepared to mimic commercial offerings similar to those used in the craft brewing industry. There were varied malting outcomes across the nine entries, with no entry meeting all of the AMBA guidelines for all-malt brewing. Brewhouse performance also varied as the wide spread of β-glucan results influenced lautering performance and original extract. However, despite the varying malting and brewing results, the sensory results did not show significant separation in descriptive analysis. The beer aroma profile was complex but only differed in one aroma attribute (bread) and not between any taste or mouthfeel attributes. Projective mapping found that there were small differences between the beers that may be attributed to a line by location interaction, but that they are indicative of subtle attributes not measured. Further work using metabolomics and/or additional sensory tools may elucidate greater separation between these entries but would likely not indicate broader sensory outcomes compared to what was found here. While in this work neither barley genotype nor growing location contributed significantly to beer flavor, it is indicative of the ability to adjust malting and brewing parameters to work with grain and malts of varying quality as the commercial-type beer recipe and process was successful in producing similar products. Even in a lighter style craft beer, base malt, specialty malt, hops, and yeast act in concert to produce an acceptable product. From a beer flavor perspective, this shows the potential for barley lines that may be agronomically successful, well adapted to a local environment, and/or provide attributes of interest (e.g., growth habit, heirloom genetics, etc.) but do not perform well in standardized malting trials.
Supplemental Material
Download PNG Image (65.4 KB)
Supplemental Material
Download MS Word (94.6 KB)Acknowledgements
We wish to acknowledge the financial support from a Brewers Association Research Grant. We thank and Darrin Culp and Rob Wilson at the UC-Davis Intermountain Research and Extension Center and Ryan Graebner at the OSU Columbia Basin Agricultural Research Center for managing field experiments in Tulelake, CA and Pendleton, OR respectively.
Disclosure statement
The authors declare no competing financial interest
Literature cited
- Herb, D.; Filichkin, T.; Fisk, S.; Helgerson, L.; Hayes, P.; Benson, A.; Vega, V.; Carey, D.; Thiel, R.; Cistue, L.; et al. Malt Modification and Its Effects on the Contributions of Barley Genotype to Beer Flavor. J. Am. Soc. Brew. Chem. 2017, 75, 354–362. DOI: 10.1094/ASBCJ-2017-4976-01.
- Herb, D.; Filichkin, T.; Fisk, S.; Helgerson, L.; Hayes, P.; Meints, B.; et al. Effects of Barley (Hordeum vulgare L.) Variety and Growing Environment on Beer Flavor. J. Am. Soc. Brew. Chem. 2017, 75, 345–353.
- Bettenhausen, H. M.; Benson, A.; Fisk, S.; Herb, D.; Hernandez, J.; Lim, J.; Queisser, S. H.; Shellhammer, T. H.; Vega, V.; Yao, L.; et al. Variation in Sensory Attributes and Volatile Compounds in Beers Brewed from Genetically Distinct Malts: An Integrated Sensory and Non-Targeted Metabolomics Approach. J. Am. Soc. Brew. Chem. 2020, 78, 136–152. DOI: 10.1080/03610470.2019.1706037.
- Bettenhausen, H. M.; Barr, L.; Broeckling, C. D.; Chaparro, J. M.; Holbrook, C.; Sedin, D.; Heuberger, A. L. Influence of Malt Source on Beer Chemistry, Flavor, and Flavor Stability. Food Res. Int. 2018, 113, 487–504. DOI: 10.1016/j.foodres.2018.07.024.
- Windes, S.; Bettenhausen, H. M.; Simaeys, K. R. V.; Clawson, J.; Fisk, S.; Heuberger, A. L.; Lim, J.; Queisser, S. H.; Shellhammer, T. H.; Hayes, P. M.; et al. Comprehensive Analysis of Different Contemporary Barley Genotypes Enhances and Expands the Scope of Barley Contributions to Beer Flavor. J. Am. Soc. Brew. Chem. 2021, 79, 281–305. DOI: 10.1080/03610470.2020.1843964.
- Craine, E. B.; Bramwell, S.; Ross, C. F.; Fisk, S.; Murphy, K. M. Strategic Malting Barley Improvement for Craft Brewers through Consumer Sensory Evaluation of Malt and Beer. J. Food Sci. 2021, 86, 3628–3644. DOI: 10.1111/1750-3841.15786.
- Morrissy, C. P.; Féchir, M.; Bettenhausen, H. M.; Van Simaeys, K. R.; Fisk, S.; Hernandez, J.; Mathias, K.; Benson, A.; Shellhammer, T. H.; Hayes, P. M.; et al. Continued Exploration of Barley Genotype Contribution to Base Malt and Beer Flavor through the Evaluation of Lines Sharing Maris Otter Parentage. J. Am. Soc. Brew. Chem. 2022, 80, 201–214. DOI: 10.1080/03610470.2021.1952509.
- Sayre-Chavez, B.; Bettenhausen, H.; Windes, S.; Aron, P.; Cistué, L.; Fisk, S.; Helgerson, L.; Heuberger, A. L.; Tynan, S.; Hayes, P.; et al. Genetic Basis of Barley Contributions to Beer Flavor. J. Cereal Sci. 2022, 104, 103430. DOI: 10.1016/j.jcs.2022.103430.
- Morrissy, C. P.; Davenport, C.; Hooper, A.; Fisk, S. P.; Bettenhausen, H. M.; Hayes, P. M. The Effect of Floor-Malting on Novel Barley Germplasm Derived from a Cross with Maris Otter®. Tech. Q. Master Brew. Assoc. Am. 2022; (in press).
- Mohammadi, M.; Blake, T. K.; Budde, A. D.; Chao, S.; Hayes, P. M.; Horsley, R. D.; Obert, D. E.; Ullrich, S. E.; Smith, K. P. A Genome-Wide Association Study of Malting Quality across Eight U.S. barley Breeding Programs. Theor. Appl. Genet. 2015, 128, 705–721. DOI: 10.1007/s00122-015-2465-5.
- Arends, A. M.; Fox, G. P.; Henry, R. J.; Marschke, R. J.; Symons, M. H. Genetic and Environmental Variation in the Diastatic Power of Australian Barley. J. Cereal Sci. 1995, 21, 63–70. DOI: 10.1016/S0733-5210(95)80009-3.
- Gous, P. W.; Gilbert, R. G.; Fox, G. P. Drought-Proofing Barley (Hordeum vulgare) and Its Impact on Grain Quality: A Review. J. Inst. Brew. 2015, 121, 19–27. DOI: 10.1002/jib.187.
- Luo, H.; Harasymow, S.; Paynter, B.; MacLeod, A.; Izydorczyk, M. S.; O'Donovan, J. T.; Li, C. Genetic and Environmental Impact on Protein Profiles in Barley and Malt. J. Inst. Brew. 2019, 125, 28–38. DOI: 10.1002/jib.532.
- Halstead, M.; Morrissy, C. P.; Fisk, S. P.; Fox, G. P.; Hayes, P. M.; Carrijo, D. Barley Grain Protein is Influenced by Genotype, Environment, and N Management and is the Major Driver of Malting Quality. Crop Sci. 2022; (in press).
- AMBA. Recommended Malting Barley Varieties [Internet]. [cited 2021 July 8]. https://ambainc.org/amba-publications/recommended-malting-barley-varieties/.
- Mallet, J. Malt: A Practical Guide from Field to Brewhouse. Boulder: Brewers Publications; 2014.
- Briggs, D. E. Malts and Malting. 1st ed. London: Blackie Academic; 1998.
- CCRU. Malt Quality Methods [Internet]. 2022. https://www.ars.usda.gov/ARSUserFiles/50900500/barleyreports/CY METHODS 01-22.pdf.
- Varela, P.; Ares, G. Sensory Profiling, the Blurred Line between Sensory and Consumer Science. A Review of Novel Methods for Product Characterization. Food Res. Int. 2012, 48, 893–908. DOI: http://dx.doi.org/10.1016/j.foodres.2012.06.037.
- Dehlholm, C.; Brockhoff, P. B.; Meinert, L.; Aaslyng, M. D.; Bredie, W. L. P. Rapid Descriptive Sensory Methods - Comparison of Free Multiple Sorting, Partial Napping, Napping, Flash Profiling and Conventional Profiling. Food Qual. Prefer. 2012, 26, 267–277. DOI: http://dx.doi.org/10.1016/j.foodqual.2012.02.012.
- Ares, G.; Antúnez, L.; Giménez, A.; Roigard, C. M.; Pineau, B.; Hunter, D. C.; Jaeger, S. R. Further Investigations into the Reproducibility of Check-All-That-Apply (CATA) Questions for Sensory Product Characterization Elicited by Consumers. Food Qual. Prefer. 2014, 36, 111–121. DOI: 10.1016/j.foodqual.2014.03.010.
- R Core Team. R: A Language and Environment for Statistical Computing. Vienna, Austria: R Foundation for Statistical Computing; 2020. https://www.r-project.org/.
- Shellhammer, T.; Morrissy, C.; Staples, A.; Lafontaine, S. The Influence of Terroir/Regionality on Brewing Raw Materials and Beer Flavor and the Economics of This Concept as It Relates to Beer. In ASBC/MBAA Brewing Summit. Providence, RI; 2022.
- Saison, D.; De Schutter, D. P.; Uyttenhove, B.; Delvaux, F.; Delvaux, F. R. Contribution of Staling Compounds to the Aged Flavour of Lager Beer by Studying Their Flavour Thresholds. Food Chem. 2009, 114, 1206–1215. DOI: http://dx.doi.org/10.1016/j.foodchem.2008.10.078.
- Brewers Association. Malting Barley Characteristics for Craft Brewers Executive Summary [Internet]. 2014. https://www.brewersassociation.org/attachments/0001/4752/Malting_Barley_Characteristics_For_Craft_Brewers.pdf.
- Mills, A. A. S.; Izydorczyk, M.; Choo, T. (.; Durand, J.; Mountain, N.; Sorrells, M.; Fillmore, S. A. E. Cultural Practices to Improve Malt Barley Quality in the Northeast with Focus on the Craft Sector. Can. J. Plant Sci. 2021, 101, 39–52. DOI: 10.1139/cjps-2020-0011.
- Shrestha, R. K.; Lindsey, L. E. Agronomic Management of Malting Barley and Research Needs to Meet Demand by the Craft Brew Industry. Agron. J. 2019, 111, 1570–1580. DOI: 10.2134/agronj2018.12.0787.
- Brouwer, B. O.; Schwarz, P. B.; Barr, J. M.; Hayes, P. M.; Murphy, K. M.; Jones, S. S. Evaluating Barley for the Emerging Craft Malting Industry in Western Washington. Agron. J. 2016, 108, 939–949. DOI: 10.2134/agronj2015.0385.
- Hertrich, J. Challenges of All Malt Brewing with North American Two-Row Malting Barley. In: MBAA Eastern Technical Conference. 2018.
- González, S.; Viega, L.; Beretta, A.; Córdoba, M.; Rossi, C. Effect of Temperature and Precipitation during Grain Filling on Dormancy and Water Sensitivity in Barley Grains (Hordeum vulgare L.). AgriScientia 2019, 36, 19–27.
- Hayes, P.; Carrijo, D. R.; Filichkin, T.; Fisk, S.; Helgerson, L.; Hernandez, J.; Meints, B.; Sorrells, M. E. Registration of ‘Lightning’ Barley. J. Plant Regist. 2021, 15, 407–414. DOI: 10.1002/plr2.20129.
- Hayes, P. M.; Filichkin, T.; Fisk, S.; Helgerson, L.; Meints, B.; Mundt, C. Release of Thunder Two-Row Winter Barley. Corvallis, OR, Oregon Agricultural Experiment Station. 2019.
- Bamforth, C. W. Dimethyl Sulfide - Significance, Origins, and Control. J. Am. Soc. Brew. Chem. 2014, 72, 165–168. DOI: 10.1094/ASBCJ-2014-0610-01.
- Liscomb, C.; Bies, D.; Hansen, R. Specialty Malt Contributions to Wort and Beer. Tech. Q. Master Brew. Assoc. Am. 2015, 52, 181–190.
- Carvalho, F. R.; Moors, P.; Wagemans, J.; Spence, C. The Influence of Color on the Consumer’s Experience of Beer. Front. Psychol. 2017, 8, 2205. DOI: 10.3389/fpsyg.2017.02205.
- Peltz, M.; Shellhammer, T. Ethanol Content Has Little Effect on the Sensory Orthonasal Detection Threshold of Hop Compounds in Beer. J. Am. Soc. Brew. Chem. 2017, 75, 221–227. DOI: 10.1094/ASBCJ-2017-3994-01.
- Clark, R.; Linforth, R.; Bealin-Kelly, F.; Hort, J. Effects of Ethanol, Carbonation and Hop Acids on Volatile Delivery in a Model Beer System. J. Inst. Brew. 2011, 117, 74–81. DOI: 10.1002/j.2050-0416.2011.tb00446.x.
- Elgaard, L.; Jensen, S.; Mielby, L. A.; Byrne, D. V. Performance of Beer Sensory Panels: A Comparison of Experience Level, Product Knowledge, and Responsiveness to Feedback Calibration. J. Sens. Stud. 2019, 34, e12540. DOI: 10.1111/joss.12540.
- Schoales, T.; Heinrich, M. Breakdown of a Malt COA: A Bucket Analysis Approach. In: Craft Brewers Conference. Brewers Association; 2020.