
 ?Mathematical formulae have been encoded as MathML and are displayed in this HTML version using MathJax in order to improve their display. Uncheck the box to turn MathJax off. This feature requires Javascript. Click on a formula to zoom.
Abstract
The objective of this experimental study is to analyze non-viable and viable particle loads in a pharmaceutical cleanroom under ‘in operation’ conditions using different air change rates (ACRs). Regulatory guidelines give limit values for particles/m3 and colony forming units (CFUs)/m3. A widely used ACR is 20 h−1 as this value is recommended by the Food and Drug Administration (FDA) in its guidance for industry on sterile drug products. However, this value may be too high, resulting in increased costs for energy. A typical pharmaceutical cleanroom was used for this study, and operations were simulated with a process unit and two operators in the room. The experiments were conducted twice with four different ACRs and four different types of operator garments, resulting in 32 trials in total. Particle load and CFUs were measured by calibrated particle counters and microbial air samplers. The results give evidence that an ACR of 20 h−1 is not required. ACR 10 h−1 is sufficient without compromising the demanded air quality. Furthermore, it was found that regulatory agencies should reevaluate the expected limits as these currently give a high buffer between the required and actual values, which potentially cover up problems in aseptic manufacturing.
Introduction
The cleanroom conditions for sterile drug manufacturing by means of aseptic processing in a classic or biopharmaceutical facility are regulated by national and international regulatory guidelines [Citation1–3]. Specific requirements are given for the quality of air in pharmaceutical cleanrooms. The guidelines recommend limit values for a maximum number of airborne particles with sizes ≥0.5 µm as well as colony-forming units (CFUs) per m3 air within cleanrooms. Two major differences between both guidelines regarding limit values are important: first: in addition, the Annex 1 also gives limit values for particles ≥5 µm. Second: while the FDA aseptic guide defines limits only for the ‘in operation’ status of processing rooms [Citation3], the European Annex 1 also describes an ‘at rest’ status [Citation2]. In the draft of the announced revision of this guideline, an expected duration from the ‘in operation’ to the ‘at rest’ status is given [Citation4]: ‘The particulate limits … for the ‘at rest’ state should be achieved after a ‘clean up’ period on completion of operations. The ‘clean up’ period should be determined during the classification of the rooms (guidance value of 15–20 min)’ [Citation4,p.10]. Annex 1 defines cleanroom classes A–D [Citation2]. Cleanroom classifications are also given in Deutsches Institut fuer Normung (German Institute for Norming) (DIN) European Norm (EN) International Organization for Standardization (ISO) 14644-1 with ranges from ISO 5 to ISO 8 (relevant for pharmaceutical cleanrooms), where ISO 8 equal Class C limits ‘in operation’, and ISO 7 equal Class C limits ‘at rest’ [Citation5].
In Annex 1 Class C, the allowed limits for particulate and microbial contamination are recommended as shown in [Citation2].
Table 1. Annex 1 Class C limits.
These regulatory expectations can only be achieved by a continuous supply of filtered, clean air, and an extraction of contaminated air. Hence, the quality of air in the cleanroom is in a direct relation to the air change rate (ACR). ACR describes how often in a given time (typically per hour) the room volume of air is exchanged [Citation6].
(1)
(1)
In EquationEquation (1)(1)
(1) , N denotes the number of air changes per hour,
the air velocity (m/h), A the filter surface (m2), V the total room volume (m3), and
the air flow rate (m3/h).
FDA’s aseptic guide states [Citation3]: ‘Air change rate is another important cleanroom design parameter. For Class 100,000 (ISO 8) supporting rooms, airflow sufficient to achieve at least 20 air changes per hour is typically acceptable’ wherein the term ‘typically acceptable’ can be misinterpreted as ‘required’ [Citation3,p.11]. In Annex 1, a specific value for a suitable ACR is not given. The WHO recommends an ACR of 6–20/h−1 for non-sterile manufacturing facilities, but does not give a guidance value for sterile operations [Citation7].
For the operation of cleanrooms, large amounts of energy are consumed compared to non-cleanrooms [Citation8–10]. Heating, ventilation and air conditioning (HVAC) systems for pharmaceutical cleanrooms can have up to 25 times higher energy demands than standard rooms [Citation8]. The focus of regulatory requirements in ‘Good Manufacturing Practice’ (GMP)-regulated environment, however, is always on patient, and product, as well as operator safety, and not on energy efficient production. The obligation to meet the guidance values leads to strict decisions in many pharmaceutical companies: Cleanrooms are operated 24 h with a constant ACR, independent from actual use [Citation11]. Furthermore, the defined ACR is often designed higher than actually needed, which again leads to an increased energy demand of up to 50–75% of the total facility energy consumption [Citation12]. The reason for his is an over-interpretation of regulatory guidelines, which are generic and do not reflect specific cleanroom process conditions [Citation8]. The operating companies do not always know which ACR is required for a specific room, and, thus, decide to design the air handling unit (AHU) on the ‘safe side’, with higher ACRs for the cleanrooms than technically required [Citation12]. Opportunities for energy saving by a correct and not overdesigned setting of ACR per individual cleanroom are thereby missed.
In the pharmaceutical industry, the areas for preparation of sterile drug products within an ISO 8/Class C environment are typically much larger than the critical areas for final product filling in ISO 5-7/Class A-B. These filling areas are typically kept to a minimum due to the higher contamination risk for the final product in (open) filling processes. Restricted access barrier systems (RABSs) or isolators with ACRs significantly higher than 20 h−1 are used in these critical areas. By this, the volume of the ventilated room becomes much smaller and the energy demand for air conditioning acceptable. RABS and isolators however are not applicable in many preparation steps for the product which are performed in Class C/ISO 8 conditions such as large process vessels, washing machines, and autoclaves. Still, wherever the use of RABS and isolators is possible also in lower cleanroom classes their use should be considered in terms of quality management and energy saving purposes. If this is not possible other ways of energy saving can be followed.
Demand-controlled filtration (DCF) is such an opportunity to save energy. The AHU then operates with a reduced capacity during the ‘at rest’ status of the cleanroom. Various studies have shown that DCF has a significant potential for energy saving [Citation13–15]. However, uncertainties with HVAC control systems lead to an avoidance of DCF for single rooms, due to the risk of cross-contamination in case of a reversed pressure cascade to corridors or neighbor rooms during an up and down phasing of the AHU. Thus, DCF is used in facilities only for an overnight shutdown of the complete production area.
In view of the public interest to decrease greenhouse gas emissions, as well as to improve energy efficiency, a re-thinking has started, which is also expressed in guidance documents [Citation16,Citation17]. Until April 2018, the International Society for Pharmaceutical Engineering (ISPE) also recommended an ACR of 20 h−1 in its widely used second edition of the guide for sterile manufacturing facilities [Citation18]. This second edition is still often referenced in research papers. In the current third edition, ISPE withdraws this specific value [Citation17]. The suggestion is now to design the cleanroom HVAC systems based on the expected particle and microbe-carrying particle (MCP) load of rooms, in combination with other parameters as, for example, recovery time. For this, ISPE explicitly refers to Sun et al. who describe a model for cleanroom engineering [Citation19]. This opens the opportunity to come out with reduced ACR requirements below the FDA’s recommendation of 20 h−1.
For the additional requirement on ‘clean up periods’, recent studies demonstrated, that even with an ACR of 10 h−1 the requirement of 15–20 min for the ‘clean up period’ from ‘in operation’ to ‘at rest’ can be achieved [Citation20,Citation21].
If this obligation can be achieved with ACR 10, the scientific follow-up question for this experimental study is: Which ACR provides the minimum required to meet the regulatory expectations for the ‘in operation’ status in a pharmaceutical ISO 8/Class C cleanroom? Consequently, the objective of the test series was to determine the required minimum ACR to meet regulatory guideline limit values with respect to 0.5 and 5 µm particles, as well as CFUs/m3, and on settle plates (SPs).
Methods
Study setup
In an experimental study, 16 different experiments were performed by simulation of ‘in operation’ conditions in a cleanroom with equipment and personnel, emitting particles and CFUs. This was simulated with four different garments:
Personnel in garment for ISO 8: single use Tyvek®-cleanroom-overall, overshoes, hairnet, face mask, gloves;
Personnel in garment for ISO 9: single use fabric cleanroom-overall, overshoes, hairnet, face mask, gloves;
Personnel in covering street clothes, face mask, gloves;
Personnel in T-Shirt and shorts, face mask, gloves;
Please review the supplementary material for a photo of the different garments (Figure S1).
Though there are differences in the make of cleanroom clothing in various countries, the objective and regulatory expectation remains the same: the gown should provide a barrier between the operator skin and the cleanroom environment to prevent particles and MCPs emitted by the operator from product contamination.
Garment A was chosen as a possible gown for Class 100,000/ISO 8/Class C ‘in operation’ cleanrooms. In contrast to that, Garment B is not recommended for aseptic processing as it consists of a porous fabric which does not provide a full barrier. This type of gown is for example used in non-sterile operations such as production of oral solid dosage forms. Garments C and D are not cleanroom adequate. They were included in this study to explicitly carve out the need of proper cleanroom clothing.
Face masks are usually not required in environments ≥ ISO 9. However, for health reasons, due to the SARS-CoV-2 pandemic, it was decided to continuously wear face masks during the test series. Gloves were worn throughout all experiments, even though they are usually not used in garment situation B–D. This was done to minimize the risk of unintended (bio-)contamination of the used microbial air sampling probes. To simulate a potential microbial contamination by typically increased skin surface from hands in garment B as compared to A, the sleeves of the fabric overall were pulled up a bit.
Each of the four different garments was tested with four different ACR settings:
20 h−1
15 h−1
12 h−1
10 h−1
With variation of garment and ACR, this study focused on parameters that might lead to a violation of regulatory limits. No further investigation of contaminating species was performed in this experimental study as the mere number of MCPs, regardless of its kind is relevant for a deviation from guidance limits. However, in real aseptic production, any deviation should be followed by an extensive analysis, including the identification of the contaminating species, as part of the root cause analysis to define effective corrective and preventive actions.
Test design
The tests were started with garment A from ACR setting 1–4, followed by garment B 1–4, etc., to continuously increase the particle and CFU contamination in the previously cleaned and disinfected room. Each test was conducted twice, resulting in total 32 test runs. The test numbering is shown in Table S1 of the Supplementary material.
All experiments for garments A–C and ACR 10, 12, 15, and 20 were performed in the test design as shown in .
Table 2. Test design for garment A–C/All ACR.
It was expected that at the beginning of the tests, the airborne particles that remained in the air from test preparation activities, would be in a steady state or slightly decay by sedimentation, as no HVAC was actively removing particles. With the entering of personnel after five minutes, an increase of particles should be observed (HVAC still off). By starting the HVAC after 10 minutes, a decay of particles was expected at a different speed, according to the applied ACR. A typical operation situation was anticipated five minutes after the HVAC start: operators performed their duties and emitted particles, while the AHU constantly removed these. This phase was held for further 10 minutes to monitor airborne particle levels at different room locations in the real ‘in operation’ status. After this phase, the operators left the room. Consequently, the particle generation by personnel was zero, and the total contamination was expected to decrease.
With garment D, one phase was added, as shown in .
Table 3. Test design for garment D/All ACR.
The addition of a 5-min spiking phase after 25 min, was intended to boost the contamination with particles and MCPs in order to examine the increase and decay under different ACRs ().
Figure 1. Fast movements after 25 min with garment D.
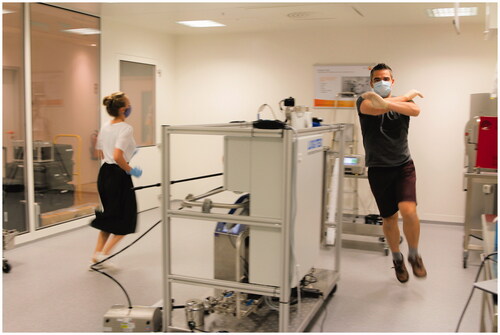
Not to be misunderstood: the involved test personnel was perfectly aware that neither the type of clothing, nor the way of (foolish) movements are adequate for a process operation in a cleanroom environment. This test was conducted to analyze the maximum achievable level of particles and CFUs in a cleanroom with running HVAC by different ACRs.
Cleanroom and equipment
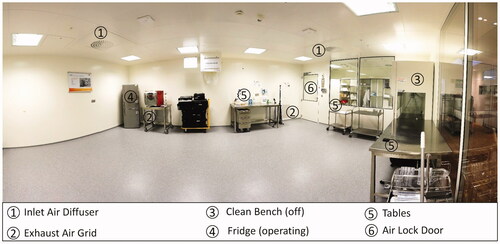
The room used for the trials is a training room at Testo Industrial Services in Kirchzarten, Germany. Its design is a typical cleanroom as it can be found in many pharmaceutical companies. Floors, walls, doors, and ceiling are built with cleanroom components. Two H13 air filters with swirl diffusers are installed in the ceiling and two exhaust air grids are mounted slightly above floor level on the wall. The room has a surface area of A = 38.4 m2 and a volume of V = 99.8 m3. An air lock (A = 11.8 m2) is connected upstream. The HVAC system of the room enables variable ACRs from <10 to 70 h−1, which allowed all tests in an ACR range that is typically used in the pharmaceutical industry.
The floor was cleaned and disinfected with Korsollin FF® the evening before test start. All equipment surfaces were treated with alcoholic wipe disinfection. shows a panoramic view of the room without process equipment.
Figure 2. Panoramic view of test cleanroom prior to start without process equipment.
To simulate typical operation processes, a process unit was placed in the middle of the room. It consisted of a tank filled with water, a circulation pump, pipes, as well as electrical and instrumentation equipment. During the test runs, the pump was continuously running. This caused heat generation and air turbulence from the motor. With the given size of the room, it was decided to conduct the experiments with two operators, which is also a typical occupancy in pharma process rooms of this space.
shows the room with the process equipment and allocated measuring instruments.
Figure 3. Room layout with process unit and allocated measuring instruments.
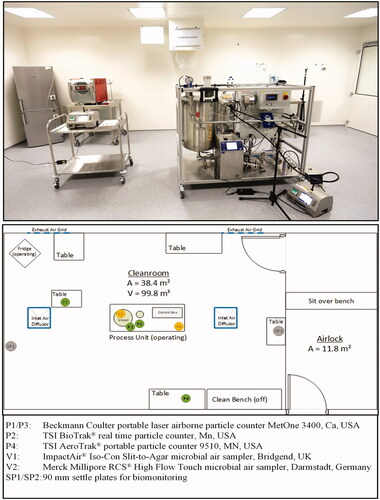
A Testo 420 volume flow hood for air supply rate measurement was used to individually adjust the correct ACR for all tests. All measuring instruments were calibrated prior to the experiments.
The four particle counters: particle counter 1, located high inside process unit (P1); particle counter 2, located low inside process unit (P2); particle counter 3, located on middle room table (P3); particle counter 4, located high inside process unit (P4) are common laser-based systems using the effect of light scattering for particle counting. All four counters were set-up with an air flow rate of 28.3 L/min, and a one-minute test duration, resulting in 4000 data points throughout all 32 experiments. Two counters were located in the process unit close to the vessel at the height of 0.6 m (P2) and 1.0 m (P1). The other two counters were placed on desks, below an inlet air swirl diffuser (P3), and on the cleanroom wall close to the (non-operational) clean bench (P4).
Merck Millipore tryptic soy agar (TSA) plates (90 mm/30 ml) and test stripes (for RCS® air sampler) were used for biomonitoring [Citation22,Citation23]. In addition, 90 mm SPs were laid out at positions settle plate 1, located on floor (SP1) and settle plate 2, located on table near air lock (SP2) to monitor the microbial contamination for four hours, according to EU GMP Annex 1. After sampling, all plates and stripes were incubated for four days at 32 °C. CFUs were counted on day 2, 3, and 4. No further CFUs could be detected between day 3 and 4.
The Merck Millipore RCS® High Flow Touch is a microbial air sampler, based on impaction by centrifugal force on test strips with an air flow rate of approximately 100 L/min [Citation24]. The calibrated airflow of the used system was 97.6 L/min. The advantage of this system is the high sampling volume. The test duration and, thus, the sampling volume, was set-up as follows:
7 min/stripe for tests with garments A–C, four stripes total (28 min/683 L);
7 min/stripe for tests with garment D, first four stripes (28 min/683 L);
5 min/stripe for tests with garment D, last stripe (=5 min/488 L).
The ImpactAir® Iso-Con Slit-to-Agar microbial air sampler works with 90 mm TSA petri dishes, which slowly rotate below very narrow inlet slit [Citation25]. The air flow is 15 L/min. The test duration and, by this, the sampling volume, was set-up with 7 min/plate for tests with the garments A–C, and 8 min/plate for tests with garment D, resulting in a sampling volume of 105 L (A–C) and 120 L (D). Due to the rotation of the petri dish, results are, to a certain extent, time-correlated by the position of the CFU on the plate.
An allowance of 40 s for the change-over of probes was calculated for the three required changes per test. With the addition of these total two minutes, the tests could be completed in 30 min.
To document all test runs, a HD-camera (Canon EOS 5D Mark IV, Tokyo, Japan) with a wide-angle lens filmed all activities during the tests.
Particle results
Test phases
In and , the 0.5 µm particle load during the tests with ACR 20, wearing garment A and garment D, is shown as mean values of both test runs. During the start phase with no air flow and no operators in the room, the particle load decreased by sedimentation. After five minutes, an increase becomes visible, caused by the entering of two operators. At t = 10 min, the HVAC was switched on, which led to a significant decay of particles. A nearly steady state level is reached after five minutes of HVAC operation. During the ‘in operation’ phase between 15 and 25 min, the particle count could be kept below 50,000/m3. In all tests with garments A–C, the operators left the room after 25 min and, by this, initialized the ‘clean up’ period with a further decay of particles.
Figure 4. Phases for tests A–C.
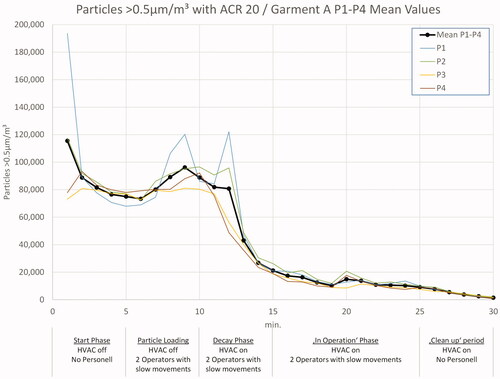
Figure 5. Phases for tests D – note the different scale on the y-axis.
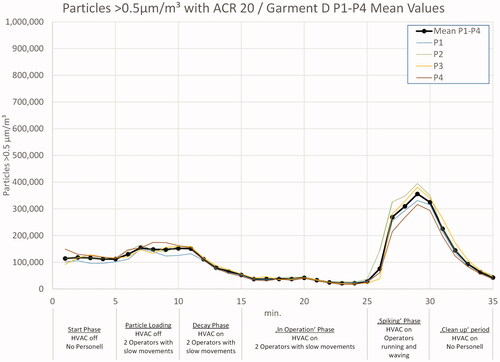
In the experiments with garment D, the test personnel started running, waving, jumping, ruffling hair, tapping clothes, and similar movements after 25 min to intentionally generate a high particle and MCP load, the effects of which are visible in .
Please review the supplementary material (Figures S2–S4) for details on differences between the two test runs and differences on particle counter location.
Results for different ACRs
Results shown in this section focus on the ‘in operation’, ‘spiking’, and ‘clean up’ phase.
0.5 µm particle measurements
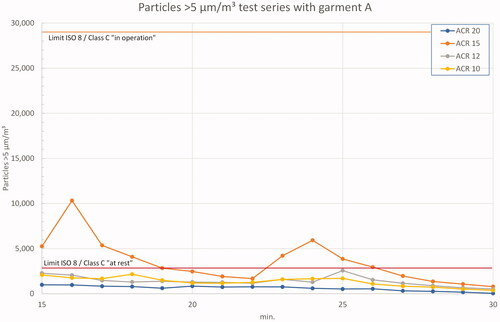
presents the 0.5 µm particle measurement data for a typical pharma operation situation: A vented cleanroom with two operators in cleanroom garment using Tyvek® overalls. The differences in curves are caused by different ACRs. Nearly, all measured 0.5 µm particle counts are at, or below, 50,000/m3. The values vary slightly due to operator activities, but with the beginning of the ‘clean up’ period, the order of ACRs becomes visible: ACR 20 has the lowest value, followed by ACR 15, etc.
Figure 6. Results 0.5 µm particles in test series A – ‘in operation’ and ‘clean up’ period. Note the double split y-axis to enable the marking of regulatory limits and the different scale of the x-axis.
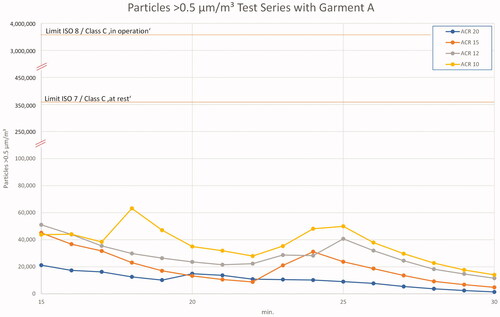
A most interesting result is the comparison with regulatory limits. The measured maximum value even with ACR 10 is approximately seven times lower than the ISO 7/Class C ‘at rest’ or Class B ‘in operation’ limits. Accordingly, the allowed ‘in operation’ level for this simulation of ISO 8/Class C ‘in operation’ is 70 times higher than the maximum values measured in these trials!
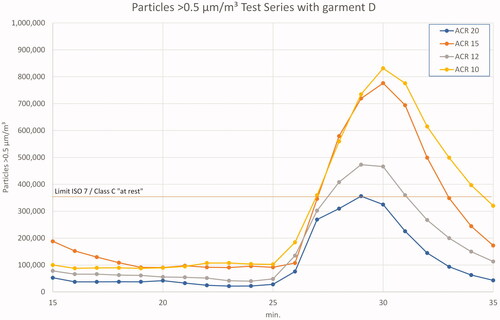
In the last test series D, the potential (bio-)contamination induced by operators was further increased by means of short clothes with T-shirt and short trousers. In addition, a five-minute spiking period with fast movements was added after the previous ‘in-operation’ period. The effects are shown in . While the 0.5 µm particle loads are at a comparable level with that of the test with long clothes, they boost up at the beginning of fast movements. Peak levels reach or exceed the ‘at rest’ limit of regulatory requirements and are, at ACR 20, up to 10.5 times higher than the average value during ‘the in operation’ phase. With ACR 10, the increase factor is 8.6 between the ‘in operation’ mean value and the peak of the spiking phase. Again, ‘in operation’ levels are not exceeded.
Figure 7. Results 0.5 µm particles in test series D – ‘in operation’ and ‘clean up’ period. Note the different scale on both axes.
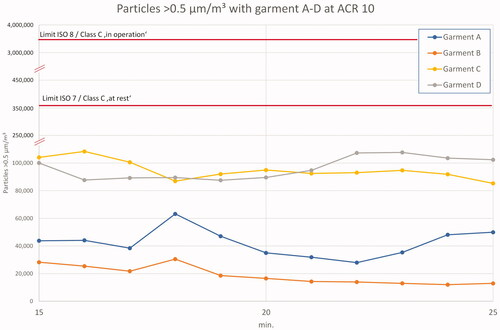
An overview of results for garments A–D during the ‘in operation’ period of 15–25 min is given in . The particle generation with garments C and D is approximately 2–3 times higher than the particle generation with cleanroom garments.
Figure 8. Garments A–D at ACR 10 'in operation'. Note the double split y-axis to enable the marking of regulatory limits and different x-axis.
See the review of the Supplementary material (Figures S5–S9) for detailed results on all garments and ACRs.
5 µm particle measurements
The second parameter of regulatory requirements is the limits given for 5 µm particles ‘in operation’ and ‘at rest’. All particle counters were set up to analyze this particle size as well.
shows the ‘in operation’ and ‘clean up’ period with garment A. During the measurement with ACR 15, two peaks occurred in one trial due to operator activity. For the other ACRs, the measured values were below the ‘at rest’ limits, but with a significantly smaller offset to the ‘in operation’ limits than the 0.5 µm measurements (approximately 15-fold vs. 70-fold).
Figure 9. Results 5 µm particles in test series A – ‘in operation’ and ‘clean up’ period. Note the different scale on y-axis.
presents the only exceedance of ‘in operation’ limit values in all conducted experiments. It could only be achieved in test series D during the spiking phase wearing short clothes. The increase of 5 µm particles is expectedly higher during this phase than with 0.5 µm particles. As the particles generated by personnel are generally larger than 0.5 µm, it was clear that the spiking phase would create more of the larger particles and, thus, more MCPs. Actually, compared to 0.5 µm particles, the increase of 5 µm particles in the spiking phase was on average 25% higher in all experiments. Though this is no surprise, it underlines the validity of the test setup.
Figure 10. Results 5 µm particles in test series D (mean values) – ‘in operation’ and ‘clean up’ period.
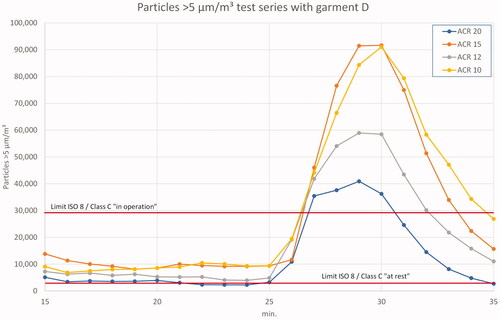
Looking at the ‘in operation’ phase of this test, the measured 5 µm particle values are well below the limit values for all ACRs. With respect to the inadequate garment D, this is an astonishing result.
Viable particle results
The third parameter of Annex 1 and the FDA Aseptic Guide limits is the number of CFU/m3 [Citation2,Citation3]. During the experiments, 90 mm TSA sampling plates as well as TSA test stripes for the RCS® air sampler for ‘in operation’ biomonitoring at two different locations were used.
Air samplers (V1/V2)
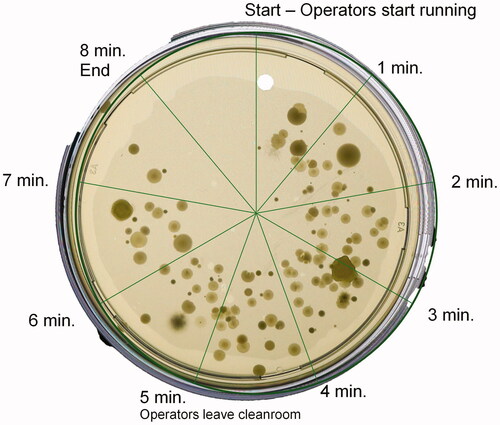
An example for the time correlation of the ‘slit to agar’ air sampler is shown in . This petri dish was the fourth in the test D.3.1, placed in the air sampler prior to the spiking phase, and rotating for eight minutes. A build-up of CFUs during the first five minutes, and a reduction after the operators had left the room, can clearly be observed. Other trials with the garments A–C showed much less microbial contamination.
Figure 11. 90 mm TSA sampling plate during spiking phase of D.3.1 at V1.
In , the photograph of the four TSA plates and RCS® stripes from test A.3.1 after incubation is shown. A.3.1-1 represents the first seven minutes, in which the HVAC was off, and the operators were outside of the room for five minutes.
Figure 12. Microbial air sampling results on 90 mm TSA plates and RCS® stripes for test A.3.1.
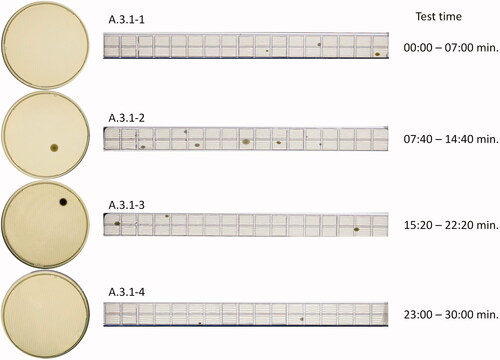
A.3.1-2 includes a 2–3 min particle loading phase (HVAC off), and a decay phase starting after 10 min (HVAC on). A.3.1-3 covers the ‘in-operation’ phase of the experiment. Five out of seven minutes with A.3.1-4 cover the ‘clean up’ period without personnel in the room.
For the ‘in operation’ period of this trial (A.3.1-3), one CFU was found on the 90 mm TSA plate, and three CFU were found on the RCS stripe. This converts to 1 CFU/105 L × 1000 L = 9.5 CFU/m3 for the 90 mm TSA plate and 3 CFU/683 L × 1000 L = 4.4 CFU/m3 for the RCS® stripe. With the recommended limit of 100 CFU/m3, a total count of 10 CFU/plate or 68 CFU/stripe would be within the regulatory expectation.
The results of total CFU count during the ‘in operation’ phase of all tests at viable particle counter 1, located low inside process unit (V1) and viable particle counter 2, located high inside process unit (V2) are given in . In comparison with V1, the CFU counts at V2 were often lower. Series A and B are at the same level, whereas a significant increase is observed for C and D. Only two results at V1 (D.2 and D.4) exceeded the allowed limit.
Table 4. Results for microbial air sampling during ‘in operation’ (limit value: 100 CFU/m3).
See the review of the Supplementary material (Tables S3 and S4) for all ‘in operation’ microbial count results.
Settle plates (SP1/SP2)
Settle plates were laid out at SP1 (floor) and SP2 (table) for four hours each during the complete test period. It was expected that an increase of CFU could be observed from test series A to D. In fact, this expectation was confirmed, as presented in .
Table 5. CFUs on 4 h settle plates at position SP1 and SP2 (limit value 50 CFU/4 h).
The intentional generation of CFÚs during the spiking phase of series D shows its success in the high values on the morning of the third test day. The sampling plate on the table at SP2 could not be analyzed due to its huge number of MCPs that settled on that plate (see picture in ). The SPs of the 3rd day morning were the only ones which exceeded the allowed limit on 50 CFU/4 h.
Discussion
Particles
Two general observations are made from the results of the particle measurement:
The Annex 1 Class C ‘in operation’/ISO 8 limits for 0.5 µm particles were not exceeded in any of the executed tests. In fact, all measured values for this particle size were even below Class B ‘in operation’/ISO 7 limits.
For 5 µm particles, the limits were only exceeded due to fast and heavy, thus, inadequate movements of the operators.
During the ‘in operation’ phase of the tests with garment A at ACR 10, the offset between regulatory limit values and measured particles/m3 was 83-fold for 0.5 µm particles, and 18-fold for the 5 µm particles. The study design stipulated two operators in the cleanroom of 38.4 m2, which is a typical man load for an operational room of this size in the pharmaceutical industry. Loomans et al. studied the influence of the number of operators in a cleanroom and found that the first three persons have the biggest effect on the particle load [Citation14]. The increase of particle generation from two to three operators has a factor of approximately 2. Applying this to the given experiments, even the addition of another person would still not put a risk on the cleanroom cleanliness status from a regulatory point of view.
In single experiments, some peak loads of particles at certain points occurred. With the help of a video evaluation, these peaks could be traced back to one of the following events:
The disinfection of hands prior to the biomonitoring probe changeover using an aerosol spray bottle: though this was mostly done at the table close to the outlet air grid in the back of the process unit, the effect was observed from the operators on the particle counter displays. This is, however, a good indication of the homogenous air distribution caused by the swirl diffusers which was also shown by Whyte et al. [Citation26] and Lenegan [Citation27]. Given the airflow direction from the inlet to the outlet air grids, an aerosol particle movement against the general air flow direction to one of the particle counters would else not be possible. Yet, to avoid this unwanted effect on particle counters, the practice of hand disinfection was changed to a fluid immediately after this observation.
The changeover of biomonitoring plates and stripes: the RCS® air sampler (V2) was located on the process unit vessel at eye height, while the particle counters P1 and P2 were below that level in the same unit. It could be observed that the particle loads increased regularly every 7–8 minutes, which was exactly the time of biomonitoring change ( and ). The manual handling on the air sampler obviously caused the particle generation that was afterwards detected by the particle counters.
Differences in test results may also have been caused by the operators themselves. Three persons conducted the experiments with always two in the room, while the third paused. Thus, no subsequent experiments were performed with the same combination of operators. Different garment fabric of the individual persons’ clothes, for example, cotton vs. linen shirt, could then lead to a different particle generation with garments C and D, especially during the spiking phase.
The analysis of mean values from the ‘in operation’ period (15–25 min), as given in , confirms the expectation that a higher airflow leads to lower particle counts in a cleanroom. However, as mentioned before, the absolute level of contamination compared to the allowed limits is very low and makes differences between ACR 10 and ACR 20 neglectable. The achieved values in garment A at ACR 10 would still enable the room to operate even under Class B/ISO 7 conditions.
Table 6. ‘In operation’ phase 0.5 µm particle load.
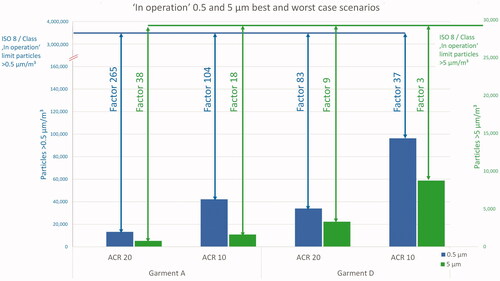
Comparing the best case scenario of garment A/ACR 20 with the worst case garment D/ACR 10 in a bar chart, makes the huge offset between measured values and regulatory limits for ISO 8/Class C visible ().
Figure 13. Offset between measured values and regulatory limits.
Viables
The expectations of this study with regard to viable particles have generally been fulfilled. It is shown that a better garment and a higher airflow lead to less biocontamination. A surprise is the good result of the porous garment B when compared to the tight garment A.
Furthermore, a correlation of 5 µm particle values and MCPs can be observed for example in experiment A.2. This is in line with the study results of Parat, who also found correlations between bacterial and particle counts [Citation28,p.951].
In test series C and D, the number of CFUs was sometimes below the value that was found in the previous experiment with a higher ACR. This is surprising, as a higher airflow is expected to be more efficient in MCP removal. It is assumed that this effect is caused by the chosen test sequence. As the operators wore the same clothes during all experiments at one day, the number of airborne particles and MCP was expectably higher in the first test, and then continuously decreased as the number of loose particles on the operators clothes declined throughout several tests. The same principle applies to surface bacteria on the skin.
The position of the air samplers also influences the results. As MCPs have a size of >1 µm, they are also more affected by sedimentation, as studied by Whyte and Agricola [Citation29]. The low position of V1 supports the ability to detect these sedimenting viable particles. In contrast, the high position of V2 might not collect a representative sample of all airborne viable particles, as heavier MCPs might not find their way into the RCS® probe head.
In terms of measurement accuracy, a disadvantage of the relatively short sampling time, resulting in low air sampling volume of the ImpactAir® Iso-Con Slit-to-Agar Microbial Air Sampler, became visible. For example, in test A.2.1, only two CFUs were found on the sample plate. Calculating the equivalent value for CFU/m3 based on the sampling volume of 15 L/min, the result is 19 CFU/m3. This is a big lever of 1:9.5 when applied to the study setup. Usually, this type of air sampler is used for longer sampling periods and, thus, higher sampling volumes.
Study limitations
This experimental study was designed to be as close as possible to real pharmaceutical operations. However, some limitations still apply: in real pharmaceutical operations, a room of similar size the rooms might be equipped with more or bigger machines than the study room. The number of interior items in the test room was probably less than in real operational rooms with more cupboards, desks, and equipment. Depending on the type of additional equipment (particle generating or not), this could have a positive or negative effect on the overall particle and MCP load. During the engineering of a room, the ACR demand is calculated according to the total volume of the room, without equipment. Any additional non-particle generating equipment placed in that room will reduce the free volume of the room and thereby increase the ACR. Instead, additional particle-generating equipment could increase the demand of air flow to remove particles or heat.
Some real process equipment will have a higher heat generation than the process unit used for this experimental study. During the experiments, the temperature difference from beginning to end in the room was approximately 3 K. Other (heated) process equipment might have a bigger influence on room temperature, which then requires a higher ACR to remove thermal energy, if other cooling sources are not available.
A combination with DCF strategies was not analyzed in this study. The (unintentional) deactivation of the HVAC system after room preparation prior to the start of the experiments led to higher particle values on the first day, rather than comparable measurements on the second day with an overnight low-level HVAC operation. This, on one hand, indicates the need for a continuous HVAC operation, on the other hand it supports the results of other scientists who found that DCF is a very good possibility for the reduction of energy demand [Citation11,Citation15,Citation30,Citation31].
Two of the four particle counters were placed within the process unit. As this is the critical area of sterile operations, these positions were chosen on purpose. As in much other process equipment, a pump with an attached motor operated within that unit. The motor fan generated a disturbance of the air flow originally initiated by the HVAC system. This might have interfered with the measured values of the particle counters located close to the motor. Yet, with the observed differences between all four particle counters, this effect, if at all, was obviously very small.
Conclusion
Based on these study results, the given research question ‘Which minimum value of an ACR is required to meet the regulatory expectations for the “in operation” status in a pharmaceutical ISO 8/Class C cleanroom?’ can clearly be answered with ACR 10. Higher ACRs may apply for other process conditions, e.g. equipment heat generation. This study, in combination with other scientific work, provides evidence that the FDA’s recommendation of ACR 20 for Class 100,000 (ISO 8) supporting rooms can be regarded as being outdated [Citation8,Citation19–21,Citation32].
Moreover, the given limit values for Class C ‘in operation’/ISO 8 conditions should be reviewed by all regulatory agencies. The results of this study revealed a tremendous difference between regulatory limits and actually measured values – even in a non-cleanroom appropriate garment. The high offset between measured and required values creates a huge safety buffer, which may cover up other cleanroom operation problems. This is similar to the ‘sea of inventory’ principle in operations management as described by Slack et al. [Citation33]: a higher storage inventory might avoid potential delivery problems, but it also masks the problems itself. This impedes actual problem detection and problem solving. A better way would be to lower the limit values to enable problem surfacing. As a result of this study, a re-definition of requirements for Class C limit values should be considered by regulatory agencies with the following parameters:
No requirement or recommendation for minimum ACRs.
Reduction of Class C limit values for 0.5 µm ‘in operation’ particles from 3,5200,000 to 352,000 (factor 10).
Reduction of Class C limit values for 5 µm ‘in operation’ particles from 29,000 to 14,500 (factor 2).
Reduction of Class C air sample limit values from 100 CFU/m3 to 50 CFU/m3 (factor 2).
With these measures, the current good manufacturing processes within the sterile manufacturing industry would not be affected significantly. Hidden problems would surface and could then be effectively treated.
Provided appropriate GMP control, the proposed limits could easily be achieved with an ACR of 10, which would meet the demands for the particle and MCP load, as well as for the required clean-up period time of a maximum of 20 min.
A 50% reduction of the ACR could save 25–30% energy due to reduced air fan power, heating, cooling, and humidification [Citation8]. Bisecting the widely used ACR of 20 h−1 to an actual scientifically based value of 10 h−1 would therefore significantly reduce the energy demand of HVAC systems in the pharmaceutical industry.
Supplementary_material_-_Effect_of_different_air_change_rates_on_cleanroom_in-operation_status_-_Behrens_et.al._-_Rev._Dec._29__2021.docx
Download MS Word (2.2 MB)Acknowledgements
The authors express special thanks to Testo Industrial Services, Kirchzarten, Germany and PMT, Heimsheim, Germany for the provision of rooms, equipment, and personnel.
Disclosure statement
No potential conflict of interest was reported by the authors.
References
- European Commission. Volume 4 – Good Manufacturing Practice (GMP) guidelines; 2021 [Internet] [cited 2021 Jan 26]. Available from: https://ec.europa.eu/health/documents/eudralex/vol-4_de
- European Commission. Annex 1: manufacture of sterile medicinal products (corrected version); 2009. Brussels, Belgium.
- Food and Drug Administration. Sterile drug products produced by aseptic processing – current good manufacturing practice. Rockville (MD); 2004.
- European Commission. Annex 1 draft 2020 – manufacture of sterile medicinal products. Brussels, Belgium; 2020 [Internet] [cited 2021 Jan 26]. Available from: https://ec.europa.eu/health/sites/health/files/files/gmp/2020_annex1ps_sterile_medicinal_products_en.pdf
- DIN EN ISO. ISO 14644-1 cleanrooms and associated controlled environments–part 1: classification of air cleanliness by particle concentration. Berlin: Beuth; 2021.
- Whyte W. The application of the ventilation equations to cleanrooms – part 2: decay of contamination. Clean Air Contain Rev. 2014;20:4.
- World Health Organization. WHO Expert Committee on specifications for pharmaceutical preparations: forty-fifth meeting report. (technical report series). Geneva: World Health Organization; 2011.
- Fedotov A. Saving energy in cleanrooms. Cleanroom Technol. 2014;22:14.
- Tschudi W, Benschine K, Fok S, et al. Cleanroom energy benchmarking in high-tech and biotech industries. Berkeley (CA): Lawrence Berkeley National Lab; 2001.
- Tschudi W, Mills E, Xu T, et al. Measuring and managing cleanroom energy use. Berkeley (CA): Ernest Orlando Lawrence Berkeley National Laboratory; 2005.
- Faulkner. Energy savings in cleanrooms from demand-controlled filtration. J Inst Environ Sci. 1996;39:21.
- Tschudi W. Cleanroom energy benchmarking results. ASHRAE Trans. 2002;109:733.
- Molenaar P. Ventilation efficiency improvement in pharmaceutical cleanrooms for energy demand reduction. Eindhoven: Eindhoven University of Technology; 2017.
- Loomans M, Molenaar P, Kort H, et al. Energy demand reduction in pharmaceutical cleanrooms through optimization of ventilation. Energy Build. 2019;202:109346.
- Loomans M, Ludlage T, van den Oever H, et al. Experimental investigation into cleanroom contamination build-up when applying reduced ventilation and pressure hierarchy conditions as part of demand controlled filtration. Build Environ. 2020;176:106861.
- VDI. VDI 2083 part 4.2: cleanroom technology: energy efficiency. Berlin: Beuth; 2011.
- ISPE. Baseline pharmaceutical engineering guide: volume 3: sterile product manufacturing facilities. 3rd ed. Tampa (FL): ISPE; 2018.
- ISPE. Baseline pharmaceutical engineering guide: volume 3: sterile product manufacturing facilities. 2nd ed. Tampa (FL): ISPE; 2011.
- Sun W, Mitchell J, Flyzik K, et al. Development of cleanroom required airflow rate model based on establishment of theoretical basis and lab validation. ASHRAE Trans. 2010;116:87.
- Behrens D, Bachhofer J, Zipp B, et al. Abreicherung von partikeln im Reinraum in Abhängigkeit der Luftwechselrate Pt.1 [Decrease of particles in cleanrooms in dependancy of air-change-rate]. Technopharm. 2020;10:284–288.
- Behrens D, Bachhofer J, Zipp B, et al. Abreicherung von partikeln im Reinraum in Abhängigkeit der Luftwechselrate Pt.2 [Decrease of particles in cleanrooms in dependancy of air-change-rate]. Technopharm. 2021;11:94–99.
- Merck M. Tryptic soy agar + LTHTh-ICR: technical data sheet [Internet]. Darmstadt; 2019 [cited 2021 Apr 19]. Available from: www.merckmillipore.com/biomonitoring
- Merck M. Hycon® agar strips TSM: technical data sheet [Internet]. Darmstadt; 2018 [cited 2021 Apr 19]. Available from: www.merckmillipore.com/biomonitoring
- Merck M. RCS® High flow touch: microbial safety at your fingertips [Internet]. Darmstadt; 2021 [cited 2021 Apr 19]. Available from: www.merckmillipore.com/biomonitoring
- Pinpoint Scientific. ImpactAir_IS0-90_Brochure [Internet]. Bridgend (UK); 2020 [cited 2021 Feb 23]. Available from: https://www.pmtgb.com/fileadmin/Datasheets_UK/ImpactAir_IS0-90_Brochure.pdf
- Whyte W, Hejab M, Whyte WM, et al. Experimental and CFD airflow studies of a cleanroom with special respect to air supply inlets. Int J Vent. 2010;9(3):197–209.
- Lenegan N. Diffuser performance. Clean Air Contain Rev. 2014;18:8.
- Parat S. Contribution of particle counting in assessment of exposure to airborne microorganisms. Atmos Environ. 1999;33(6):951–959.
- Whyte W, Agricola K. Comparison of the removal of macroparticles and MCPs in cleanrooms by surface deposition and mechanical ventilation. Clean Air Contain Rev. 2018;35:4–10.
- Ludlage T. Optimizing energy demand during the non-operational hours in a cleanroom. Eindhoven: Eindhoven University of Technology; 2019.
- Molenaar P, Loomans M, Joosten P, et al. Demand controlled filtration, a high potential energy savings measure for cleanrooms? REHVA J. 2019;2019:54–57.
- Birks S. Opinion ACRs – time for change? Cleanroom Technol. 2013;21:23.
- Slack N, Chambers S, Johnston R. Operations management. 6th ed. Harlow (UK), New York (NY): Financial Times Prentice Hall; 2010.