
ABSTRACT
Field experiments show that wheat grown after oilseed rape (OSR) achieves higher yield levels, while the nitrogen (N) application is reduced. However, field experiment data are based on few locations with optimised management. We analysed a large dataset based on farm data to assess the true extent of break crop benefits (BCB) for yield and N fertilisation within German commercial farming.
Across all German states and years, average yield of wheat preceded by OSR was 0.56 Mg ha−1 higher than yield of wheat preceded by cereals (7.09 Mg ha−1), although considerable variation between regions was observed. Mean N application across all states to wheat after OSR was 5 kg ha−1 lower than to wheat after cereals. Choice of wheat types for different end uses (bread flour or animal feed) showed higher (0.77 Mg ha−1) or lower (0.44 Mg ha−1) BCB for yield of wheat cultivated after OSR compared with after cereals. The calculated BCB for yield and N fertilisation were lower than expected from dedicated field experiments and fertiliser recommendations. Thus the advantages of OSR as a preceding crop are generally utilised by commercial farmers in Germany but there is room for improvement.
Introduction
In Germany, one of the world’s top 10 wheat producers, the area cropped with winter wheat (hereafter only referred to as wheat) has increased during the past 25 years (1990–2015) by 33%, to 3.16 million ha, which represents 26.6% of all arable land (DESTATIS Citation2001-2016). At district level, in 2010 wheat occupied more than 50% of arable land in Wolfenbüttel, Goslar and Hildesheim (LSN Citation2011). Such strong concentration is not possible without growing wheat after wheat in the same field. In 2010, 30% of wheat was cultivated after wheat in the German state (Nomenclature of Territorial Units for Statistics level 1 (NUTS 1 level)) of Lower Saxony (NI) (Steinmann & Dobers Citation2013). In general, such monoculture is associated with deteriorated soil fertility, yield and yield stability. World-wide, 12.6% of crop losses in wheat in the period 2001–2003 were reported to be caused by bacteria, fungi and viruses, and 7.7% by weeds (Oerke Citation2006). The gap between potential and commercial farm yield of wheat in the United Kingdom (2.7 Mg ha−1 or ~34%), France (2.2 Mg ha−1 or ~26%) and Denmark (2 Mg ha−1 or ~27%) has been attributed, among other factors, to short or non-existing crop rotations (Fischer et al. Citation2014). In order to control and counteract negative impacts by unfavourable preceding crops for wheat, increased application of mineral fertiliser (e.g. nitrogen) and pesticides is necessary (Andert et al. Citation2016; Roßberg Citation2016). In Germany, regional nitrogen (N) fertiliser recommendations for wheat take into account an additional demand of 20 kg N ha−1 to compensate for lower N availability when wheat is grown after a cereal crop (LWK-NI Citation2010; LWK-NW Citation2016; LWK-SH Citation2016). Mineral N fertiliser application is a major contributor to the carbon footprint of arable farming. The energy-intensive production process for mineral N fertiliser is associated with high carbon dioxide (CO2) emissions. Furthermore, about 1% of the N applied in the field is emitted as nitrous oxide (N2O) to the atmosphere (IPCC Citation2006) and N2O emissions have approximately 300 times higher global warming potential than CO2 (IPCC Citation2013). Recent studies show a non-linear relationship between N application and N2O emissions, i.e. an increasing proportion of added N is emitted if fertilisation rate increases (Shcherbak et al. Citation2014), in particular if this increase results in a substantial N surplus (Walter et al. Citation2015). The leaching of N to the hydrosphere can contribute to eutrophication of groundwater and surface water bodies and impair biodiversity and water quality (Richter et al. Citation2013). Increased application of pesticides can also affect biodiversity and is reported to potentially harm human health (Kim et al. Citation2017). Thus, increased use of fertiliser and pesticide inputs may offset the effects on yield decline to some extent, but is simultaneously contrary to societal and political aims such as preservation of existing biodiversity, mitigation of climate change and protection of water bodies and drinking water sources (Geiger et al. Citation2010; Richter et al. Citation2013). It is well known in Germany and elsewhere that, unlike cereal monoculture, wheat grown after oilseed rape (OSR) yields more than wheat grown after cereals (Angus et al. Citation2015; Sieling & Christen Citation2015). The mechanisms behind the break crop benefits (BCB) of OSR for wheat are improved soil structure, better weed control, suppression of propagation by typical cereal pathogens and avoidance of phytotoxic exudates released by harvest residues, which are suspected to inhibit development of juvenile wheat plants sown after wheat (Kirkegaard et al. Citation2008).
Another factor is the high N surplus after OSR, which can exceed 40% of applied N (Henke et al. Citation2008; Bouchet et al. Citation2016). To avoid negative environmental and economic impacts, regional N fertiliser recommendations take into account an ‘N credit’ of 10–20 kg N ha−1 from the previous OSR crop (Wendland et al. Citation2012; DLR Citation2016). The current German fertiliser regulations recommend a reduction of 10 kg N ha−1 and there is discussion on whether to make this mandatory in the new fertiliser regulation (BMEL Citation2015).
However, many other factors can affect BCB, such as cultivar selection, tillage regime, use of organic fertiliser, application and timing of pesticides and climate and soil conditions. Jenkyn et al. (Citation2014) report that factors such as failure to treat volunteer cereals in OSR, soil compaction and waterlogging can impede the prevention of take-all and thus diminish the BCB of OSR for wheat yield. Moreover, existing data on higher yield levels and reduced N requirement in wheat following OSR derive mainly from field experiments, which are limited to single locations, optimised management and a limited number of years, and thus quantification and extrapolation of these BCB may be uncertain. In particular, it is unknown how the yield increase in subsequent wheat crops differs between regions as a result of soil, weather and typical management and to what extent potential N savings are realised by commercial farmers.
Therefore, we conducted an assessment of the BCB of OSR for wheat, in comparison with cereal as the preceding crop, based on data from commercial farms in Germany. First, we attempted to quantify the BCB of OSR for wheat yield and N application by comparing oilseed rape-wheat (OSR-W) and cereal-wheat (C-W) sequences. We then compared our findings to the NUTS 1-specific N fertiliser recommendations and to results from dedicated field experiments to examine whether the potential advantages of OSR as a preceding crop are being fully exploited by commercial farms in Germany.
Material and methods
A large database of on-farm data containing information on wheat crops grown after OSR and after cereals was analysed. The dataset covered arable land in Germany in the period 2001–2015, which on average covered 11.9 million ha. Within this frame, we did not consider advances in plant breeding and agronomic technologies. German arable cropping systems are characterised by high yield and high production intensity. Germany ranks 7th among the world’s wheat-producing countries, with an average annual output of 23.5 Tg and a mean wheat yield of 7.5 Mg ha−1 (FAOSTAT Citation2001-2014).
Germany consists of the states Baden-Württemberg (BW), Bavaria (BY), Brandenburg (BB), Hesse (HE), Mecklenburg-Western Pomerania (MV), Lower Saxony (NI), North Rhine-Westphalia (NW), Rhineland-Palatinate (RP), Saarland (SL), Saxony (SN), Saxony-Anhalt (ST), Schleswig-Holstein (SH), Thuringia (TH) and the cities of Hamburg (HH), Bremen (HB) and Berlin (BE) at NUTS 1 level. The different NUTS 1 regions are hereafter referred to by their ISO3166-2 (Citation2013) code as given in the parentheses (see also the map in Figure S1). The data originated from two different sources: (i) the Agricultural Micro Census (AMC) (FDZ Citation2016) and (ii) the German Agricultural Soil Inventory (ASI) (Bach et al. Citation2011).
Agricultural micro census (AMC) data
The AMC is conducted annually under the auspices of the German federal ministry of agriculture and nutrition to gather information about the amount and quality of the harvest of cereals, OSR and potatoes. The survey was initiated after 1945 to monitor food security. Farms are selected randomly from the statistical farm register (separately for each crop) proportional to their cultivation area at NUTS 1 level. The particular field within each farm is again selected randomly. Participation and response to this survey are obligatory. All information is collected by designated commissaries (trained farmers) together with the selected farmers. The results are reported to the statistics authorities at NUTS 1 level. In addition to crop yield, information on e.g. preceding crop, wheat quality type, fertiliser management, field size and soil quality is collected to assure the plausibility and quality of yield data. Wheat quality types are divided into blending (E and A), bread (B) and feed (C) wheat, based on N content of the grain (which decreases in the order E > A > B > C). Cultivars not allocated to one to these classes are considered ‘not classified’.
The ‘Ackerzahl’, hereafter referred to as soil quality index, is a benchmark reflecting the average area-specific productiveness of German arable land. It is based on a system (BodSchätz Citation2007) where the most productive soil scores 100. Here, only wheat data with an OSR or cereal pre-crop collected 2001–2015 were analysed. The cereal pre-crops considered were wheat (82.4%), winter barley (6.7%), spring barley (2.6%), rye (3.4%), triticale (1.7%) and other cereals (2.9%), while maize and oats were excluded. OSR was solely winter oilseed rape, since spring oilseed rape is very rare in Germany and central Europe. Storage of data other than on yield is voluntary and implemented differently by the NUTS 1 regions. In BE, BY, BW, HB, HH, RP, HE and SL, no additional information is stored in an accessible manner and thus these regions were not included in the AMC dataset. The provision of statistical information which enables identification of individual persons, farms or holdings is prohibited by privacy legislation in Germany. In order to get access to AMC, various measures (such as suppressing field size and aggregation on NUTS 1 level) are applied by the data provider (FDZ Citation2016) to ensure the privacy of AMC farmers. As the AMC dataset did not provide information on N fertilisation intensity, use of an additional dataset was necessary.
The german agricultural soil inventory (ASI)
The ASI is conducted to quantify soil organic carbon stocks in agricultural land in Germany, which is done by systematic soil sampling. In order to select sites, an 8 km × 8 km regular grid is applied to agricultural land in Germany (Bach et al. Citation2011). For evaluation of soil characteristics, additional information on agricultural management is collected by questionnaire. A letter explaining the objectives of the survey and the questionnaire are sent to farmers managing a field in which a grid point is situated. Participation in the inventory and completion of the questionnaire are voluntary.
The questionnaire comprises two main parts: (i) asking general questions about the farm and (ii) asking specific questions with respect to site management of the grid point field for the past 15 years. Questions of relevance for this study were cultivation and yield of wheat, the preceding crop to wheat and application of mineral and organic N fertiliser. Again, only wheat data with an OSR or cereal pre-crop were analysed. The cereal group consisted of winter wheat (74.9%), winter barley (11.9%), spring barley (5.9%), triticale (2.9%), rye (3.4%) and other minor cereals such as spelt, spring wheat and durum wheat (0.3%), while maize and oats were excluded. Rigorous quality checks on the completeness of the questionnaire records, the crop-specific yields and their interaction with management information such as fertilisation level were conducted. If a questionnaire did not meet the required quality level, a telephone interview was conducted to fill the data gaps. The questionnaire was rejected if a phone interview was not possible. Since the ASI has not been completed yet and agriculture in the city states is negligible, the NUTS 1 regions BE, BB, HB, HH, SL and SN were not included in the ASI dataset.
In order to analyse the fertilisation intensity, it was necessary to transform organic fertiliser into mineral fertiliser equivalents (MFE). To estimate the total N amount (Nfert, kg N MFE ha−1) available to plants in the year of application, the following Equation (1) was applied:
where OFFM (Mg FM ha−1) is fresh matter amount of organic fertiliser (for liquid fertiliser a density of 1 Mg m−3 was assumed), DMcont (%) is dry matter content of organic fertiliser, Ncont (%) is N content of dry mass, MFE (%) is mineral fertiliser equivalents and Nfert,min (kg ha−1) is amount of mineral N fertiliser applied (Table S1).
Representatives and data analysis
To verify the coverage of NUTS 1 regions with data, the ratio of data points to the average wheat cultivation area in each NUTS 1 region according to DESTATIS (Citation2001-2016) was calculated separately for datasets containing yield information (ASI + AMC) and fertiliser information (ASI). The share of the pre-crop (between OSR and cereals) and the mean proportion of organic fertiliser in total N fertiliser were also calculated.
The R software environment (version R-3.1.1, R Core Team Citation2016) was used for statistical analysis. Descriptive statistics (relative frequencies and means) were calculated for each categorical variable. Linear mixed-effects regression analysis (R package lme4, version 1.1–6 (Bates et al. Citation2015)) was used to investigate the effect of BCB on wheat yield and N fertilisation, thereby accounting for location and annual effects as random effects. In addition, the livestock density, defined as the ratio of livestock units to agricultural land of each farm was included as a fixed effect for the determination of the BCB on N fertilization based on the ASI dataset. The best model was chosen based on Akaike’s information criterion (AIC) and likelihood ratio tests (Sakamoto et al. Citation1986). Confidence intervals were estimated by bootstrapping (Davison & Hinkley Citation1997). The significance of differences between pre-crops and wheat quality types in terms of changes in yield was analysed using ANOVA followed by Tukey’s post-hoc test (R package multcomp, version 1.4–6 (Hothorn et al. Citation2008)).
Results
Representativity of yield and fertiliser data
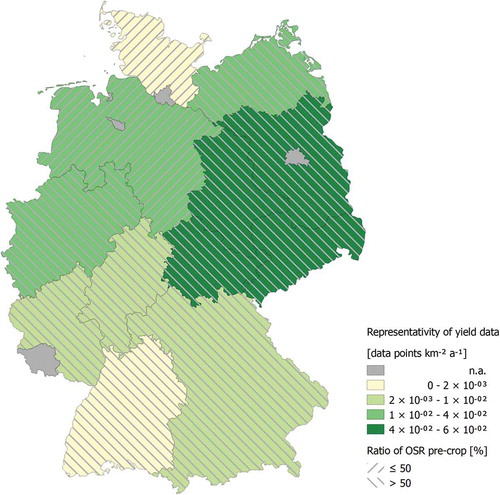
To assess the BCB for wheat yield, 11,553 data points were used in total. The NUTS 1 regions ST, BB, TH, ST and SN were represented by at least 0.04 data points km−2 a−1 while the poorest data coverage was observed in SH and BW (<0.002 data points km−2 a−1) (). Based on the AMC and ASI datasets, in all NUTS 1 regions except NI and SH, OSR is the dominant pre-crop for wheat.
Figure 1. Ratio of wheat data points to mean wheat cultivation area 2001–2015 (data points km−2 a−1) at NUTS 1 level, based on the AMC and ASI datasets. Hatching depicts ratio of oilseed rape (OSR) to cereals as preceding crop to wheat (based on wheat grown after cereals and OSR).
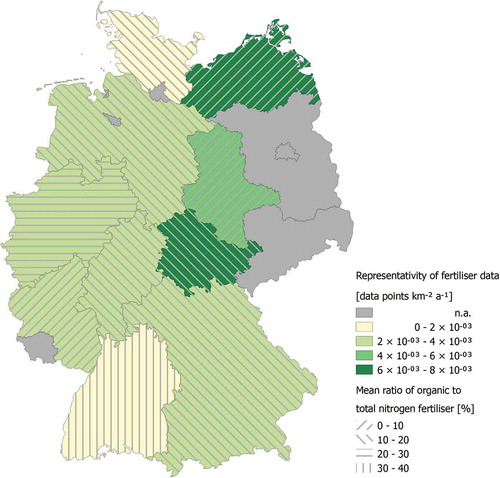
To assess the BCB for N fertilisation intensity, the ASI dataset with 1,471 data points was used. The regions represented with the most data proportional to the yearly mean wheat cultivation area were MV and TH, whereas data coverage for the regions SH and BW was comparatively low (). In HH, BE, HB, SL, SN and BB, no data on fertiliser application were available. The mean proportion of organic fertiliser to total N fertiliser was highest (>20%) in BW and NW and lowest (<10%) in MV and ST.
Figure 2. Ratio of wheat data points with fertiliser information and mean wheat cultivation area 2001–2015 (data points km−2 a−1) at NUTS 1 level based on the ASI dataset. Hatching depicts mean ratio of organic to total nitrogen fertiliser (%).
Yield benefits
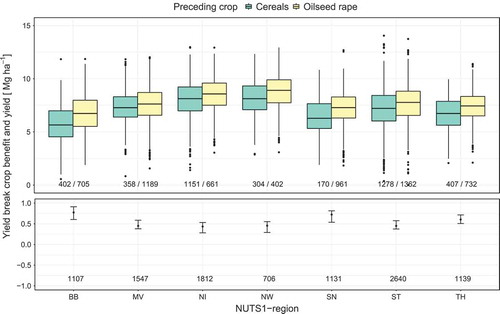
Based on the AMC data, mean wheat yield was 7.48 Mg ha−1 (95% CI: 7.44–7.51 Mg ha−1). The median yield of wheat in the AMC dataset in all NUTS 1 regions was higher after OSR than after cereals (). The population mean of wheat yield in both crop sequences differed with quality type of the cultivars in the following ascending order: type E (6.83 Mg ha−1), type ‘not classified’ (7.17 Mg ha−1), type A (7.47 Mg ha−1), type B (7.93 Mg ha−1) and type C (8.03 Mg ha−1). On NUTS 1 level, maximum mean yield of 8.20 Mg ha−1 and 8.50 Mg ha−1 was observed in NI and NW, respectively. The greatest relative deviations in wheat yield between OSR-W and C-W sequences appeared in the low-yielding regions BB (17.5%) and SN (13.6%), while the smallest relative yield differences were found in NI (6.0%) and MV (5.1%).
Figure 3. Observed yield for wheat cultivated after oilseed rape (OSR) and cereals (top) and calculated mean yield break crop benefit (BCB) for wheat cultivated after OSR in comparison with wheat cultivated after cereals (bottom), aggregated on NUTS 1 level. Values above zero represent yield benefits and error bars show the 95% confidence interval. Numbers represent data points based on the AMC dataset (2001–2015).
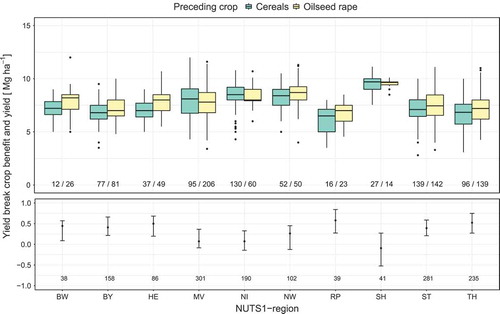
Mean wheat yield in the ASI dataset was 7.62 Mg ha−1 (95% CI: 7.55–7.70 Mg ha−1). In comparison with the AMC dataset, not all NUTS 1 regions (MV, SH and NI) from the ASI dataset had median yields of wheat showing a positive BCB on yield of wheat sown after OSR ().
Figure 4. Observed yield for wheat cultivated after oilseed rape (OSR) and cereals (top) and calculated mean yield break crop benefit (BCB) for wheat cultivated after OSR in comparison with wheat cultivated after cereals (bottom) aggregated on NUTS 1 level. Values above zero represent yield benefits and error bars show the 95% confidence interval. Numbers represent data points based on the ASI dataset (2001–2015).
The result of the model based on the AMC dataset revealed that across all NUTS 1 regions and years, the average yield of wheat preceded by OSR was significantly (p = 0.0003) higher, by 0.56 Mg ha−1 (95% CI: 0.40–0.69 Mg ha−1), than the yield of wheat preceded by cereals (7.09 Mg ha−1; 95% CI: 6.46–7.79 Mg ha−1). A positive BCB for yield was significant in all regions (p < 0.05) but its magnitude varied considerably, between a maximum of 0.77 Mg ha−1 in BB and a minimum of 0.43 Mg ha−1 in NI (). Accounting for wheat quality type in the model, the results revealed different BCB effect sizes of 0.77 Mg ha−1 (E), 0.51 Mg ha−1 (A), 0.44 Mg ha−1 (B), 0.58 Mg ha−1 (C) and 0.51 Mg ha−1 (not classified) between wheat quality types.
In comparison, the calculated population mean from the ASI data across all NUTS 1 regions and years indicated that fields with wheat grown after OSR yielded 0.32 Mg ha−1 (p = 0.026, 95% CI: 0.10–0.57 Mg ha−1) more grain than those with wheat grown after cereals, which achieved a mean yield of 7.65 Mg ha−1 (95% CI: 6.97–8.24 Mg ha−1). The model fitted to the ASI dataset predicted the greatest BCB for yield of wheat after OSR in regions RP (0.58 Mg ha−1, p < 0.05), TH (0.52 Mg ha−1, p < 0.05) and HE (0.50 Mg ha−1, p < 0.05), while in MV, NI, NW and SH there was no significant BCB for yield ().
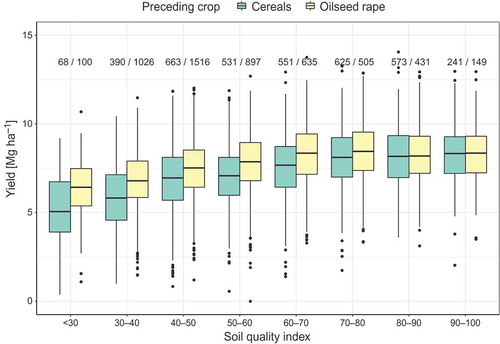
With increasing soil quality index, the positive BCB of OSR for wheat yield decreased (). On poorer soil (soil quality index <30), the relative BCB for yield was 20.2%, while on potentially more productive soils (quality index >90), the mean relative BCB for yield was 1.2%.
Figure 5. Observed wheat yield based on the AMC data 2001–2015, aggregated on NUTS 1 level, with cereal or oilseed rape as previous crop according to the soil quality index.
Nitrogen benefits
Mean total N fertilisation for wheat preceded by OSR and cereals was 195 kg N MFE ha−1 (95 % CI: 193–197 kg N MFE ha−1). In the NUTS 1 regions TH, ST, RP, NI, MV and HE, wheat grown after OSR received similar or less N than wheat after cereals (). In BY and BW, the median N application to wheat preceded by OSR exceeded that to wheat preceded by cereals.
Figure 6. Observed total nitrogen application for wheat grown after oilseed rape (OSR) and after cereals (top) and calculated mean nitrogen break crop benefit (BCB) for wheat cultivated after OSR compared with after cereals (bottom). Aggregated on NUTS 1-level, nitrogen amounts below zero represent nitrogen savings and error bars show the 95% confidence interval. Numbers represent data points based on the ASI dataset (2001–2015).
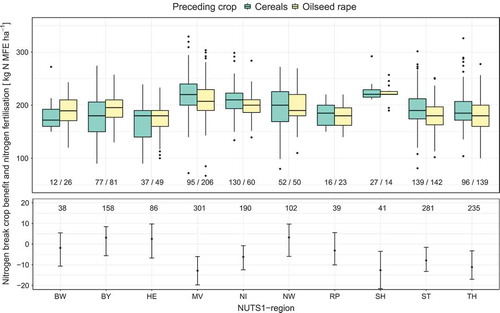
The calculated average N application across all NUTS 1 regions to wheat after OSR was 5 kg N MFE ha−1 (95% CI: 4–7 kg N MFE ha−1) lower than that to wheat after cereals. The greatest (p < 0.05) N reduction at NUTS 1 level was calculated for MV (13 kg N MFE ha−1), SH (13 kg N MFE ha−1), TH (11 kg N MFE ha−1), ST (8 kg N MFE ha−1) and NI (6 kg N MFE ha−1) ().
To test whether the results were affected by the high share of organic N fertiliser in several NUTS 1 regions, the model was fitted (i) only to wheat cultivation which solely received mineral N fertiliser (total n = 1103, OSR-W n = 608, C-W n = 495) and (ii) only to wheat cultivation on farms specialized in field crop production (cash crop farms) as defined in (EC) No. 1242/2008 (EC Citation2008) (total n = 883, OSR-W n = 451, C-W n = 432). The first approach revealed that the average N application across all NUTS 1 regions to wheat after OSR was 3 kg ha−1 (95% CI: −4 to 9 kg ha−1) lower than to wheat after cereals if only mineral fertilisers were used. The second approach with the model fitted to data points from cash crop farms revealed, across all NUTS 1 regions, N savings of 9 kg ha−1 (95% CI: 4–14 kg ha−1). The higher mean N application to wheat after OSR () turned into an N reduction of 3 kg ha−1 (BY), 6 kg ha−1 (NW) and 9 kg ha−1 (HE).
Discussion
The magnitude of the calculated BCB for yield of wheat was higher based on AMC than based on the ASI dataset. Since the AMC data were obtained and measured following a uniform guideline, while the ASI data were measured or only estimated by farmers in several ways, the AMC results can be considered more reliable. Nevertheless, model results from both datasets indicated significant BCB for yield in favour of wheat sown after OSR. These results are in line with findings by Bourgeois and Entz (Citation1996), who reported a relative BCB for wheat yield after OSR of 8% in comparison with wheat sown after wheat in commercial fields in Canada 1982–1993. Furthermore, results from an Australian farm survey showed mean BCB of a preceding OSR for wheat yield of 0.39–0.56 Mg ha−1 depending on soil type (Moodie Citation2012). In comparison with field experiment data, the present results were lower than the average BCB for yield of 0.8 ± 0.2 Mg ha−1 reported in a comprehensive literature review (Angus et al. Citation2015). In particular, field trials in Germany and England gave a BCB for yield of 0.97 Mg ha−1 (Sieling & Christen Citation2015) to 1.9 Mg ha−1 (McEwen et al. Citation1990) when comparing wheat after OSR and wheat after wheat. Considering that the cereal pre-crops in ASI and AMC datasets included 25.1 and 17.6% other cereals, respectively, rather than wheat, comparison can introduce uncertainties. For instance, a 15-year field trial in south-west Germany showed that a BCB of 1.01 Mg ha−1 decreased to 0.39 Mg ha−1 when wheat after OSR was compared with wheat after cereal sequences instead of wheat monocultures (Schönhammer & Fischbeck Citation1987). One reason for this was that the disease severity of take-all (caused by Gaeumannomyces graminis var. tritici) and eyespot (Pseudocercosporella herpotrichoides, Oculimacula yallundae), and thus the associated negative impact on yield, was lower in cereal sequences than in wheat monocultures (Schönhammer & Fischbeck Citation1987). Further reasons for lower BCB on yield in commercial farming in comparison to field experiments were that conditions for on-farm trials are typically less controlled than those for field trials meaning that treatment complexity in field experiments apart from pre-crop is limited. In contrast commercial farmers use various strategies to avoid negative impacts of unfavourable pre-crops. The increased application of fertilizer and utilisation of mechanical and chemical plant protectant measures in continuous cereal cropping can lower the observed BCB on yield and nitrogen in commercial farming in comparison to field trials.
Due to its taproot, the introduction of OSR to cereal-dominated cropping sequences is expected to maintain soil structure and thereby improve plant water and nutrient availability (Chan & Heenan Citation1996; Chen & Weil Citation2010). The AMC data showed that under conditions with sufficient N supply within commercial farming, despite lower yield levels the greatest BCB on yield mainly occurred in regions such as BB and SN characterised on average by lower soil quality index and lower mean annual precipitation.
An additional finding was that cultivars for different end use showed higher (0.77 Mg ha−1) or lower (0.44 Mg ha−1) BCB for yield of wheat after OSR compared with wheat after cereals. On conducting field trials in France and analysing data on 27 wheat genotypes, Bogard et al. (Citation2010) reported a significant negative correlation between mean grain yield and grain protein content, with a slope of −0.015% g−1 m−2, i.e. if protein content of the grain increases by 10 g kg−1, yield can be expected to decrease by 0.67 Mg ha−1. When the difference between wheat type E and wheat type C (1.20 Mg ha−1) was computed using the assumed protein content gradient (40 g kg−1), the AMC dataset revealed a negative impact of 10 g kg−1 grain protein content to −0.3 Mg ha−1 grain yield under commercial conditions.
The magnitude of the BCB for yield also depends on the level of N supply, with higher BCB with lower N supply. A three-year non-fertilised field trial in England showed a BCB for yield of 2.6 Mg ha−1 of wheat after OSR compared with wheat after wheat, indicating the importance of high N soil residuals released by OSR (McEwen et al. Citation1990). Comparing the observed BCB for N application and fertiliser recommendations, the general N reduction observed here (5 kg ha−1) was lower than proposed by the recommendations (10–20 kg ha−1). Three NUTS 1 regions even showed higher N applications after OSR than after cereals. Farms in these three NUTS 1 regions were characterised by less arable land area, smaller field size, higher livestock density and, as a consequence, higher long-term organic fertiliser application. The distribution of wheat types in NUTS 1 regions differs (Table S2) and among other factors the N requirement depends on the target protein content of the grain. In the fertiliser recommendations, the N demand of wheat types E and C can differ by 40 kg N ha−1 (Wendland et al. Citation2012). According to the AMC dataset, wheat with a target for high grain protein content (type E and A) was more likely to be grown after OSR than after cereals. Thus in regions where wheat cultivation was dominated by ‘low-protein’ cultivars, wheat cultivars with potential for higher protein content were preferentially grown after OSR, which may have resulted in higher N application rates after OSR in specific regions. This can be neglected in regions such as TH and SN, which were dominated by more than 80% wheat type A or E and where high-quality cultivars were also cultivated after cereals. In regions such as NW, where A and E wheat types make up less than 21% of the cultivated wheat area, this issue can affect the model result on BCB for N application. Since both datasets did not provide data on pre-crop, cultivar, grain protein content and fertilisation at the same time, or at all, this hypothesis remains unverified.
When testing the influence of organic fertiliser, the removal of all data points with organic N supply did not change the model results. Thus, uncertainties associated with the application of different MFE did not substantially affect the result of the BCB for N application. In contrast, exclusive consideration of wheat cultivation on cash crop holdings to fit the model increased the BCB for N application across all NUTS 1 regions (9 kg N MFE ha−1) and improved the significance of the results (p = 0.00171). This effect could be explained by OSR being more often included in crop rotations at cash crop farms than at livestock farms. However, wheat is an important crop at both farm types. Since there is less organic fertilisation at cash crop farms, they do not benefit from the associated long-term N delivery and farmers counterbalance this with higher mineral N applications to wheat. Consequently, in particular in regions with considerable livestock production, such as NW and BY, OSR predominantly being cultivated at cash crop farms but wheat being cultivated at both farm types results in less N reduction (averaged over all farms) for wheat grown after OSR. Furthermore, there is a stronger economic incentive for reducing mineral fertiliser use (due to acquisition costs) than for reducing organic fertiliser use. Thus, cash crop farms utilise BCBs better than livestock farms. The data also indicates an effect on farm size (not shown): Larger farms appear to utilise BCBs better, presumably because they are economically better optimised. The applied N to yield (dry mass) ratio and the N balance were chosen as parameters to assess whether the advantages of OSR as a preceding crop were being exploited by commercial farms, since higher yield in combination with reduced N application affected both parameters. The overall applied N to yield (dry mass) ratio of wheat after OSR was reduced by 1 kg N Mg−1 for OSR-W in comparison with C-W. Results from field experiments in England and Germany have revealed greater reductions, of 4 to 12 kg N Mg−1, in comparison with wheat grown after wheat (McEwen et al. Citation1990; Sieling & Christen Citation2015). Assuming 2.1% N content in wheat grain across all types, together with the overall BCB for yield (0.56 Mg ha−1) and N (5 kg N ha−1), the N balance of wheat after OSR was reduced by −17 kg N ha−1 compared with wheat after cereals. This value is below expectations based on German fertilisation recommendations and field trial results, but lies within the range of −22 to −4 kg N reported elsewhere (St. Luce et al. Citation2016). Regional maximum results for N balance reduction were −24 kg N ha−1 (TH), −22 kg N ha−1 (MV), −17 kg N ha−1 (ST) and −15 kg N ha−1 (NI), indicating considerable utilisation of BCB of OSR as a preceding crop in these NUTS 1 regions.
The amount of arable land in Germany occupied by cereals is currently 55% of the total arable land (DESTATIS Citation2001-2016). Hence in many regions farmers cannot avoid second cereal crops. Winter barley, triticale and rye suffer less by cereal pre-crops compared to wheat because they are less prone to stem and root diseases (Cromey et al. Citation2006; Bithell et al. Citation2011). On the other hand, wheat is often more productive and the gross margins are greater than for other small-grain cereals (EC Citation2014). However, with the rising demand for environmentally friendly production of food and biomass and the increasing cost of food, feed, fuel, fertiliser and pesticides, exploitation of BCB can gain more attention in future and drive back monocultures.
Conclusions
This study showed that on commercial farms in Germany, wheat yields following OSR were significantly higher than wheat yields from continuous cereal cropping, particularly in NUTS 1 regions with lower soil quality and low mean annual precipitation. It also showed that across all NUTS 1 regions, the N savings were below the German fertiliser recommendations. Farmers in some regions seemed to exploit the N saving potential more than in others, although differences in farm structure and cultivar preferences seem to be responsible for highly variable N saving results in different NUTS 1 regions. While crop diversity is part of the greening program in European Union (EU) agricultural policies, the requirements seem to be too weak to support exploitation of the potential yield and N benefits from preceding OSR in wheat cultivation. In order to successfully combat climate change, reduce loss of biodiversity and achieve good qualitative and quantitative status of all water bodies within the EU, the results indicate that the BCB of OSR for wheat cultivation should be fully exploited.
Supplement.pdf
Download PDF (257.3 KB)Acknowledgements
We acknowledge the ASI staff for preparing and the participating farmers for providing agricultural management data by the questionnaire. We also thank four anonymous reviewers and the editor for their helpful comments and constructive suggestions, which have greatly improved the quality of this paper.
Disclosure statement
No potential conflict of interest was reported by the authors.
supplemental material
The supplemental material for this article can be accessed here.
Additional information
Funding
Related Research Data
References
- Andert S, Bürger J, Stein S, Gerowitt B. 2016. The influence of crop sequence on fungicide and herbicide use intensities in North German arable farming. Eur J Agron. 77:81–89.
- Angus JF, Kirkegaard JA, Hunt JR, Ryan MH, Ohlander L, Peoples MB. 2015. Break crops and rotations for wheat. Crop Pasture Sci. 66:523–552.
- Bach M, Freibauer A, Siebner C, Flessa H. 2011. The german agricultural soil inventory: sampling design for a representative assessment of soil organic carbon stocks. Procedia Environ Sci. 7:323–328.
- Bates D, Maechler M, Bolker B, Walker S. 2015. Fitting linear mixed-effects models using lme4. J Stat Softw. 67:1–48.
- Bithell SL, Butler RC, Harrow S, McKay A, Cromey MG. 2011. Susceptibility to take-all of cereal and grass species, and their effects on pathogen inoculum. Ann Appl Biol. 159:252–266.
- BMEL. 2015. Verordnungsentwurf novellierte DüV [Proposal for the new federal fertiliser ordinance] [Internet]. [cited 2016 May 23]. Available from: http://www.bmel.de/SharedDocs/Downloads/Service/Rechtsgrundlagen/Entwuerfe/EntwurfDuengeverordnung.html
- BodSchätz G. 2007. Bodenschätzungsgesetz vom 20. Dezember 2007 (BGBI. I S. 3150, 3176), das durch den Artikel 232 der Verordnung vom 31. August 2015 (BGBI. I S. 1474) geändert worden ist [Law on the estimation of soil fertility] [Internet]. [cited 2016 May 23]. Available from: http://www.gesetze-im-internet.de/bundesrecht/bodsch_tzg_2008/gesamt.pdf
- Bogard M, Allard V, Brancourt-Hulmel M, Heumez E, Machet J-M, Jeuffroy M-H, Gate P, Martre P, Le Gouis J. 2010. Deviation from the grain protein concentration–grain yield negative relationship is highly correlated to post-anthesis N uptake in winter wheat. J Exp Bot. 61:4303–4312.
- Bouchet A-S, Laperche A, Bissuel-Belaygue C, Snowdon R, Nesi N, Stahl A. 2016. Nitrogen use efficiency in rapeseed. A review. Agron Sustain Dev. 36:1–20.
- Bourgeois L, Entz MH. 1996. Influence of previous crop type on yield of spring wheat: analysis of commercial field data. Can J Plant Sci. 76:457–459.
- Chan KY, Heenan DP. 1996. The influence of crop rotation on soil structure and soil physical properties under conventional tillage. Soil Tillage Res. 37:113–125.
- Chen G, Weil RR. 2010. Penetration of cover crop roots through compacted soils. Plant Soil. 331:31–43.
- Core Team R. 2016. R: A language and environment for statistical computing [Internet]. Vienna, Austria. Available from: https://www.R-project.org/
- Cromey MG, Parkes RA, Fraser PM. 2006. Factors associated with stem base and root diseases of New Zealand wheat and barley crops. Australas Plant Pathol. 35:391–400.
- Davison AC, Hinkley DV. 1997. Bootstrap methods and their application. Cambridge: Cambridge University Press.
- DESTATIS. 2001-2016. Fachserie 3 Reihe 3.2.1, Wachstum und Ernte-Feldfrüchte. Jahrgänge 2001-2015. [Statistical data on the cultivation area and yield of the main arable crops from 2001-2015 in Germany] [Internet]. [cited 2016 May 23]. Available from: www.destatis.de/DE/Publikationen/Thematisch/LandForstwirtschaft/ErnteFeldfruechte/FeldfruechteJahr2030321157164.html
- DLR. 2016. Hinweise zu den kulturspezifischen Anleitungen zur Stickstoffdüngung nach der Nmin-methode in Rheinland-Pfalz [Nitrogen fertiliser recommendation for the NUTS 1 region Rhineland-Palatinate] [Internet]. [cited 2016 May 23]. Available from: www.dlr.rlp.de/Internet/global/themen.nsf/ALL/BF768AF49C7AFB63C1256FB00036A4EB/$FILE/Nmin-Methode%20Rheinland-Pfalz%20Sollwertsysteme.pdf
- EC. 2008. Commission Regulation (EC) No 1242/2008 of 8 December 2008 establishing a Community typology for agricultural holdings [Internet]. [cited 2016 May 23]. Available from: http://eur-lex.europa.eu/legal-content/EN/ALL/?uri=CELEX:32008R1242
- EC. 2014. EU cereal farms report 2013 based on FADN data [Internet]. [cited 2017 Jan 25]. Available from: http://ec.europa.eu/agriculture/rica/pdf/cereal_report_2013_final.pdf
- FAOSTAT. 2001-2014. Statistical data of wheat production quantity [Internet]. [cited 2016 Sep 19]. Available from: http://faostat3.fao.org/download/Q/QC/E
- FDZ. 2016. Besondere Ernte- und Qualtitätsermittlung [Agricultural Micro Census Data (AMC)] [Internet]. [cited 2016 Jul 28]. Available from: http://www.statistik-nord.de/ueber-uns/forschungsdatenzentrum/
- Fischer R, Byerlee D, Edmeades G 2014. Crop yields and global food security: will yield increase continue to feed the world? [Internet]. Available from: http://aciar.gov.au/publication/mn158
- Geiger F, Bengtsson J, Berendse F, Weisser WW, Emmerson M, Morales MB, Ceryngier P, Liira J, Tscharntke T, Winqvist C, et al. 2010. Persistent negative effects of pesticides on biodiversity and biological control potential on European farmland. Basic Appl Ecol. 11:97–105.
- Henke J, Böttcher U, Neukam D, Sieling K, Kage H. 2008. Evaluation of different agronomic strategies to reduce nitrate leaching after winter oilseed rape (Brassica napus L.) using a simulation model. Nutr Cycl Agroecosystems. 82:299.
- Hothorn T, Bretz F, Westfall P. 2008. Simultaneous inference in general parametric models. Biom J. 50:346–363.
- IPCC. 2006. Guidelines for national greenhouse gas inventories volume 4 agriculture, forestry and other land use [internet]. [cited 2016 May 23]; 4. Available from: http://www.ipcc-nggip.iges.or.jp/public/2006gl/vol4.html
- IPCC. 2013. The physical science basis. contribution of working group i to the fifth assessment report of the intergovernmental panel on climate change [Internet]. [cited 2017 Mar 1]; 5. Available from: https://www.ipcc.ch/report/ar5/wg1/
- ISO3166-2. 2013. ISO 3166-2. Geneva: International Organization for Standardization.
- Jenkyn JF, Gutteridge RJ, White RP. 2014. Effects of break crops, and of wheat volunteers growing in break crops or in set-aside or conservation covers, all following crops of winter wheat, on the development of take-all (Gaeumannomyces graminis var. tritici) in succeeding crops of winter wheat. Ann Appl Biol. 165:340–363.
- Kim K-H, Kabir E, Jahan SA. 2017. Exposure to pesticides and the associated human health effects. Sci Total Environ. 575:525–535.
- Kirkegaard J, Christen O, Krupinsky J, Layzell D. 2008. Break crop benefits in temperate wheat production. Field Crops Res. 107:185–195.
- LSN. 2011. Bodennutzung und Ernte 2010 Die Bodennutzung der landwirtschaftlichen Betriebe in Niedersachsen. Anbau und Erntemengen auf landwirtschaftlich genutzten Flächen Niedersachsens. [Statistical data on the cultivation area and yield of the main arable crops 2010 in the NUTS 1 region Lower Saxony] [Internet]. [cited 2016 May 23]. Available from: http://www.statistik.niedersachsen.de/portal/live.php?navigation_id=25698&article_id=87592&_psmand=40
- LWK-NI. 2010. Düngeempfehlungen Stickstoff, Getreide, Raps, Hackfrüchte [Nitrogen Fertilizer recommendations cereals, oilseed rape, tuber crops in the NUTS 1 region Lower Saxony] [Internet]. [cited 2016 May 23]. Available from: www.lwk-niedersachsen.de/index.cfm/portal/pflanze/nav/341/article/14022.html
- LWK-NW. 2016. Stickstoff-Düngeempfehlung [Nitrogen fertilizer recommendation for the NUTS 1 region North Rhine-Westfalia] [Internet]. [cited 2016 May 23]. Available from: www.nmin.de
- LWK-SH. 2016. N-Düngeplanung [Nitrogen fertilizer recommendation for the NUTS 1 region Schleswig-Holstein]. [Internet]. [cited 2016 May 23]. Available from: http://www.lksh.de/landwirtschaft/pflanze/duengung/edv-anwendungen002F
- McEwen J, Darby RJ, Hewitt MV, Yeoman DP. 1990. Effects of field beans, fallow, lupins, oats, oilseed rape, peas, ryegrass, sunflowers and wheat on nitrogen residues in the soil and on the growth of a subsequent wheat crop. J Agric Sci. 115:209–219.
- Moodie M 2012. Production and environmental impacts of broad leaved break crops in the Mallee [Internet]. Mildura: Mallee Catchment Management Authority; [cited 2016 May 23]. Available from: http://www.malleecma.vic.gov.au/resources/reports/breakcrops_msfsurvey2012final.pdf
- Oerke EC. 2006. Crop losses to pests. J Agric Sci. 144:31–43.
- Richter S, Völker J, Borchardt D, Mohaupt V. 2013. The water framework directive as an approach for integrated water resources management: results from the experiences in Germany on implementation, and future perspectives. Environ Earth Sci. 69:719–728.
- Roßberg D. 2016. Erhebungen zur Anwendung von Pflanzenschutzmitteln im Ackerbau [Survey on application of chemical pesticides in agriculture]. J Kulturpflanzen. 68:25–37.
- Sakamoto Y, Ishiguro M, Kitagawa G. 1986. Akaike information criterion statistics. Boston: D. Reidel Publishing Company.
- Schönhammer A, Fischbeck G. 1987. Untersuchungen an getreidereichen Fruchtfolgen und Getreidemonokulturen. I. Die Differenzierung der Ertragsleistung und deren Struktur im Verlauf von 15 Versuchsjahren [Investigation at cereal dominated crop rotations and cereal monocultures. I. The differentation of yield performance and yield components during a 15 year cultivation period]. Bayr Landw Jahrb. 64:175–191.
- Shcherbak I, Millar N, Robertson GP. 2014. Global metaanalysis of the nonlinear response of soil nitrous oxide (N2O) emissions to fertilizer nitrogen. Proc Natl Acad Sci. 111:9199–9204.
- Sieling K, Christen O. 2015. Crop rotation effects on yield of oilseed rape, wheat and barley and residual effects on the subsequent wheat. Arch Agron Soil Sci. 61:1531–1549.
- St. Luce M, Grant CA, Ziadi N, Zebarth BJ, O’Donovan JT, Blackshaw RE, Harker KN, Johnson EN, Gan Y, Lafond GP, et al. 2016. Preceding crops and nitrogen fertilization influence soil nitrogen cycling in no-till canola and wheat cropping systems. Field Crops Res. 191:20–32.
- Steinmann -H-H, Dobers ES. 2013. Spatio-temporal analysis of crop rotations and crop sequence patterns in Northern Germany: potential implications on plant health and crop protection. J Plant Dis Prot. 120:85–94.
- Walter K, Don A, Fuß R, Kern J, Drewer J, Flessa H. 2015. Direct nitrous oxide emissions from oilseed rape cropping – a meta-analysis. GCB Bioenergy. 7:1260–1271.
- Wendland M, Diepolder M, Capriel P 2012. Leitfaden für die Düngung von Acker- und Grünland Gelbes Heft [Nitrogen fertiliser recommendation for the NUTS 1 region Bavaria] [Internet]. [cited 2016 May 23]. Available from: https://www.lfl.bayern.de/mam/cms07/publikationen/daten/informationen/leitfaden-duengung-gruenland-10-auflage-2012_lfl-information.pdf