
 ?Mathematical formulae have been encoded as MathML and are displayed in this HTML version using MathJax in order to improve their display. Uncheck the box to turn MathJax off. This feature requires Javascript. Click on a formula to zoom.
ABSTRACT
Sustainable nitrogen (N) management represents the nitrogen-use efficiency (NUE) of crops associated with agricultural productivity. The NUE and sustainable N management index (SNMI) of different crops were evaluated with two levels of crop residues (no residue, NR vs. 30 cm residue, CR) and four levels of N fertilizers (control, CL; farmers’ practice, FP; national recommended dose, RD; and 125% of RD, 1.25 RD) on intensively managed potato, maize and rice-based cropping systems during 2020–2022. Increasing N fertilization increased winter and monsoon rice yields, while the effects were similar for pre-monsoon rice. Despite site and season specific, NUE showed mixed effects of CR and N rate interaction, being higher in CR-1.25 RD for rice and potato but lower for maize. Likewise, SNMI was lower in 1.25 RD coupled with CR for rice and potato but opposite for maize. Despite NUE corresponds well with the SNMI, the latter fits better with the crop yield, nutrient uptake, N requirement and N use model, suggesting that SNMI predicts optimum N management. Using the SNMI, a scatter diagram-based model optimized N fertilization for crops were: 169, 152, 187, 92, and 112 kg N ha−1 for potato, maize, winter rice, pre-monsoon rice and monsoon rice respectively.
Introduction
Global consumption of N fertilizers is increasing to meet the demand of food security with the limited natural resources. The FAO (Citation2018) has predicted that, by 2050, worldwide use of N fertilizers is expected to increase by 50%. Yet, indiscriminate N fertilization causes low and unsustainable N-use efficiency (NUE) of crops (Menegat et al. Citation2022) in terms of economic viability and environmental compatibility. Moreover, indiscriminate N fertilization often accelerates agroecosystem disservices (van Grinsven et al. Citation2015; Pituello et al. Citation2016; Schauberger et al. Citation2018; Erisman Citation2021). While the NUE itself cannot alone explain the plant N uptake, as well as the fate of residual N in soil, it can be affected by either higher or lower rates of N fertilization (Zhang et al. Citation2022). This necessitates to evaluate an alternate approach for sustainable N management with regards to economic crop production and environmental compatibility. The sustainable N management index (SNMI), a composite N management approach that supports agricultural sustainability has been proposed for optimum N management focusing on crop yield and N input across geographic locations (Zhang et al. Citation2022). To date, limited studies have been conducted for N optimization with higher efficiency when considering NUE and SNMI of crops (Zhang et al. Citation2022).
The NUE metric assesses how effectively N is used by crops, in contrast, the SNMI integrates both NUE and land-use efficiency associated with crop production (Xin and Davidson Citation2019). These indices also indicate how much N is taken up by plants from both soil and chemical fertilizer, suggesting the occurrence of N mining. Under global climate change effects, the increasing agroecosystem disservices necessitate a reevaluation of N management with increased NUE for crop productivity. The SNMI has the advantage of considering both increasing the benefits of N for crop production and decreasing the expenses associated with the environmental fates of N (Zhang et al. Citation2022).
Under climate-smart agriculture, crop residue, as a biological primer, is expected to have positive effects on soil health, N uptake, and crop yield, and therefore may have potential to improve NUE of crops (Kader et al. Citation2022). However, residue burning for improving disease control and cropping, which accelerates edge-of-field N loss, is very common in developing countries (Gupta and Sidhu Citation2009). Long-term intensive agricultural practices result in the deterioration of physical, chemical, and biological properties associated with soil health (Chen et al. Citation2014; Zhou and Wu Citation2015), which consequently affect crop yield and food quality (Steiner et al. Citation2007; Zoran et al. Citation2014). If managed proactively, the nutrient-enriched crop residue can improve microbial diversity and efficiency, increase C, and improve soil aggregate stability associated with soil health to support food security (Janzen and Kucey Citation1988; Blanco-Canqui Citation2013; Alam et al. Citation2020). Residue retention, in conjunction with N fertilization, has recently drawn increasing attention to improving agroecosystem services (Bell et al. Citation2018; Xiao et al. Citation2021). The Integrated Soil Fertility Management approach also acknowledges the advantages of integrating chemical fertilization and organic amendments to sustain nutrient management practices with improved agroecosystem services (Gentile et al. Citation2008).
Rice, potatoes and maize are three major staple food crops that require adequate N fertilization (Jahangir et al. Citation2022). Due to conventional N management practices, the NUE of these crops are low, such as 33% for maize, 40–50% for potato, and 25–35% for rice (Jahangir et al. Citation2022). It is reported that crop residue management increases N uptake by crops, and therefore increases crop yields which consequently influence the NUE (Huang et al. Citation2013; Zhang et al. Citation2022). While NUE describes the increase in crop N uptake against the applied N, it does not indicate the sustainability targets because higher NUE may also cause higher N depletion from the soils while lower NUE suggests environmental pollution. In addition, the conventional NUE is estimated based on a control-based experiment where N uptake from the N-control plot and N fertilized plots is assumed to be the same. However, using 15N isotope technology, past authors showed that N uptake from the control plot and from the fertilized plot may vary (Jing et al. Citation2020). Therefore, a composite N management approach is required to measure agricultural sustainability by accounting for agricultural production and environmental compatibility (Zhang et al. Citation2022). A viable alternative to open-field hazardous burning of crop residue would be proactive crop residue management to improve NUE of crops (Huang et al. Citation2013). There are limited available research investigating the effects of residue management when integrated with N fertilization on the NUE, SNMI, and crop yield to sustain agricultural productivity with increased environmental compatibility.
We hypothesized that residue interactions with N fertilization would improve N-use efficiency of crops across soils and agroecological zones. Our specific objectives were to: (i) determine the effects of residue retention coupled with N fertilization on NUE, SNMI, and yield of potato, maize, and rice; (ii) evaluate maximum crop yield, N uptake, N requirement for per unit of yield production, and optimum N fertilization for diverse cropping systems; and (iii) assess the current N management indices with respect to the global SNMI to address zero hunger.
Materials and methods
Experimental site description
On-farm experiments were established under contrasting soils and agroclimatic zones with a range of cropping intensity (from two to four crops in a sequence per year) in the floodplain soils of Bangladesh ().
Figure 1. Three different experimental sites (a) Sherpur, Bogura (b) Chandina, Cumilla and (c) Muktagacha, Mymensingh. Cropping patterns were potato-winter rice-pre-monsoon rice-monsoon rice at the Bogura site; winter rice-pre-monsoon rice-monsoon at the Cumilla site; and maize-monsoon rice in Muktagacha, Mymensingh.
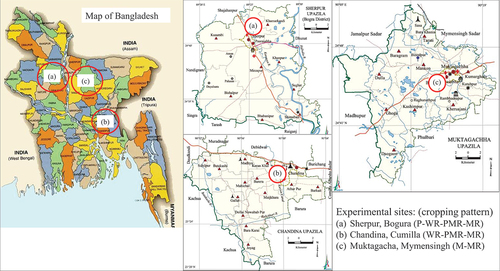
The Mymensingh site is located in Agro-ecological Zone 28, which is comprised of Madhupur Tract loam soil (Eutric Gleysols) and contains 49% sand, 40% silt, and 11% clay, and has a bulk density (Bd) of 1.2 g cm−3, pH of 5.3, total organic carbon (OC) of 8.12 g kg−1, total N (TN) of 0.73 g kg−1, available phosphorus (AP) of 5.9 mg kg−1, exchangeable potassium (EK) of 43 mg kg−1, and available sulfur (AS) of 12.8 mg kg−1.
The Bogura site with a Grey Karatoya Bengali Floodplain soil (Aeric Haplaquept) is located in Agro-ecological Zone 4, which contains 32% sand, 53% silt, and 15% clay, with a Bd of 1.26 g cm−3, pH of 5.5, total OC of 8.1 g kg−1, TN of 1 g kg−1, AP of 55.5 mg kg−1, EK of 46.9 mg kg−1, and AS of 16.4 mg kg−1.
The Cumilla site comprised of Meghna Estuarine Floodplain silt loam soil (Aeric Haplaquept) situated in Agro-ecological Zone 19 and contains 15% sand, 73% silt, and 13% clay, with a Bd of 1.32 g cm−3, pH of 6.3, total OC of 10.3 g kg−1, TN of 1.1 g kg−1, AP of 56.9 mg kg−1, EK of 58.7 mg kg−1, and AS of 16.3 mg kg−1.
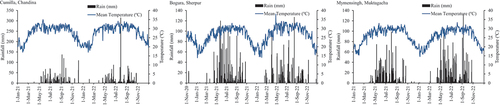
All the sites are under sub-tropical climatic conditions. The mean annual temperatures were 27 °C in Cumilla, and 26 °C in both Bogura and Mymensingh. Additionally, the mean annual precipitation was 2030, 2138 and 2180 mm in Cumilla, Bogura and Mymensingh, respectively. Mean daily temperature and rainfall data are presented in .
Figure 2. Weather data of Sherpur of Bogura, Chandina of Cumilla, and Muktagacha of Mymensingh (2020–21 and 2021–22). The line graph shows maximum and minimum temperature (red; maximum, blue; minimum) with secondary axis and column graph represents the rainfall (mm) in primary axis.
Experimental design
A 2 × 4 (2 crop residue × 4 fertilizer rate) split-plot experiment in randomized complete design with three replications per treatment combination was conducted simultaneously during two consecutive years of 2020–21 and 2021–22 cropping seasons at all sites. Two residue levels, no residue (NR) and retention of residues from the previous crops (30 cm residue by height for rice and maize and the whole residues for potatoes; CR) were assigned in the main plots. Within the main plot, four N fertilization rates were assigned as control (CL), farmers’ practice (FP), recommended N dose (RD), and 125% of RD (1.25 RD) in the sub-plots.
Depending on the existing land and flooding conditions, an annual sequence of four (potato – winter rice – pre monsoon rice – monsoon rice), three (winter rice – pre monsoon rice – monsoon rice), and two crops (maize – monsoon rice) were grown at the Bogura, Cumilla, and Mymensingh sites, respectively. The selected crops were potato, cultivated during October to February; transplanted winter rice, cultivated during February to May; transplanted pre-monsoon rice, cultivated during May to July; and transplanted monsoon rice, cultivated during July to October.
For potatoes, N fertilization was performed at a rate of 0 (CL), 138 (FP), 135 (RD), and 169 (1.25-RD) kg ha−1; for winter rice, 0 (CL), 120 (FP), 150 (RD), and 187 (1.25 RD) kg N ha−1 were applied; compared to 0 (CL), 77 (FP), 74 (RD, and 92 (1.25 RD) g N ha−1 applied in pre-rice. In contrast, 0 (CL), 98 (FP), 90 (RD), and 122 (1.25 RD) kg N ha−1 were applied in monsoon rice. Maize received 0 (CL), 152 (FP), 225 (RD), and 281 (1.25 RD) kg N ha−1. While FP rates were assessed (n = 60) from a structured survey through key informant interviews, the RD rates were based on national fertilizer recommendations (FRG Citation2018).
Agricultural management practices
The N, phosphorus (P), potassium (K), sulfur (S), magnesium (Mg), zinc (Zn), and boron (B) fertilizer sources were urea, triple super phosphate (TSP), muriate of potash (MoP), gypsum, magnesium sulphate, zinc sulphate, and boric acid, respectively. During the final land preparation by ploughing and cross ploughing followed by levelling by a ladder, the P, K, S, Mg, Zn, and B fertilizer were incorporated into the soil as basal application following the fertilizer recommendation guide (FRG Citation2018). For maize, the N fertilizer was applied in three equal splits at 15, 35, and 55 days after seed sowing, while for potatoes, it was applied in two equal splits at 15 and 35 days after planting. For winter rice, N was applied at 12, 37, and 57 days after seedlings transplantation. In contrast, N fertilizer was applied at 12 and 38 days in pre-monsoon and 12, 27, and 35 days in monsoon rice after seedlings transplantation.
Potato (Diamont cv.) and maize (BARI hybrid maize-14) seeds were planted/sown at the rate of 2 and 30 kg ha−1, respectively. The seed-to-seed distance in each line of maize seeds was 30 cm, and the lines were spaced 60 cm apart. Potato seeds were sown on ridges at 60 cm spacing and 20 cm apart. Winter rice, pre-monsoon rice, and monsoon rice were transplanted at the rate of 40 kg ha−1 with a 20 cm spacing. The BRRI-49, BINA-19, BRRI-71 cultivars were used in winter rice, pre-monsoon rice, and monsoon rice, respectively, at all sites. Three days prior to final land preparation, the field was sprayed with non-selective herbicide glyphosate (Round up®) at a rate of 1.85 kg ha−1. Furthermore, Pretilachlor (Superhit®), a post-emergence herbicide, was applied at a rate of 450 g ha−1 seven days after rice seedlings transplantation. When necessary, Brifer 5 G and Cidial 5 G (ACI® Bangladesh Ltd.) were implemented.
Soil and plant analysis
Composite soils at 0–15 cm depth from all sites were collected for physical and chemical analyses prior to establishing the experiment. After air-drying, the soils were ground with a porcelain mortar and pestle and passed through a 2 mm sieve. Soil pH was determined (dry soil:water, 1:2.5) by a glass electrode pH meter (Hanna® Bench Top pH Meter HI-2211). Soil total N was determined using the micro-Kjeldahl digestion and method (Fewcett Citation1954). Soil total organic carbon (SOC) was measured by the wet oxidation (chromic acid) method (Walkley and Black Citation1934). Available P in soils was determined spectrophotometrically (Olsen et al. Citation1954). Flame photometry was used to determine exchangeable K (Yuan Citation1983). Available S in soils was measured spectrophotometrically (Williams and Steinbergs Citation1959). Soil bulk density was determined by the standard core (a metal ring with 5 cm inner diameter and 5 cm height) method (Blake and Hartge Citation1986). Soil particle size analysis was performed by standard Bouyoucos hydrometer method after oxidizing the soil organic matter with 5% H2O2, followed by overnight dispersion with 10% Na-hexametaphosphate solution (Gee and Bauder Citation1979).
To determine the N content (%), plant samples (tuber, grain, leaf, and stem of potato; grain and straw of rice and maize) were oven-dried for 24 hours at 65 °C followed by H2SO4 + HClO4 (2:1) digestion (Nelson and Sommers Citation1973). Thereafter, the N concentrations were determined by the micro-Kjeldahl method (Jackson Citation1973), and the plant N uptake was determined at oven-dry equivalent basis and calculated following the Equation 1.
Crop yield and N-use efficiency
For all rice crops, a 4 m2 area in the middle of each replicated plot was harvested. For maize, a 2 m2 area was harvested. Yield of winter rice, pre-monsoon, monsoon, potato and maize was calculated in a dry-matter basis, and tuber yield of potatoes was estimated using the method described by Akter et al. (Citation2023). The Equation 2 was used to calculate the NUE (Moll et al. Citation1982).
Here, N uptake (kg N ha−1) was calculated as per the Equation 1.
According to Pythagorean’s Theorem for finding a triangle’s hypotenuse, the mathematical definition of SNMI is as follows (EquationEquation 3(3)
(3) ) (Xin and Davidson Citation2019). The definition of SNMI based on normalized (NUE*) and N yield (NYield*).
Here, NYiled* was calculated from the EquationEquation 4(4)
(4) or 5. if NYield ≤ NYieldref ; then.
Here, NYieldref = 90 kg ha−1yr−1 (Xin and Davidson Citation2019); and if NUE ≤ NUEref; then NUE* was estimated from EquationEquation 6(6)
(6) . In this experiment, it was NUE ≤ NUEref.
Kg N Mg−1 yield was calculated as the EquationEquation 7(7)
(7) , where kg N Mg−1 yield represents the requirement of N (kg) to produce 1 Mg yield.
Nitrogen optimization
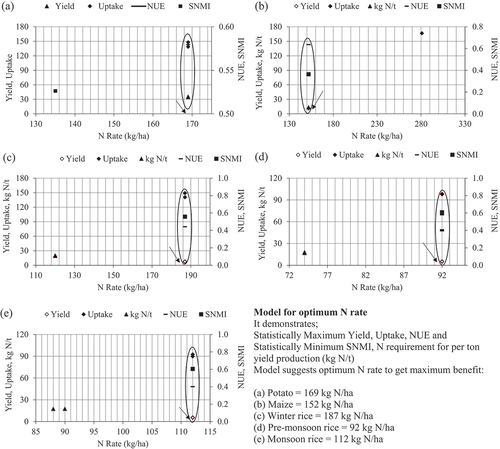
A simple estimation of statistically higher values of NUE, grain yield, kg N Mg−1 of yield, and minimum SNMI was taken into account and positioned on an Excel scatter X, Y plot against N rate, where minimum N rate was considered for all types of crops in order to develop the model to achieve the optimal N rate () (Quemada et al. Citation2020). Data from Bogura and Mymensingh sites over the past two years were utilized for model development for potatoes (n = 48) and maize (n = 48), respectively. However, for the winter rice and pre-monsoon rice, the mean values of two years of data from two locations (n = 96) (Bogura and Cumilla) were considered, while for the monsoon rice model, the mean values of two years data from three sites (n = 144) (Bogura, Cumilla, and Mymensingh) were utilized.
Figure 3. Nitrogen use efficiency model (NUE, SNMI), yield, N uptake, and kg N Mg−1 yield comparison and determining the ideal N rate and demonstrated by the arrow (↓) symbol, where (a), (b), (c), (d) and (e) represents the potato, maize, winter rice, pre-monsoon, and monsoon rice respectively.
Statistical analysis
A two-way analysis of variance (ANOVA) was performed using residue management and N fertilization as fixed independent factors. The data distribution for normality (Shapiro-Wilk test) was performed before the ANOVA procedure. The data were statistically examined to find out the variations between residue management and N fertilization rates individuals and interactive effects. The Tukey-Kramer Multiple Comparisons Test was used in post-hoc analyses to distinguish the significant differences among main and sub-plots variations and their interactions at p ≤ 0.05, unless otherwise mentioned. Data were analyzed separately for each crop in the rotation for individual sites. All the statistical analyses were performed using Statistix-10® and the graphic illustrations were created using Microsoft Excel-2019.
Results
Residue and nitrogen effects on crop yield
Irrespective of crops and sites, crop yields significantly increased with an increase in N fertilization (p < 0.001) (); however, the effect of residue alone and its interaction with N fertilizer on crop yield was non-significant (). The N fertilization, except control, had similar yields among potato, maize, pre-monsoon rice, and monsoon rice at all sites except Mymensingh, where the 1.25 RD treatment showed 15% higher monsoon rice yield than the FP and RD treatments. Likewise, the 1.25 RD treatment showed higher grain yield for winter rice in both years, where 1.25 RD had 14–18% and 20–30% higher yield than the current RD and FP treatments, respectively.
Table 1. Crop residue, N fertilizer, and their interaction effect on potato, winter rice, pre-monsoon rice, monsoon rice, and maize yield (Mg ha−1) in Bogura, Cumilla, and Mymensingh, 2020–21 and 2021–22.
Residue and nitrogen effects on nitrogen management indices
In winter rice, the interaction of residue and N fertilization significantly influenced the NUE and SNMI of crops in the first year at both sites, whereas the effect of residue was significant only in the second year (p < 0.05) (). The NUE was 21 and 18% higher in the CR x 1.25 RD treatments in Mymensingh, when compared to the NR x 1.25 RD in Bogura and Cumilla sites, respectively. Likewise, the SNMI was 15 and 12% lower. In contrast, the individual effect of residue significantly influenced the NUE and SNMI in the second year (p < 0.05) at both locations, when the NUE increased by 13–20% but the SNMI decreased by 8–11% with the integration of residue retention ().
Table 2. Crop residue, N fertilizer and their interaction effect on NUE and SNMI in winter and pre-monsoon rice in Bogura and Cumilla, 2020–21, 2021–22.
While the N fertilization significantly influenced both NUE and SNMI in pre-monsoon rice at the Bogura site in both years, the 1.25 RD exhibited the statistically higher NUE (0.41 in 2020–21 vs. 0.39 in 2021–22), which was 8 and 34% higher than the RD and FP, respectively. On the other hand, the 1.25 RD resulted in the lower SNMI during two consecutive years, resulting in a 5 and 14% decrease compared to the RD and FP, respectively (). At the Cumilla site, the NUE and SNMI indices were significantly influenced by N fertilization in the first year, while the interaction of residue and N fertilizer was significant in the second year. The 1.25 RD demonstrated 16–17% higher NUE than that of the RD, while the SNMI was reduced by 18–21% in the first year. The CR x RD combination resulted in a 25% decrease in SNMI compared to the NR x RD combination in the second year ().
In monsoon rice, the interaction of residue and N fertilization was significant for the NUE at the Bogura site (p < 0.05), where CR x FP combination demonstrated 17% higher NUE than the NR x FP treatment (). In Cumilla, individual effect of residue and N fertilization was significant on NUE in the second year but had effects on SNMI in both years. Both RD and 1.25 RD had statistically identical NUE, and 1.25 RD resulted in 26% higher NUE than the FP. Compared to the NR, the CR showed a 12% higher NUE. On the contrary, the SNMI was reduced by 10% in the CR than in the NR, and the 1.25 RD decreased the SNMI by 9 and 13% compared to the FP and RD, respectively ().
Table 3. Crop residue, N fertilizer and their interaction effect on NUE and SNMI in monsoon rice in Bogura, Cumilla and Mymensingh, 2020–21, 2021–22.
In Mymensingh, the NUE of crops was significantly influenced by N fertilization in both years, where the RD and 1.25 RD shared an identical NUE in the second year, and showed 13 and 16% higher NUE, respectively, when compared to the FP. Likewise, the effect of N fertilization was significant on the SNMI in the second year, where both 1.25 RD and RD showed similar SNMI, and reduced by 13 and 9%, respectively, than the FP ().
For potato, residue retention had a significant influence on NUE in both years, but on SNMI in the second year (p < 0.05). The NUE increased by 12–19% with residue retention. The 1.25 RD demonstrated a 4% higher NUE than the FP. The SNMI, in contrast, was 12% lower in the CR x RD than in the NR x RD during the 2020–21 cropping season ().
Table 4. Crop residue, N fertilizer and their interaction effect on NUE and SNMI in potato and maize in Bogura and Mymensingh, respectively, 2020–21, 2021–22.
The interaction of residue and N fertilization was significant on the NUE and SNMI indices of maize in the first year (p < 0.01), the individual effect of residue (p < 0.05) and N fertilization (p < 0.001) significantly influenced both the NUE and SNMI in the second year. The NUE increased by 10–20% with the integration of residue, while decreasing with the increasing N fertilization, with 1.25 RD exhibiting 12 and 18% reduced NUE than the RD and FP, respectively. The NUE of CR x RD in the first year was 4% higher than the NR x RD ().
Modeling of nitrogen-use efficiency
Averaged across cropping seasons, the increased NUE (0.57), tuber yield (35.5 Mg ha−1), and N uptake (147.9 kg N ha−1) were achieved when N fertilization at 169 kg ha−1 was combined with CR in potato ().
For maize, N fertilization, at a rate of 152 kg ha−1 (FP) in combination with CR yielded statistically higher NUE (0.59), grain yield (11.4 Mg ha−1), and the minimum 13.5 kg N Mg−1 yield requirement with the lowest SNMI (0.41), pertaining to the maximum N efficiency indices (). In contrast, the 187 kg N ha−1 coupled with CR showed the statistically higher NUE (0.45), grain yield (7.6 Mg ha−1), and N uptake (149.1 kg N ha−1) with the lower SNMI (0.55) of winter rice. This implies that 187 kg N ha−1 coupled with CR is the optimum N rate expected to obtain highest NUE of winter rice (). In pre-monsoon rice, 92 kg N ha−1 produced the statistically higher NUE (0.45), grain yield (5.3 Mg ha−1), and N uptake (98.3 kg ha−1) with the lowest SNMI (0.55), therefore implying that 92 kg N ha−1 with CR integration in combination for pre-monsoon rice (). Likewise, for monsoon rice, 112 kg N ha−1 in combination with CR had the statistically highest NUE (0.41), grain yield (5.5 Mg ha−1), and N uptake (92.5 kg ha−1), where the SNMI (0.6) was its lowest, indicating that 112 kg N ha−1 is the most appropriate rate to obtain the higher N-use efficiency for growing monsoon rice ().
Discussion
Changes in crop yield
Our results implied that N fertilization significantly increased crop yields; however, a reduced potato yield in the second year, when compared to the first, was associated with varietal differences. It is expected that residue incorporation enhances soil quality by increasing easily decomposable organic carbon to soil microorganisms to improve their metabolic efficiency and diversity (Smith et al. Citation1992; Hadas et al. Citation2004; Singh and Rengel Citation2007), improves soil structural stability and water-holding capacity, and supports crop productivity (Singh and Rengel Citation2007; Halder et al. Citation2023).
While N is the most critical essential nutrient required by the plants (Bernard and Habash Citation2009; Wang et al. Citation2021); the FP, RD, and 1.25 RD treatments did not consistently increase maize yield with N fertilization, indicating a lack of optimum N or partial availability of applied N to achieve the highest grain yield. In contrast, higher rice yields in response to RD and 1.25 RD treatments were due to greater N availability for rice growth. Several research studies have sought to rationalize N fertilization of rice (Qi-Chun and Guang-Huo Citation2002; Dai et al. Citation2003; Lassaletta et al. Citation2014). Adhikari et al. (Citation2021) reported that the highest rice yield was observed due to RD and 1.25 RD treatments, which is very analogous to the results of our study. Chemical fertilization can alone result in higher crop yield, which, in contrast, inherently reduces soil fertility. That could be the possible rationale of identical yields of 1.25 RD and RD, respectively.
N-use efficiency of crops
A significant increase in the NUE of crops by residue integration was observed in potato, maize, and winter and pre-monsoon rice at all sites, and can be associated with the mulching effect of residue retention to preserve soil moisture followed by the release of nutrients, especially N and labile C, from decomposing residues (Joern and Vitosh Citation1995; Scopel et al. Citation2004). The formation of ammonium compounds from the urea hydrolysis and decomposing residues may prolong the residence time of NH4+ for NO3− in the soil (Huang et al. Citation2009; Lu et al. Citation2015). Growing crops subsequently uptake these available N (NH4+ and NO3−) compounds, thus increasing the NUE of crops (Panuccio et al. Citation2001). It is suggested that residue management can lead to reduced N fertilization. Higher NUE in residue treated plots were likely due to the N addition from the incorporated reissues which incraesed the organic N contents in soils and N uptake from the native soil organic matter resulting in an increase in the NUE. Another explanation for this disparate result is the NUE of crop is more likely to be a genetic, physiological, environmental, and agronomic parameter than the N fertilization alone (Congreves et al. Citation2021).
With increasing N fertilization, the NUE of maize decreased, which may be associated with increased vegetative growth compared to the grain formation. Lower rates of N fertilization are expected to result in higher NUE of C4 plants (for maize: NUE in FP > RD > 1.25 RD) than that of the C3 plants, which is identical to our results (Sage and Pearcy Citation1987), The C4 plants, like maize, are more efficient in photosynthesis than the C3 rice, which require extra energy to fix CO2 into 4 carbon molecules before entering the Calvin cycle (Burgess and Wang Citation2022), and thereby require more N for higher energy expenditure C4 photosynthetic pathway. Therefore, it is possible that maize utilized lower N rates more efficiently than higher rates of N fertilization. Accordingly, maize with higher N fertilization have experienced a lower NUE of crops due to the lack of optimum N fertilization.
The effect of N fertilization was significant on NUE of winter, pre-monsoon, monsoon rice, maize and potato for at least one year at each location. It is expected that the NUE of crops may decline if the N uptake by crops does not increase proportionately to the amount of N application. Rice may have a greater N fertilization boundary limit for simultaneously improving NUE than the maize, hence, the highest NUE was recorded in 1.25 RD and FP for rice and maize, respectively. It is reported that the NUE increased with increasing N fertilization in the sandy soils (Ye et al. Citation2007), which is analogous to the NUE of monsoon rice observed at Mymensingh. In other soils, the NUE of crops showed a non-linear response to N fertilization (Ye et al. Citation2007), which might be identical to our results on monsoon rice grown at the Cumilla site.
Sustainable N management index
Sustainable N management of crops is one of the critical challenges to address global food security. The SNMI of 0 is the long-term goal for this indicator to grow major agronomic crops worldwide (Zhang et al. Citation2022). Our results have shown that residue management combined with optimum N fertilization significantly decreased the SNMI. The mean SNMI (averaged across types, site, and year) was achieved by 0.62 for rice, 0.48 for potatoes, and 0.51 for maize, respectively. As per our data, current SNMI across sites and crop is 0.59, which is lower than Bangladesh’s current SNMI (0.67).
Based on computation of the statistical trend over time (2000–15), the SNMI should be 0.49 in 2023, which suggests Bangladesh’s current SNMI is 10 years behind (2013) what the SNMI is supposed to be in 2023, considering universal reference yield 90 kg N ha−1. Our data shows that the present SNMI is 12% lower than it was in 2015, when it was accomplished by boosting yield without improving the NUE of crops (Zhang et al. Citation2022).
Our results suggested that residue management is contributing to lower SNMI by 7% over a period of two years (NR SNMI: 0.61 vs. CR SNMI: 0.57), whereas the overall national progress was 12% during the past 7 years. Thus, integrating residue management to the agroecosystem is expected to contribute to ensure global food security to address the zero-hunger target.
Conclusions
N fertilization increased crop yields where increasing N rate by 25% from the recommended rate variably increased winter rice yields at all sites. The pre-monsoon and monsoon rice had optimum yields with the current recommended N rate. However, the NUE of crops did not change with N fertilization at all rice seasons, indicating that both winter rice and monsoon rice can benefit from an extra 25% N fertilization. Residue management alone increased NUE by 12–19% in potato, 10% in maize, and 13–20% in winter rice. While N fertilization increased the NUE of potato, the opposite happened for maize. Based on our model, the potential N fertilization rates were 169, 152, 187, 92, and 112 kg N ha−1 for potato, maize, winter rice, pre-monsoon rice, and monsoon rice, respectively to attain maximum NUE of crops. Despite the SNMI values corresponding very well to the NUE, it represents crop yields, N uptake, N required against a unit crop yield, and the environmental impact far better than the NUE, suggesting SNMI for crops can be a better tool for N management.
Acknowledgments
The authors sincerely thank to Mr. Bradford Sherman at The Ohio State University for his assistance in editing this manuscript for English grammar and use.
Disclosure statement
No potential conflict of interest was reported by the author(s).
Additional information
Funding
References
- Adhikari B, Poudel A, Kafle K, Yadav SK, Gelal R, Oli B. 2021. Effect of different fertilizer doses on the production of Chaite-5 paddy variety in Dhanusha District, Nepal. AAES. 6(4):528–534. doi: 10.26832/24566632.2021.0604015.
- Akter S, Kamruzzaman M, Khan MZ, Amin MS. 2023. Enhanced potassium fertilization improved rice (Oryza sativa) yield and nutrient uptake in coastal saline soil of Bangladesh. J Soil Sci Plant Nutr. 23(2):1884–1895. doi: 10.1007/s42729-023-01144-3.
- Alam MK, Bell RW, Haque ME, Islam MA, Kader MA. 2020. Soil nitrogen storage and availability to crops are increased by conservation agriculture practices in rice-based cropping systems in the Eastern Gangetic Plains. Field Crops Res. 250:107764. doi: 10.1016/j.fcr.2020.107764.
- Bell RW, Haque ME, Jahiruddin M, Rahman MM, Begum M, Miah MM, Islam MA, Hossen MA, Salahin N, Zahan T. 2018. Conservation agriculture for rice-based intensive cropping by smallholders in the eastern Gangetic plain. Agriculture. 9(1):5. doi: 10.3390/agriculture9010005.
- Bernard SM, Habash DZ. 2009. The importance of cytosolic glutamine synthetase in nitrogen assimilation and recycling. New Phytol. 182(3):608–620. doi: 10.1111/j.1469-8137.2009.02823.x.
- Blake GR, Hartge KH. 1986. Bulk density. In: Klute A, editor, Methods of soil analysis: part 1 physical and mineralogical methods. Vol. 5. pp. 363–375. URL. doi: 10.2136/sssabookser5.1.2ed.c13
- Blanco-Canqui H. 2013. Crop residue removal for bioenergy reduces soil carbon pools: how can we offset carbon losses? Bioenerg Res. 6(1):358–371. doi: 10.1007/s12155-012-9221-3.
- Burgess AJ, Wang P. 2022. Not all Calvin’s are equal: differential control of the Calvin cycle in C3 versus C4 plants. Plant Physiology. 191(2):817–819. doi: 10.1093/plphys/kiac531.
- Chen B, Liu E, Tian Q, Yan C, Zhang Y. 2014. Soil nitrogen dynamics and crop residues. A review. Agron Sustain Dev. 34(2):429–442. doi: 10.1007/s13593-014-0207-8.
- Congreves KA, Otchere O, Ferland D, Farzadfar S, Williams S, Arcand MM. 2021. Nitrogen use efficiency definitions of today and tomorrow. Front Plant Sci. 12:637108. doi: 10.3389/fpls.2021.637108.
- Dai PA, Nie J, Zheng SX, Xiao J. 2003. Efficiency of nutrient utilization of controlled-release nitrogen fertilizer for rice at different soil fertility levels. Chin J Soil Sci. 34:115–119.
- Erisman JW. 2021. How ammonia feeds and pollutes the world. Sci. 374(6568):685–686. doi: 10.1126/science.abm3492.
- FAO. 2018. The future of food and agriculture—alternative pathways to 2050. https://www.fao.org/3/CA1553EN/ca1553en.pdf.
- Fewcett JK. 1954. The semi-micro Kjeldahl method for the determination of nitrogen. J Med Lab Technol. 12(1):1–22.
- FRG. 2018. Fertilizer recommendation guide, Bangladesh Agricultural Research Council (BARC). Dhaka: Farmgate.
- Gee GW, Bauder JW. 1979. Particle size analysis by hydrometer: a simplified method for routine textural analysis and a sensitivity test of measurement parameters. Soil Sci Soc Am J. 43(5):1004–1007. doi: 10.2136/sssaj1979.03615995004300050038x.
- Gentile R, Vanlauwe B, Chivenge P, Six J. 2008. Interactive effects from combining fertilizer and organic residue inputs on nitrogen transformations. Soil Biol Biochem. 40(9):2375–2384. doi: 10.1016/j.soilbio.2008.05.018.
- Gupta RK, Sidhu HS. 2009. Nitrogen and residue management effects on agronomic productivity and nitrogen use efficiency in rice–wheat system in Indian Punjab. Nutr Cycl Agroecosyst. 84(2):141–154. doi: 10.1007/s10705-008-9233-8.
- Hadas A, Kautsky L, Goek M, Kara EE. 2004. Rates of decomposition of plant residues and available nitrogen in soil, related to residue composition through simulation of carbon and nitrogen turnover. Soil Biol Biochem. 36(2):255–266. doi: 10.1016/j.soilbio.2003.09.012.
- Halder M, Ahmad SJ, Rahman T, Joardar JC, Siddique MAB, Islam MS, Islam MU, Liu S, Rabbi S, Peng X. 2023. Effects of straw incorporation and straw-burning on aggregate stability and soil organic carbon in a clay soil of Bangladesh. Geoderma Regional. 32:e00620. doi: 10.1016/j.geodrs.2023.e00620.
- Huang PM, Hardie AG. 2009. Formation mechanisms of humic substances in the environment. In: Nicola S, editor. Biophysico-chemical processes involving natural nonliving organic matter in environmental systems. Washington: Wiley and Sons Inc; p. 41–109.
- Huang S, Zeng Y, Wu J, Shi Q, Pan X. 2013. Effect of crop residue retention on rice yield in China: a meta-analysis. Field Crops Res. 154:188–194. doi: 10.1016/j.fcr.2013.08.013.
- Jackson ML. 1973. Soil chemical analysis. Vol. 498. New Delhi, India: Pentice Hall of India Pvt Ltd; pp. 151–154.
- Jahangir MMR, Rahman S, Uddin S, Mumu NJ, Biswas C, Jahiruddin M, Müller C, Zaman M. 2022. Crop residue interactions with fertilizer rate enhances volatilization loss and reduces nitrogen use efficiency in irrigated maize and potato. Arch Agron Soil Sci. 69(10):1833–1845.
- Jan WE, James G, Mark AS, Zbigniew K, Winiwarter W. 2008. How a century of ammonia synthesis inferences the world. Nature Geosciences. 1:636–639. doi: 10.1038/ngeo325.
- Janzen HH, Kucey RMN. 1988. C, N, and S mineralization of crop residues as influenced by crop species and nutrient regime. Plant Soil. 106(1):35–41. doi: 10.1007/BF02371192.
- Jing B, Niu N, Zhang W, Wang J, Diao M. 2020. 15N tracer-based analysis of fertiliser nitrogen accumulation, utilization and distribution in processing tomato at different growth stages. Acta Agriculturae Scandinavica Soil Plant Sci. 70(8):620–627. doi: 10.1080/09064710.2020.1825786.
- Joern BC, Vitosh ML. 1995. Influence of applied nitrogen on potato part I: yield, quality, and nitrogen uptake. Am Potato J. 72(1):51–63. doi: 10.1007/BF02874379.
- Kader MA, Jahangir MMR, Islam MR, Begum R, Nasreen SS, Islam MR, Mahmud AA, Haque ME, Bell RW, Jahiruddin M. 2022. Long-term conservation agriculture increases nitrogen use efficiency by crops, land equivalent ratio and soil carbon stock in a subtropical rice-based cropping system. Field Crop Research. 287:108636. doi: 10.1016/j.fcr.2022.108636.
- Lassaletta L, Billen G, Grizzetti B, Anglade J, Garnier J. 2014. 50-year trends in nitrogen use efficiency of world cropping systems: the relationship between yield and nitrogen input to cropland. Environ Res Lett. 9:105011. doi: 10.1088/1748-9326/9/10/105011.
- Lu W, Zhang H, Min J, Shi W. 2015. Dissimilatory nitrate reduction to ammonium in a soil under greenhouse vegetable cultivation as affected by organic amendments. J Soils Sediments. 15(5):1169–1177. doi: 10.1007/s11368-015-1089-3.
- Menegat S, Ledo A, Tirado R. 2022. Greenhouse gas emissions from global production and use of nitrogen synthetic fertilisers in agriculture. Sci Rep. 12(14490). doi: 10.1038/s41598-022-18773-w.
- Moll RH, Kamprath EJ, Jackson WA. 1982. Analysis and interpretation of factors which contribute to efficiency of nitrogen utilization 1. Agron J. 74(3):562–564. doi: 10.2134/agronj1982.00021962007400030037x.
- Nelson DW, Sommers LE. 1973. Determination of total nitrogen in plant material 1. Agron J. 65(1):109–112. doi: 10.2134/agronj1973.00021962006500010033x.
- Olsen SR, Cole CV, Watanabe FS, Dean LA. 1954. Estimation of available phosphorus in soils by extraction with sodium bicarbonate. USDA circular 939. Washington, DC, USA: USDA.
- Panuccio MR, Muscolo A, Nardi S. 2001. Effect of humic substances on nitrogen uptake and assimilation in two species of Pinus. J Plant Nutr. 24(4–5):693–704. doi: 10.1081/PLN-100103663.
- Pituello C, Polese R, Morari F, Berti A. 2016. Outcomes from a long-term study on crop residue effects on plant yield and nitrogen use efficiency in contrasting soils. Eur J Agron. 77:179–187. doi: 10.1016/j.eja.2015.11.027.
- Qi-Chun Z, Guang-Huo W. 2002. Optimal nitrogen application for direct-seeding early rice. Chinese Jof Rice Sci. 16:346.
- Quemada M, Lassaletta L, Jensen LS, Godinot O, Brentrup F, Buckley C, Foray S, Hvid SK, Oenema J, Richards KG. 2020. Exploring nitrogen indicators of farm performance among farm types across several European case studies. Agric Syst. 177:102689. doi: 10.1016/j.agsy.2019.102689.
- Sage RF, Pearcy RW. 1987. The nitrogen use efficiency of C3 and C4 plants: I. Leaf nitrogen, growth, and biomass partitioning in (Chenopodium album L.) and Amaranthus retroflexus (L.). Plant Physiol. 84:954–958. doi: 10.1104/pp.84.3.954.
- Schauberger G, Piringer M, Mikovits C, Zollitsch W, Hörtenhuber SJ, Baumgartner J, Niebuhr K, Anders I, Andre K, Hennig-Pauka I. 2018. Impact of global warming on the odour and ammonia emissions of livestock buildings used for fattening pigs. Biosyst Eng. 175:106–114. doi: 10.1016/j.biosystemseng.2018.09.001.
- Scopel E, Da Silva FA, Corbeels M, Affholder F, Maraux F. 2004. Modelling crop residue mulching effects on water use and production of maize under semi-arid and humid tropical conditions. Agronomy. 24:383–395. doi: 10.1051/agro:2004029.
- Singh B, Rengel Z. 2007. The Role of Crop Residues in Improving Soil Fertility. In: Marschner P, Renzel Z, editors. Nutrient Cycling In Terrestrial Ecosystems. Heidelberg, Germany: Springer; p. 183–214.
- Smith JL, Papendick RI, Bezdicek DF, and Lynch JM.1992. Soil organic matter dynamics and crop residue management. In: Metting FBJr, editor. Soil Microbial Ecology: Applications In Agricultural And Environmental Management. New York: Marcel Dekker Inc; p. 65–94.
- Steiner C, Teixeira WG, Lehmann J, Nehls T, de Macêdo JLV, Blum WE, Zech W. 2007. Long-term effects of manure, charcoal and mineral fertilization on crop production and fertility on a highly weathered Central Amazonian upland soil. Plant Soil. 291:275–290. doi: 10.1007/s11104-007-9193-9.
- van Grinsven HJ, Bouwman L, Cassman KG, van Es HM, McCrackin ML, Beusen AH. 2015. Losses of ammonia and nitrate from agriculture and their effect on nitrogen recovery in the European Union and the United States between 1900 and 2050. J Environ Qual. 44(2):356–367. doi: 10.2134/jeq2014.03.0102.
- Walkley A, Black IA. 1934. An examination of the Degtjareff method for determining soil organic matter, and a proposed modification of the chromic acid titration method. Soil Sci. 37(1):29–38. doi: 10.1097/00010694-193401000-00003.
- Wang X, Wang K, Yin T, Zhao Y, Liu W, Shen Y, Ding Y, Tang S. 2021. Nitrogen fertilizer regulated grain storage protein synthesis and reduced chalkiness of rice under actual field warming. Front Plant Sci. 12:715436. doi: 10.3389/fpls.2021.715436.
- Williams CH, Steinbergs A. 1959. Soil sulfur fractions as chemical indices of available sulfur in some Australian soils. Aust J Agric Res. 10:231–242. doi: 10.1071/AR9590340.
- Xiao L, Kuhn NJ, Zhao R, Cao L. 2021. Net effects of conservation agriculture principles on sustainable land use: a synthesis. Glob Chang Biol. 27(24):6321–6330. doi: 10.1111/gcb.15906.
- Xin Z, and Davidson E. 2019. ESS Open Archive. Frostburg MD, USA: University of Maryland Center for Environmental Science. Report No. 12. doi: 10.1002/essoar.10501111.1.
- Ye Q, Zhang H, Wei H, Zhang Y, Wang B, Xia K, Huo Z, Dai Q, Xu K. 2007. Effects of nitrogen fertilizer on nitrogen use efficiency and yield of rice under different soil conditions. Front Agric China. 1(1):30–36. doi: 10.1007/s11703-007-0005-z.
- Yuan KN. 1983. Chemical analysis of plant nutrients in soil. Beijing, China: Science Press.
- Zhang X, Wang Y, Schulte-Uebbing L, De Vries W, Zou T, Davidson EA. 2022. Sustainable nitrogen management index: definition, global assessment and potential improvements. FASE. 9(3):356–365.
- Zhou X, Wu F. 2015. Changes in soil chemical characters and enzyme activities during continuous monocropping of cucumber (Cucumis sativus). Pak J Bot. 47:691–697.
- Zoran IS, Nikolaos K, Sunic L. 2014. Tomato fruit quality from organic and conventional production. In: Vytautas P, editor. Organic agriculture towards sustainability. London UK: InTechOpen; p. 284. doi: 10.5772/58239.