Abstract
This study investigates whether trends in the extent and depth of poverty in South Africa over the past decade have been gendered. We examine whether females are more likely to live in poor households than males and whether this has changed over time, and how poverty has changed for female-headed and male-headed households. We use data from the 1997 and 1999 October Household Surveys and the 2004 and 2006 General Household Surveys, which have the advantage of collecting information on the individual receipt of social grant income. We find that although poverty rates have fallen for both males and females, and for male-headed and female-headed households, the decline has been larger for males and for male-headed households. Gender differences in poverty rates have therefore widened over the period. We show that these findings are robust to the possible underestimation of household income and to adjustments for household composition.
1. Introduction
Poverty studies from a number of countries and regions, spurred on by the United Nations Development Programme's claim that 70% of the world's poor are women (UNDP, Citation1995), have investigated gendered trends in poverty over the past decade. In South Africa, amidst an ongoing debate over the nature of trends in overall poverty since the end of apartheid, several studies have either hypothesised (cf. Phalane, Citation2002; Bentley, Citation2004; Bhorat et al., Citation2006; Thurlow, Citation2006) or offered preliminary evidence of (Bhorat & Van der Westhuizen, Citation2008) a ‘feminisation’ of income poverty. Research has also documented a rise in female headship over the period (Bhorat et al., Citation2006), with female-headed households being over-represented among the poor (Posel, Citation1997; Leibbrandt & Woolard, Citation2001; Armstrong et al., Citation2008; Bhorat & Van der Westhuizen, Citation2008). Against this backdrop, several authors have suggested that post-apartheid economic policy may not have been successful in redressing gender differences in the burden of poverty (Taylor, Citation1997; Phalane, Citation2002; Thurlow, Citation2006).
To date, however, there has been no comprehensive study of gendered poverty trends in the post-apartheid period. This may be explained partly by the limited availability of comparable surveys, conducted at regular intervals, which collect comprehensive information on household income or expenditure. In this paper we analyse the income and expenditure data provided in two sets of nationally representative household surveys, which have been relatively under-utilised in poverty studies thus far: the 1997 and 1999 October Household Surveys and the 2004 and 2006 General Household Surveys (Stats SA, Citation1997, Citation1999, Citation2004, Citation2006). Although these surveys do not capture all sources of income received by households, they do consistently collect information on the individual receipt of both earned income and social grant income. We use these data to investigate whether trends in the extent and depth of poverty in South Africa over the past decade have been gendered. We also test the robustness of our findings to the possible underestimation of household income and to adjustments for household composition.
The paper is structured as follows. The next section summarises the existing body of literature on gender and poverty in South Africa. Section 3 discusses the data and methods that we use to investigate gendered trends in poverty. In Section 4 we present estimates of poverty trends by gender over the post-apartheid period and in Section 5 we evaluate the robustness of these trends. Section 6 concludes with a summary of the estimated changes in gendered poverty rates.
2. Review
The post-apartheid period has brought a number of developments which are likely to have increased women's access to resources. Since 1995, for example: women's share of employment has grown (Casale & Posel, Citation2002, Citation2005); the social security system has been expanded to include support for pensioners and the caregivers of children across all race groups; and progressive labour legislation, which includes the extension of minimum wages for domestic workers, has been introduced. Despite these positive developments, however, other changes suggest that women's relative access to resources may have worsened over the period. Gender analysts point to the disproportionate effects of the HIV/AIDS epidemic on women (Bentley, Citation2004; Schatz & Ogunmefun, Citation2007; Shisana et al., Citation2010), rising rates of unemployment among women (Casale & Posel, Citation2002; Casale, Citation2004), and a persistent gender gap in real earned income (Leibbrandt et al., Citation2005), together with an increasing proportion of informal and low-income workers who are women (Casale, Citation2004).
The literature on poverty in post-apartheid South Africa has paid little attention to the gendered nature of poverty. Rather, studies have focused on measuring aggregate trends in poverty and, given the legacy of apartheid, on changes disaggregated by race. Research suggests that until about 2000 income poverty rates remained relatively unchanged or even increased (Leibbrandt & Woolard, Citation2001; Bhorat & Kanbur, Citation2005; Hoogeveen & Özler, Citation2006; Leibbrandt et al., Citation2006; Seekings, Citation2007; Bhorat & Van der Westhuizen, Citation2008; Van der Berg et al., Citation2008; Yu, Citation2010). After 2000, and particularly in the period (post 2001) when government spending on social grants increased and the take-up of the child support grant expanded, studies identify that poverty rates began to fall (Meth, Citation2006; Bhorat & Van der Westhuizen, Citation2008; Van der Berg et al., Citation2008; Yu, Citation2010). There remains some disagreement, however, over the extent of this decline in poverty (Meth, Citation2006; Seekings, Citation2007; Van der Berg et al., Citation2008).
One of the main problems with measuring changes in poverty in the post-apartheid period is that comparable and comprehensive income or expenditure data have not been collected at regular intervals. The Population Censuses (1996 and 2001), conducted at long intervals, capture income in (inconsistent) bands and the income data may be biased by large numbers of zero-income households (Leibbrandt & Woolard, Citation2001). The Income and Expenditure Surveys (1995, 2000 and 2005) are also conducted at long intervals and changes in the survey methodologies between survey years compromise comparisons of the data (Stats SA, Citation2008; Van der Berg et al., Citation2008). The Labour Force Surveys (undertaken bi-annually from 2000 to 2007) provide a more regular source of data, but they collect information on the individual receipt only of earned income.
Measuring gendered changes in poverty brings the added difficulty of how to assign income across individuals in a household. In generating conventional estimates of income poverty, it is assumed that all household resources are shared equally among household members (or among adult equivalents). An individual is identified as being poor if he or she lives in a household in which average per capita (or per adult equivalent) income is below a poverty threshold. However, where resources are not shared equally among household members, then these poverty measures may conceal a gendered distribution of poverty within households. To explore the gendered nature of poverty further, studies from both developed and developing countries compare the economic well-being of female- and male-headed households. If household heads are the primary income earners in households, then an analysis of poverty based on the gender of the household head highlights the nature and implications of gender differences in access to resources.
The poverty literature, particularly in developing countries, suggests that female-headed households are often more vulnerable to poverty. Of 61 studies investigating the association between poverty and female-headed households in developing countries, summarised in Buvinic and Gupta Citation(1997), 38 found that female-headed households were over-represented among poor households, 15 found that poverty was associated with certain types of female-headed households, and only eight reported no association between female headship and poverty. Similarly, in the World Bank's poverty assessments, poverty rates were higher for female-headed than for male-headed households in 25 out of 58 countries. In a further 10 countries, certain types of female-headed households were poorer than male-headed households (Lampietti & Stalker, Citation2000).
Several South African studies have demonstrated that female-headed households are relatively disadvantaged in terms of income (Budlender, Citation1997; Posel, Citation2001) or are over-represented among the poor (Ray, Citation2000; Leibbrandt & Woolard, Citation2001; Bhorat & Van der Westhuizen, Citation2008). However, little research has been done on how the relative well-being of female-headed households has changed over time. The one exception is a study by Bhorat and Van der Westhuizen Citation(2008), using expenditure data from the 1995 and 2005 Income and Expenditure Surveys, which finds that although poverty rates fell for both female- and male-headed households, female-headed households became relatively more vulnerable to poverty over the period.
3. Data and methods
In this paper we investigate gendered poverty trends in post-apartheid South Africa in two ways. First, we examine how poverty rates for females and males have changed over the period. Second, we estimate whether the economic well-being of female-headed households has changed, relative to male-headed households.
We make use of data sources that have been under-utilised in analyses of poverty in the post-apartheid period. These include the 1997 and 1999 rounds of the October Household Survey (OHS) and the 2004 and 2006 rounds of the General Household Survey (GHS). Each of these surveys collects detailed information on earned income and, importantly, also on the individual receipt of social grants. Moreover, the questions used to capture income and expenditure data are similar across the surveys. In both the OHS and the GHS, the income module collects information on the individual's total pay or salary from his or her main job before deductions. Respondents are asked to provide point estimates for earned income, but if they are unable or unwilling to do so they are prompted to identify the appropriate band or bracket within which earned income falls. Nominal income bands are constant across the OHSs and GHSs. Where point estimates are not available and income is reported in bands, we estimate income using the midpoint of the reported income bracket.
Although questions on earned income are comparable across the OHSs and the GHSs, there are important differences between the 1997 OHS and the other surveys in the way that information on non-labour income is captured. First, the 1997 OHS asks questions about the value of income received from a wider variety of sources. In order to generate comparable estimates of income over time, only those income sources that are common across all the surveys are included in generating a measure of total household income. However, as we discuss in Section 5, we use the more comprehensive income information collected in the 1997 OHS to test the robustness of our findings to the possible underestimation of income.
Second, while all the surveys collect information on the individual receipt of social grants, only the 1997 OHS asks respondents to report the actual value of such income. In the 1999 OHS and in the GHSs, individuals are simply asked whether or not they received a specific social grant. For consistency across all the surveys, we derive a measure for social grant income in each survey by assigning the maximum value of the particular social grant to the grant recipient.Footnote1 Using this approach to measure social grant income makes our estimates of the extent of social grant spending largely comparable to those documented in official administrative records. Estimates from the 2004 GHS, for example, place the total annual value of social grants at approximately R43 billion. National Treasury Citation(2007) records show that the Department of Social Development spent a total of R44.8 billion on all social grants for the 2004/05 fiscal year. According to the 2006 GHS, total annual social grant spending is estimated at about R51.5 billion. In comparison, official records document spending at approximately R51.9 billion for the 2005/06 fiscal year and R56.9 billion for the 2006/07 fiscal year (National Treasury, Citation2007).
One of the advantages of the household survey data used in this study is that we can isolate the relative contributions of social grant income to household resources, ceteris paribus, and evaluate the poverty-reducing effects of these transfers. Nonetheless, an important problem remains. Because we have comparable data across the surveys only on earned income and social grants, all those households which rely on other sources of income (such as remittance transfers and private maintenance) would be identified as households with no income. In , the first two data rows describe the number and proportion of households for which no earnings or social grants are reported in the datasets which we analyse. These households include those where there are no employed household members, or where no employed household member reports positive earnings information, and where no household member reports receiving a social grant. Although there has been a considerable decline in ‘no-income’ households across the years, almost 15% of all households in the 2006 GHS do not report earnings from employment or grant income. To address this problem, we use information on household expenditure to augment household income in ‘no-income’ households.Footnote2
Table 1: Households without earnings or social grants, 1997–2006
Household expenditure is captured only through a single question, and it is therefore a relatively crude measure of economic status. However, it offers the means to approximate income, and particularly poverty status, in households which do not report earnings or grant income. shows that using expenditure as a proxy for income in households reduces the percentage of households with no income information to less than 2% in 1997, and in the following years, 1999, 2004 and 2006, the percentage of no-income households falls to 3.95%, 1.34% and 0.60% of all households, respectively.
In the poverty analysis, we estimate the overall incidence and depth of poverty and look specifically at how these have changed by gender and across female- and male-headed households over the specified period. The headcount and poverty gap ratios are measured using the normalised Foster–Greer–Thorbecke (FGT) index (Foster et al., Citation1984):
where n represents the population size, m is the number of people falling below the poverty line z, and y
i
represents the average per capita monthly household income of individual i. The FGT index identifies the headcount or poverty rate when α takes the value of zero, and the depth of poverty when α equals one. We follow Hoogeveen and Özler Citation(2005) in selecting R322 per capita monthly household income (in 2000 prices) as a plausible poverty threshold for South African households. This also allows for comparability with a number of other poverty studies that have used this poverty line (or very similar poverty thresholds) to measure poverty in South Africa (Ardington et al., Citation2006; Hoogeveen & Özler, Citation2006; Leibbrandt et al., Citation2006; Bhorat & Van der Westhuizen, Citation2008).
To estimate the extent and depth of poverty, we consider three different measures of per capita monthly household income: earned income only (measure I); earned income and social grant income (measure II); and earned income and social grant income with household expenditure used as a proxy for income in no-income households (measure III). The first measure of income identifies how poor individuals would have been had they relied only on the earnings of resident household members. The second measure helps highlight the poverty-reducing ‘effects’ of social grant income. With the third measure of income, we offer some correction for the upwards bias in poverty estimates created by incomplete information on all income sources.
4. Poverty analysis
4.1 Individual poverty estimates
To compare poverty rates by gender, we first estimate poverty at the level of the individual. Individuals are poor if they live in households where the average per capita monthly household income is below the poverty line of R322 (2000 prices). Because poorer individuals live in larger households in South Africa, poverty measured at the individual level is considerably higher than poverty measured at the household level (described in Section 4.2 below).
reports headcount poverty rates (α = 0) from 1997 to 2006, for the three measures of income. Within each year, poverty rates are lowered considerably as the measure of income becomes more comprehensive. In 1999, for example, 68.1% of South Africans lived in earnings-poor households. With the receipt of social grant income, the headcount rate falls to 66.3%; and when the income measure is augmented with data on household expenditure, the poverty rate declines further to 63.6%.
Table 2: Poverty estimates for South Africa, 1997–2006 (per capita)
Over the period 1997 to 2006, the poverty headcount decreased overall, but this decrease masks an initial increase in poverty rates from 1997 to 1999. Poverty incidence then begins to decline between 1999 and 2004, with the decline being most pronounced when both social grants (II) and household expenditure (III) are included as income sources (a significant decrease in the poverty headcount from 63.6% to 61.6%). From 2004 to 2006, there is a large and significant decrease in poverty rates, driven particularly by the poverty-reducing ‘effects’ of social grant income. In 2006, approximately 64.3% of all South Africans would have been poor had they relied only on income earned from employment. With the inclusion of social transfers, however, the extent of poverty falls by five percentage points, to 59.1%.
The overall trend of an initial rise in the extent of poverty (1997 to 1999) followed by a decrease in poverty rates (in 2004 and 2006) is consistent with trends identified in the recent poverty literature in South Africa (Bhorat & Kanbur, Citation2005; Leibbrandt et al., Citation2006; Meth, Citation2006; Seekings, Citation2007; Bhorat & Van der Westhuizen, Citation2008; Van der Berg et al., Citation2008; Yu, Citation2010). The actual poverty estimates that we present with the most comprehensive income measure (measure III in ) are comparable to those identified by Ardington et al. Citation(2006), who applied multiple imputation techniques to income data from the 1996 and 2001 Population Censuses to estimate income for households with missing and implausible income values. Employing this technique, they find that the poverty headcount increased from 59.8% to 65.1% between 1996 and 2001.
In we further disaggregate poverty rates by gender. In each year, poverty estimates are significantly and consistently higher for females than for males across all three measures of income. In 1999, for example, estimating the poverty headcount using income measure III, 61.3% of males lived in poor households compared to 65.8% of females. Trends in poverty rates disaggregated by gender show a similar pattern to the overall trend: headcounts rising for both males and females from 1997 to 1999 and then falling, particularly from 2004 to 2006. However, the data also suggest that gender differences in poverty increased over the decade. In 1997, using the most comprehensive measure of income, we find that approximately 61.8% of females lived in poor households compared to 57.1% of males, representing a difference of 4.7 percentage points. By 2006, poverty rates had fallen for both females and males, but the difference in their poverty rates had increased by 7.3 percentage points (59.6% compared to 52.3%).
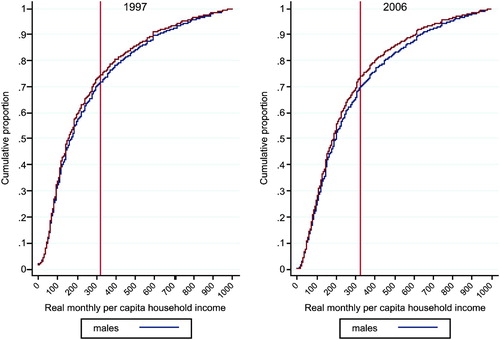
A clear visual representation of gender differences in poverty rates and the widening gender gap between 1997 and 2006 is provided in . The figure depicts a cumulative distribution function (CDF) of income (measure III) for males and for females living in households with an average real per capita household monthly income of less than R1000 per month (2000 prices) in 1997 and 2006, with the vertical line denoting the poverty line of R322. In both 1997 and 2006, the CDF for males falls below that for females at any point in the income distribution, indicating first order dominance. Furthermore, the distance between the CDFs for male and female income is noticeably wider in 2006 than in 1997. The figure therefore shows that at any plausible poverty line (both above and below R322) the gap in real monthly incomes between males and females has widened over the period.
Figure 1: Cumulative distribution function of real monthly per capita household income by gender, 1997 and 2006 FootnoteNotes.
The poverty gap ratios presented in suggest the particular contribution of social grant income to reducing the depth of poverty. In 1997, for example, the poverty gap ratio drops from 0.53 on the basis of earned income only, to 0.44 with the inclusion of social grant income; and in 2006 it also drops from 0.53 but to 0.36. Furthermore, the table shows that although poverty gap ratios are consistently higher for females than for males, the receipt of grant income reduces the depth of female poverty in particular. Across all four years, the greatest relative change in the poverty gap after including social grant income occurs among females. In 2006, for example, the poverty gap ratio declines by 30% for males (from 0.50 to 0.35) but by 32.1% for females (from 0.56 to 0.38).
Table 3: The poverty gap, 1997–2006
To explore further the contribution of social grant income to poverty alleviation, we decompose the FGT measures of poverty using the Shapley-value (Shorrocks, Citation1982; Duclos & Araar, Citation2006; Araar & Duclos, Citation2007). This method makes it possible to identify the average marginal effect of different income components to poverty reduction while recognising the different distributions of income components across individuals. Rather than simply calculating a share composition of each income source, the Shapley-value measures the average marginal effect of including an income source over all possible combinations of income sources for the population (Duclos & Araar, Citation2006). With the available data, we distinguish between three components of income: earned income, social grant income, and ‘other income’ accruing to households which received neither earnings nor grant income.
reports the average marginal contribution of each income source to reducing the incidence and the depth of poverty in 1997 and 2006. Income from employment has the largest marginal effect on both the rate and depth of poverty. However, from 1997 to 2006 the average relative contribution of earned income fell, while that of grant income increased. The contribution of grant income to poverty reduction derives particularly from its relative contribution to reducing the depth of poverty, and over the period this average marginal effect increased. In 1997 and 2006, grant income reduced the poverty gap ratio by about 16% and 26% respectively. The table also highlights the finding that grant income reduces the poverty rate, and particularly the poverty gap ratio, by a larger amount for females than for males.
Table 4: Relative contribution of income sources to reducing poverty
Overall then, the data presented in this section suggest that females are more likely than males to live in households where the average per capita monthly household income lies below a poverty line of R322 (2000 prices). Consistent with other studies, we find that poverty rates have fallen, particularly over the 2000s. We find further that the incidence of poverty has declined for both males and females but that the decrease has been absolutely and relatively smaller for females. Consequently, over the period 1997 to 2006, gender differences in the incidence of poverty have increased slightly in favour of males. With the receipt of social grant income in households, both the extent and depth of poverty are significantly lower than they would have been had households relied only on income earned through employment. These social grants are effective particularly in decreasing gender differences in the depth of poverty.
4.2 Poverty estimates at the household level
To investigate gender trends in poverty further, we compare the incidence and depth of poverty in female and male-headed households. Although the value of self-reported headship as an analytical category is contested (cf. Budlender, Citation2005), evidence suggests that, in the majority of households in South Africa, household heads are also the main income providers. In the 1997 OHS, for example, approximately 83% of all household heads earned or received the highest level of income in the household. Poverty estimates by the gender of the household head therefore offer an opportunity to explore the nature and implications of gender differences in access to resources.
documents a steady increase from 1997 to 2006 in the number of households headed by women. This increase has been slightly larger than the rise in the number of households overall and consequently the share of all households that are female-headed grew modestly over the period, from 35.2% to 37.5% of all households.
Table 5: Male- and female-headed households, 1997–2006
In we estimate headcount and poverty gap ratios using the most comprehensive measure of income (measure III), but now at the household level (households are poor if real average monthly per capita income in the household lies below the poverty line), and we distinguish between households headed by females and by males. Across all households, both the incidence and depth of poverty increased between 1997 and 1999 and then decreased in 2004 and particularly in 2006.
Table 6: Poverty estimates among households (measure III), by household type, 1997–2006
In all years, female-headed households are far more likely to be poor and to lie further from the poverty line than male-headed households. Furthermore, although the headcount and poverty gap ratios have fallen for both male-headed and female-headed households, the relative decreases have been larger for male-headed households. For example, from 1997 to 2006, the headcount rate fell from 38.8 to 32.5% (a fall of 16.2%) for male-headed households but only from 66.7 to 62% (a fall of 7%) for female-headed households.
To compare the relative contributions of the different income sources to poverty reduction in female- and male-headed households, we again make use of the Shapley-value decomposition. In we compare the average marginal contribution of earned income, grant income and other income received in ‘no-income’ households to poverty reduction in 1997 and 2006. In both female- and male-headed households, income from employment made the largest contribution to reducing both the extent and depth of poverty. However, earned income appears to be relatively more important in male-headed households. In 2006, for example, income from employment reduced poverty rates by 83% on average in male-headed households but only by 72% in female-headed households.
Table 7: Relative contribution of income sources to reducing poverty
The marginal impact of grant income increased over the period: at the mean, the receipt of social grants reduced poverty rates in all households by 6% in 1997 and 10% in 2006. The table also shows that grant income is relatively more important in reducing the extent and depth of poverty in female-headed households. Although the expansion of the social grant system has not decreased the differences in poverty incidence between female- and male-headed households, it has lessened the depth of poverty relatively more for female-headed households. In 2006, for example, social grant income lowered the poverty gap ratio by 35% for female-headed households compared to only 15% for male-headed households. At the same time, however, the relative contribution of other income declined substantially in female-headed households that received income neither from employment nor from social grants. This may suggest that the receipt and value of remittances, particularly in households headed by women, has fallen over time.
The data presented in this section have demonstrated that poverty trends at the household level have also been gendered during the period under review. Both the poverty headcount and the depth of poverty have declined by relatively more for male-headed than for female-headed households. The decomposition analysis has suggested that, while social grant income has not closed the poverty gap between male- and female-headed households, such income has been relatively more important in reducing both the extent and depth of poverty for female-headed households. Differences in the incidence and severity of poverty between male- and female-headed households would therefore have been even greater without the receipt of social grant income.
5. Sensitivity tests
5.1 The under-estimation of income
One of the concerns with poverty studies that make use of household survey data is that income may be under-estimated, and poverty therefore over-estimated, because all sources of income earned or received in households may not have been measured. In the four surveys analysed in this study, information is consistently collected on the individual receipt of earnings and social grants. However, this is not the case for other sources of non-labour income and income transfers. As we showed earlier in , this resulted in a significant proportion of ‘no-income’ households, or households in which neither earned income nor social grant income was reported. In our poverty analysis, we addressed this problem by using data on reported household expenditure. In this section, we test whether this simple correction is an effective means of reducing the underestimation of household income.
Of the four datasets analysed in this study, only the 1997 OHS collects detailed information on the value of individual sources of income other than earnings and social grants. For the purposes of comparability across the years, we did not include this information in the poverty estimates for 1997 reported in the previous section. Here, we generate a new measure of household income (measure IV) for 1997, which includes the value of remittances received as well as of private maintenance, work pensions, unemployment benefits and gratuities (income sources that are not captured in the 1999 OHS or in the GHSs).
In we present poverty statistics based on this new estimate of income, and for ease of comparison we repeat the statistics derived from the expenditure-augmented measure of household income (measure III) reported in earlier tables. The table shows that although differences in poverty estimates based on the two measures of income are not large, both the incidence and depth of poverty are lower using measure III than measure IV, and particularly for male-headed households. One possible explanation for this is that even in the 1997 OHS comprehensive information is not collected on all sources of income, including private pensions and rental income, and measure IV therefore continues to underestimate income. These findings suggest that using household expenditure to augment measures of reported income may be an effective means of redressing the underestimation of income in household surveys where information on all sources of income is not captured.
Table 8: Including other sources of income: Poverty estimates in 1997
5.2 Adjusting for household composition
Following both international (cf. Ravallion, Citation1994) and South African (cf. Leibbrandt & Woolard, Citation1999) best practice, we test whether our gendered poverty estimates are robust to adjustments for household composition. In particular, we adjust both the poverty line and household income by the number of adult equivalents and by scale economies in the household (see UNSD, Citation2005).Footnote3 In choosing the most appropriate values for the adult equivalence and economies of scale adjustments for South African households, we follow May et al. Citation(1995) and Leibbrandt and Woolard Citation(1999), assuming a scale parameter of 0.9 and that children consume half the resources of adults, and, like Leibbrandt and Woolard Citation(1999), we define children as those aged 10 and younger.
compares per capita estimates (measure III) of the extent and depth of poverty with estimates adjusted for household composition in 2006. The data presented in suggest that estimating poverty rates using equivalence measures makes very little difference to overall poverty statistics, a finding which mirrors those reported in Leibbrandt and Woolard Citation(1999) and Woolard and Leibbrandt Citation(2001).
Table 9: Per capita and per adult equivalent poverty estimates (measure III), 2006
In , we compare per capita and per adult equivalent trends in the extent of poverty, using the most comprehensive measure of income (measure III). The table demonstrates that aggregate poverty trends and trends disaggregated by gender are not greatly affected by the use of an adult equivalence measure of income. Decreases in poverty rates for males and females are slightly greater when adjusting for household composition, but poverty rates for males continue to fall by absolutely and relatively more than poverty rates for females. Gendered trends in poverty are therefore robust to adult equivalence and economy of scale adjustments to household income.
Table 10: Per capita and per adult equivalent poverty trends
6. Conclusion
This paper has analysed income data from regularly collected household surveys to investigate gendered trends in poverty over the post-apartheid period. The advantage of using these datasets is that they include information on earned income and social grant income at the individual level. We compared poverty rates when individuals and households relied only on earned income with estimates that include social grants in the measure of income. To address the possible underestimation of reported income in households that reported neither earnings nor social grants, we also used household expenditure as a proxy for income. To compare the relative contributions of the different income sources to poverty reduction, we applied a Shapley-value decomposition.
The results presented suggest that, first and foremost, poverty remains a gendered phenomenon in post-apartheid South Africa. Across all four years and for each measure of income, the extent and depth of poverty are considerably higher for females and for female-headed households. While the decline in overall poverty rates between 1997 and 2006 is encouraging, it masks differences in gendered poverty trends over the period. A greater decline in both the extent and the depth of poverty experienced by males and male-headed households has increased the differences in poverty rates by gender. Particularly in the period during which declines in poverty have been greatest (2004–2006), the reduction in poverty has favoured males and male-headed households. From a gender perspective, however, the news is not all bad. Our findings suggest that the receipt of social grant income may have been relatively more effective in reducing particularly the depth of poverty for females and female-headed households.
Acknowledgements
The authors would like to thank Economic Research Southern Africa (ERSA) for their support in the completion of this study.
Notes
1To the extent that social grant payments are means-adjusted, our measures of individual grant income will be over-estimated.
2Where expenditure information is also missing, then these households have been dropped from the sample.
Sources: Stats SA (1997, 2006); own calculations.
Note: We have restricted the size of the population to aid the visual representation, but this makes the proportion of the population that is shown as being in poverty higher than the national measures.
3We identified a household of average size and composition in which per capita income equalled the poverty line of R322. We then set the adjusted poverty line equal to household income adjusted for adult equivalents and the scale parameter.
References
- Araar, A , and Duclos, J- Y , 2007. "DASP: Distributive Analysis STATA Package". 2007, DASP Version 2.0, PEP, CIRPÉE and World Bank, Université Laval.
- Ardington, C , Lam, D , Leibbrandt, M , and Welch, M , 2006. The sensitivity to key data imputations of recent estimates of income poverty and inequality in South Africa , Economic Modelling 23 (2006), pp. 822–35.
- Armstrong, P , Lekezwa, B , and Siebrits, K , 2008. "Poverty in South Africa: A profile based on recent household surveys". 2008, Stellenbosch Working Paper Series No. WP04/2008, Department of Economics/Bureau for Economic Research (BER), Stellenbosch University.
- Bentley, K , 2004. Women's human rights and the feminisation of poverty in South Africa. Review of African Political Economy , 31 (100) (2004), pp. 247–61.
- Bhorat, H , and Kanbur, R , 2005. "Poverty and well-being in post-apartheid South Africa: An overview of data, outcomes and policy". 2005, DPRU Working Paper 05/101, Development Policy Research Unit, University of Cape Town.
- Bhorat, H , and Van der Westhuizen, C , 2008. "Economic growth, poverty and inequality in South Africa: The first decade of democracy". 2008, Development Policy Research Unit Conference 2008 – The Regulatory Environment and its Impact on the Nature and Level of Economic Growth and Development in South Africa, 27–29 October, Muldersdrift, Gauteng.
- Bhorat, H , Naidoo, P , and Van der Westhuizen, C , 2006. "Shifts in non-income welfare in South Africa: 1993–2004". 2006, DPRU Working Paper Series, Cape Town, Development Policy Research Unit, University of Cape Town.
- Budlender, D , 1997. The women's budget , Agenda 33 (1997), pp. 37–42.
- Budlender, D , 2005. Women and poverty , Agenda 64 (2005), pp. 30–6.
- Buvinic, M , and Gupta, G R , 1997. Female-headed households and female-maintained families: Are they worth targeting to reduce poverty in developing countries? , Economic Development and Cultural Change 45 (2) (1997), pp. 259–80.
- Casale, D , 2004. "What has the feminisation of the labour force ‘bought’ women in South Africa?". 2004, Trends in labour force participation, employment and earnings, 1995–2001. DPRU Working Paper Series No. 04/84, Development Policy Research Unit, University of Cape Town.
- Casale, D , and Posel, D , 2002. The continued feminisation of the labour force in South Africa: An analysis of recent data and trends , The South African Journal of Economics 70 (1) (2002), pp. 156–84.
- Casale, D , and Posel, D , 2005. Women and the economy: How far have we come? , Agenda 64 (2005), pp. 21–9.
- Duclos, J- Y , and Araar, A , 2006. "Poverty and equity: Measurement, policy and estimation with DAD". 2006, CIRPÉE, Université Laval, Quebec.
- Foster, J , Greer, J , and Thorbecke, E , 1984. A class of decomposable poverty measures , Econometrica 52 (3) (1984), pp. 761–6.
- Hoogeveen, J , and Özler, B , 2005. "Not separate, not equal: Poverty and inequality in post-apartheid South Africa". 2005, William Davidson Institute Working Paper No. 739, William Davidson Institute, University of Michigan, Ann Arbor.
- Hoogeveen, J , and Özler, B , 2006. "Poverty and inequality in post-apartheid South Africa: 1995–2000". In: Bhorat, H , and Kanbur, R , eds. Poverty and Policy in Post-apartheid South Africa. HSRC (Human Sciences Research Council) . Cape Town: Press; 2006. pp. 59–94.
- Lampietti, J , and Stalker, L , 2000. "Consumption expenditure and female poverty: A review of the evidence". 2000, Policy Research Report on Gender and Development Working Paper Series No. 11, World Bank, Washington, DC.
- Leibbrandt, M , and Woolard, I , 1999. "Measuring Poverty in South Africa". 1999, DPRU Working Paper Series No. 99/33, Cape Town, Development Policy Research Unit, University of Cape Town.
- Leibbrandt, M , and Woolard, I , 2001. "Measuring poverty in South Africa". In: Bhorat, H , Leibbrandt, M , Maziya, M , Van der Berg, S , and Woolard, I , eds. Fighting Poverty: Labour Markets and Inequality in South Africa . Cape Town: University of Cape Town Press; 2001. pp. 41–73.
- Leibbrandt, M , Levinsohn, J , and McCrary, J , 2005. "Incomes in South Africa since the fall of apartheid". 2005, NBER Working Paper 11384, National Bureau for Economic Research, Cambridge, MA.
- Leibbrandt, M , Poswell, L , Naidoo, P , and Welch, M , 2006. "Measuring recent changes in South African inequality and poverty using 1996 and 2001 census data". In: Bhorat, H , and Kanbur, R , eds. Poverty and Policy in Post-apartheid South Africa Cape. HSRC (Human Sciences Research Council) . Cape Town: Press; 2006. pp. 95–142.
- May, J , Carter, M , and Posel, D , 1995. "The composition and persistence of poverty in rural South Africa: An entitlements approach". 1995, Paper No. 15, Johannesburg, Land and Agriculture Policy Centre Policy.
- Meth, C , 2006. "Income poverty in 2004: A second engagement with the Van der Berg et al". 2006, figures. School of Development Studies Working Paper 47, Durban, School of Development Studies, University of KwaZulu-Natal.
- National Treasury, 2007. "Intergovernmental Fiscal Review". Pretoria: National Treasury; 2007.
- Phalane, M , 2002. "Globalisation, the feminisation of poverty and the masculine workplace: A South African perspective of the problem that spurs expansion but triggers inequality and identity crises". 2002, CODESRIA's 10th General Assembly, Conference, 8–12 December, Kampala, Uganda.
- Posel, D , 1997. Counting the poor: Who gets what in which households? , Agenda 33 (1997), pp. 49–60.
- Posel, D , 2001. Who are the heads of household, what do they do, and is the concept of headship useful? An analysis of headship in South Africa , Development Southern Africa 18 (5) (2001), pp. 651–70.
- Ravallion, M , 1994. "Poverty Comparisons". Chur, Switzerland: Harwood Academic; 1994.
- Ray, R , 2000. Poverty and expenditure patterns of households in Pakistan and South Africa: A comparative study , Journal of International Development 12 (2000), pp. 241–56.
- Schatz, E , and Ogunmefun, C , 2007. Caring and contributing: The role of older women in rural South African multi-generational households in the HIV/AIDS era , World Development 35 (8) (2007), pp. 1390–403.
- Seekings, J , 2007. "Poverty and inequality after apartheid". 2007, CSSR Working Paper No. 200, Centre for Social Science Research, University of Cape Town.
- Shisana, O , Rice, K , Zungu, N , and Zuma, K , 2010. Gender and poverty in South Africa in the era of HIV/AIDS: A quantitative study , Journal of Women's Health 19 (1) (2010), pp. 39–46.
- Shorrocks, A , 1982. Inequality decomposition by factor components , Econometrica 48 (1982), pp. 613–25.
- Stats SA (Statistics South Africa), 1997. October Household Survey for 1997. Stats SA, Pretoria..
- Stats SA (Statistics South Africa), 1999. October Household Survey for 1999. Stats SA, Pretoria..
- Stats SA (Statistics South Africa), 2004. General Household Survey for 2004. Stats SA, Pretoria..
- Stats SA (Statistics South Africa), 2006. General Household Survey for 2006. Stats SA, Pretoria..
- Stats SA (Statistics South Africa), 2008. Income and Expenditure of Households 2005/6: Statistical Release PO100. Stats SA, Pretoria..
- Taylor, V , 1997. Gender injustice: The macro picture , Agenda 33 (1997), pp. 9–25.
- Thurlow, J , 2006. "Has trade liberalization in South Africa affected men and women differently?". 2006, DSGD (Development Strategy and Governance Division) Discussion Paper Series, IFPRI (International Food Policy Research Institute), Washington, DC.
- UNDP (United Nations Development Programme), 1995. "Human Development Report 1995". New York: Oxford University Press; 1995.
- UNSD (United Nations Statistics Division), 2005. "Handbook of Poverty Statistics: Concepts, Methods and Policy Use". 2005, United Nations, Department of Economic and Social Affairs, New York.
- Van der Berg, S , Louw, M , and Yu, D , 2008. Post-transition poverty trends based on an alternative data source , South African Journal of Economics 76 (1) (2008), pp. 59–76.
- Woolard, I , and Leibbrandt, M , 2001. "Measuring poverty in South Africa". In: Bhorat, H , Leibbrandt, M , Maziya, M , Van der Berg, S , and Woolard, I , eds. Fighting Poverty: Labour Markets and Inequality in South Africa . Cape Town: University of Cape Town Press; 2001. pp. 41–73.
- Yu, D , 2010. "Poverty and inequality trends in South Africa using different survey data". 2010, Stellenbosch Working Paper Series No. WP04/2010, Department of Economics/Bureau for Economic Research (BER), Stellenbosch University.