Abstract
Social spending has become a major tool of targeting resources to South Africa's poor. The poor now get considerably more than their population share of social spending, but the underlying distribution of income is so skewed that overall post-fiscal inequality has not improved much. Concentration ratios and curves show considerable shifts in social spending incidence in the period 1995 to 2006. However, the efficiency of that spending is low, resulting in limited social outcomes and consequently also limited gains to the poor from better targeting. This paper therefore calls for the South African policy discussion to shift to why the ever-increasing fiscal inputs and improved targeting of those inputs have not produced the desired social outcomes.
1. Introduction
The fiscal process in South Africa has been particularly successful in shifting resources on a large scale from the formerly privileged to the poor, without over-reaching the boundaries set by fiscal constraints and responsible macroeconomic policy. However, issues of limitations to redistribution continually arise with regard to how effectively shifts in social spending resources translate into shifts in social outcomes and how much can be spent on social grants – the most effective resource transfers – without encouraging the perverse incentives associated with such grants. This paper examines the limits of redistribution achieved through the expenditure side of the budget by drawing on previous and ongoing research (in particular Van der Berg, Citation2001a, Citation2001b, Citation2001c, Citation2005, Citation2006, Citation2009; Gustafsson & Patel, Citation2006; De Villiers, Citation2009; Essop & Moses, Citation2009; Van den Heever, Citation2009; Van der Berg et al., Citation2009), considering the fiscal resource shifts since the political transition in 1994 and evaluating the outcomes thereof. The paper builds on previous research by the first author, but is unique in that it includes the General Household Survey 2006 to analyse the outcomes of fiscal expenditure (Stats SA, 2007).
Public social spending trends in South Africa serve as the point of departure for this discussion, whereafter social spending incidence is analysed, showing the extent of social spending shifts, the targeting of various social expenditures, and the limitations of social expenditure in reducing inequality in a situation where the underlying (market) distribution of income is so unequal. Finally, the analysis turns to investigating some limits to and limitations of redistribution through social spending by briefly investigating spending on social grants, education and health. In closing some broad conclusions are drawn.
2. Public social spending trends and incidence in South Africa, 1995 to 2006
2.1 Shifts in social spending 1995 to 2006
The inequity of apartheid spending levels is most strikingly illustrated by the fact that social spending per capita on whites was approximately eight and a half times that spent on blacks in 1975, when spending inequality peaked. Although vast social spending inequality along racial lines was one of the most visible features of apartheid, apartheid spending surprisingly did reach deeper into rural areas than is often the case in developing countries, due largely to the former government's attempts to legitimise the homeland system. The attendant social reforms that were aimed at bringing schools, health services and social grants to rural areas ensured that, despite discrimination in fiscal expenditure, the distribution of beneficiaries (rather than of benefits) was surprisingly equitable across the population, particularly under late apartheid. The close to universal access to school education, despite severe quality issues, is evidence of these efforts – Lam Citation(1999) shows that mean educational attainment was much higher and improved much more rapidly in South Africa than in Brazil, another middle-income country with high levels of inequality.
After democratisation, improved revenue collection, remarkable fiscal discipline and a broadening tax base allowed government the fiscal room it needed to increase the social spending items covered in the present study by a substantial 70% per capita in real terms in the period 1995 to 2006.
2.2 The incidence of social spending in South Africa
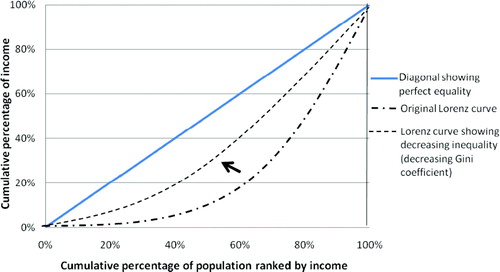
Social spending incidence measures the targeting of spending. The concentration curve and the concentration ratio are two related measures of such targeting of spending across the income distribution. The concentration curve (shown in ) is drawn in very similar fashion to the Lorenz curve (): all households are first arranged from poorest to richest. The cumulative percentage of spending received is then graphed against the cumulative percentage of the population.
Figure 1: Concentration curves depicting pro-rich and pro-poor social spending
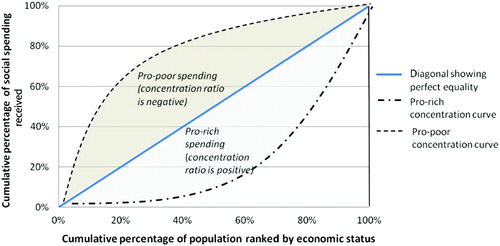
Figure 2: The effect of decreasing income inequality on the Lorenz curve
However, unlike the Lorenz curve, which can never lie above the diagonal, it is possible for the concentration curve to do so: though the poorest 40% of the population (hereinafter referred to as ‘the poor’) cannot earn more than 40% of income, they can receive more than 40% of social spending on grants. The best targeting (pro-poor government spending) would naturally be where the poor receive considerably more than 40% of social spending, i.e. for curves above the diagonal.
The Gini coefficient can be viewed as the proportion of the area below the diagonal that lies between the Lorenz curve and the diagonal (). The closer the Lorenz curve approaches the diagonal, the smaller the Gini coefficient, both of which indicate decreasing inequality. Similarly, the concentration ratio is the proportion of the area below the diagonal that lies between the concentration curve and the diagonal, whereas the concentration curve lies below the diagonal (). However, for any part of the concentration curve that lies above the diagonal, that part of the area has a negative value. Similarly the concentration ratio becomes smaller as the concentration curve approaches the diagonal from below, but once the curve lies above the diagonal the concentration ratio becomes even smaller and takes on a negative value. The best targeting would therefore mean the smallest concentration curve, i.e. one with a negative value.Footnote1
Despite the remarkable improvements made in targeting the poor within these categories, the underlying reasons for the improvement in targeting were not solely related to good policy and delivery (although government had gone to considerable lengths to improve targeting and access for the poor to social services). In education, the fact that there were more children among the poor meant that spending on education by government disproportionately favoured this group; in health, the more affluent often opted out of public health services, frequently because of quality concerns; and although the means test for social grants ensured targeting at poorer people, this spending category has actually seen a slight worsening of targeting since 1995.
Yet overall targeting has improved, largely driven by the rising weight of social grant spending (the best targeted programme) and the relative decline in spending on tertiary education, the most poorly targeted programme (see and ). As indicated above, improved access to services and racial biases no longer affected the incidence of fiscal expenditure in 2006. shows that the poor received more than their share of the benefits of public spending. Thus, from a distributional perspective, the scope for improved targeting of spending is now limited.
Figure 3: Share of spending received by the poorest 40% of the population by social spending category
Table 1: Concentration ratios by social sector, 2000 and 2006
The poor received a full 50% of all social spending and benefited especially from spending on the three main social grant types (receiving between 59% and 70% of such spending) and for public clinics (57%), to which the poor enjoyed relatively good access and which the more affluent seldom visited. The poor also received slightly more than ‘their share’ of subsidies in school education (49%) and in public hospitals (43%). Housing and tertiary education were two notable exceptions, where the poor received only 24% and 5% respectively of all subsidies. Housing subsidies were not well targeted at the poor, as they largely went to urban residents, while the poorest often resided in rural areas. In tertiary education the very low proportion of subsidies estimated to go to the poor was the result of a combination of factors that is discussed in Section 3.
3. The redistributive powers of the budget and its limitations
The overall spending on the social services covered in this study in 2006 (R177 billion in nominal terms) was not much more than the overall value of personal income taxes paid (R141 billion). To determine the benefit of social spending, households were ranked in terms of their income before social spending, i.e. by income per person, excluding the value of any social grants that they might have received. Thus one can consider three distributions: a distribution of income before grants, subsidies and taxes; a distribution after grants and subsidies had been added to households' resources; and a final distribution that also excluded personal taxes households paid.
In 2006 the Gini coefficient for pre-transfer income was 0.69, but 0.53 for income plus benefits and 0.47 after taxes had also been subtracted (). This shows that the South African fiscal process was highly distributive; within the budget, social spending had an especially large impact on inequality, reducing the post-fiscal Gini coefficient by far more than the progressive income tax system did. The fact that inequality was still extremely large even after all redistributive spending and taxes had been considered emphasises both the limits of fiscal redistribution and the need for a reduction of inequality in the market.
Table 2: Concentration ratios* and Gini coefficients, 1995, 2000 and 2006
shows that total spending per person increased substantially in real terms between 1995 and 2006. The largest part of this increase occurred after 2000, with social spending increasing from about R2000 per capita in 2000 to almost R2800 in 2006, reflecting strong growth of the economy and government revenue. As shows, gains in social benefits were recorded right across the income distribution, but the gains for the poor were particularly large.
Figure 4: Real per capita benefits from all social spending by quintile, 1995, 2000 and 2006 (in rand values in 2000)
Improved targeting (largely because of the rapid growth of means-tested social grants) is also reflected in the concentration ratio, which improved somewhat from –0.096 in 1995 to –0.106 in 2000, and then even more rapidly to –0.146 in 2006. Social spending per person for the poor has more than doubled over the past 11 years, from only R1373 in 1995 to R2319 in 2000 and R3454 in 2006 (all in rand values in 2000). Thus the poor increased their share of spending from 46.9% to 49.6%, and the spending to their benefit increased by R1135, about R1000 more than for those in the richest 20% of the population. By race (shown in ) the poorest groups (black and coloured) unequivocally gained from the shifts in spending, whereas the increased spending allowed whites and Indians to at least maintain their benefit levels per capita in real terms. Compared to whites, blacks and coloureds more readily qualified in terms of the means test for social grants, more commonly used public health facilities, and had more children of school-going age.
Figure 5: Real per capita benefits from all social spending by race group, 1995, 2000 and 2006 (in rand values in 2000)
Interestingly, targeting within specific social programmes had changed little since 2000, as indicates. The scope for redistribution to eliminate earlier discrimination had almost been exhausted. The targeting of aggregate social spending became much better largely as a result of structural shifts in the size of different programmes referred to above: the rapid growth of the best targeted social programme, social grant spending, and the decline in real per student and per capita spending on tertiary education, the most poorly targeted programme (though note a proviso about the accuracy of the targeting information for tertiary education that is touched on in Section 4.2 below). These changing weights made social spending even more redistributive, though further scope for this was diminishing.
indicates that though the fiscal process was quite redistributive, the underlying large inequality in distribution of pre-transfer income (resulting largely from the working of market processes) limited the final distributional outcomes. The Gini coefficient for income excluding social transfers was very high, but the more pertinent figure is the reduction in the Gini that arose from the fiscal process (after taxes and social spending). In 1995 it reduced the post-fiscal Gini by 0.138, in 2000 by 0.179, and in 2006 by 0.220. Clearly, the redistributive power of the budgetary process had increased greatly.
4. The tenuous links between social spending and social outcomes
Although targeting of social spending has improved, one also has to question whether spending has had the desired outcomes as far as poverty, education and health goals are concerned. Sections 4.1 to 4.3 below demonstrate how tenuous the links often are between fiscal resource shifts and desirable social outcomes. Social grants are first briefly discussed, and thereafter education, which is reviewed in some detail because education outcomes are more readily measurable than other social programmes and because education has a large share in the South African budget. Expenditure on health and its limited impact on health outcomes are examined in Section 4.3.
4.1 Social grants and the poor
Welfare policy in South Africa has become increasingly proactive in its efforts to alleviate poverty by providing social grants. Between 2000/01 and 2006/07, real social grant payments more than doubled. The bulk of the additional grant spending came in the form of assistance for households containing children, with the age limit for eligibility for the child support grant being raised to 14. In addition, there were substantial increases in the number of beneficiaries of the disability grant, foster care grant and care dependency grant. , showing the number of beneficiaries of each social grant in 2000 and 2006, reflects these trends.
Table 3: Growth in the number of beneficiaries of social grants, 2001/02 to 2006/07
An important development in the reduction of inequality was the de-racialisation of the relatively large means-tested social old age pension. Research has long indicated that this grant is well-targeted (Case & Deaton, Citation1998), and that it is the most effective grant in terms of reducing poverty (UNDP, Citation2003:89). Old age pensions are the main source of support for unemployed individuals in rural areas (Case & Deaton, Citation1998). Klasen and Woolard Citation(2009) find that the unemployed have a low propensity to set up their own households and often live with pensioners to gain access to resources. Pensions could have a positive effect on labour supply (Posel et al., Citation2006:837), as they strengthen the ability of unemployed household members, especially women, to search for employment. Other positive unintended consequences include improved nutrition for grandchildren living with pensioners.
The availability of grants has enabled more mothers to keep their children with them, which may have other positive social outcomes for children. This is particularly important given that children are amongst the most economically vulnerable individuals in South African society (Streak et al., Citation2009).
However, income is only one dimension of well-being, and poverty often involves deprivation on a number of levels, including access to basic services. Consideration of basic services is therefore crucial in determining how effectively and efficiently social spending shifts in other areas are converted into desirable social outcomes. Household surveys show a strong increase in access to housing, electricity, water and sanitation (Burger et al., Citation2004), and the improvement in service delivery has particularly benefited the poorest households (Leibbrandt et al., Citation2005:34). Yet there are serious questions about the efficiency of social delivery in education and health, as the next two sections explain.
4.2 Education and the poor
In education there is still no clear link between resource shifts to the poor and social outcomes, despite substantial improvements in access to and investment in public education in recent times. Public spending on education in South Africa, at about 6% of GDP (a high ratio by international standards), currently constitutes the single largest government budget line item. The inequalities in education inputs and outcomes under apartheid prompted a marked increase in overall real spending on school education after 1994, with a substantial shift to spending benefiting black pupils. Unfortunately, previous disparities in teacher salaries also needed to be corrected (Van der Berg & Burger, Citation2010:8) and as a result resource shifts were dominated by wage increases for teachers, implying slower real resource shifts. In contrast to international experience (Lee & Barro, Citation1997:17–18), the relative burden of teacher salaries (measured relative to per capita GDP) increased.
South Africa's primary pupil-teacher ratio of 36.5 in 2001 was much more favourable than the mean of 40.7 for the countries belonging to the SACMEQ (Southern and Eastern African Consortium for Monitoring Educational Quality). In addition, South Africa's proportion of students taught mathematics by highly qualified teachers was exceeded only in two countries in the group. Unfortunately, more favourable resource availability did not necessarily imply that South African education was good even by the weak standards of southern and eastern Africa. Ample evidence of inferior educational outcomes for South African students exists, even relative to their African country counterparts. South Africa's performance on both Reading and Mathematics in the SACMEQ II Grade 6 evaluation test placed it in the bottom half of the 14 participating countries in 2001. In TIMSS 2003 (Trends in International Mathematics and Science Study), South African Grade 8 students ranked last of all 53 participating countries, with a score of only 264 for Mathematics, compared to the average of 467. In Science, South Africa scored 244 compared to the international average of 474 (Reddy, Citation2006). In the 2006 PIRLS (Progress in International Reading Literacy Study), in which Grade 4 pupils were tested in Reading in their home language, South African students performed worst of the 40 participating countries, achieving a mean score of 302, almost two standard deviations below the international mean of 500 (Twist et al., Citation2007). Moreover, in South Africa's case testing was done at Grade 5 level.
At the heart of this problem lies an issue of efficiency: schools translate inputs into outputs with varying degrees of efficiency, many performing well below expectations (Glewwe, Citation2002:436). The results reported above show that South Africa's problem is severe, and more severe than that of many other developing countries.
Overcoming the weak performance of poor schools seems to require much more than a massive shift of fiscal resources (Van der Berg, Citation2007). Despite these shifts, there are still differences in teacher qualifications between more and less privileged schools. Poorer schools struggle to attract well-qualified teachers (Yamauchi, Citation2005), as good teachers are scarce and it is hard to attract them to deep rural areas and townships, where they are most needed.
Crucially, one of the factors for successful educational outcomes – good school management – is in short supply in many poor schools and fiscal shifts do not always have the required effect in redistributing this very scarce resource. The potential learning benefit of drawing on relatively good teacher resources in rural and urban areas is limited by how well teachers are managed by the schools in which they are employed. Research shows that schools convert inputs into outputs with a large degree of variation and that some poor schools perform well above their predicted levels in spite of being at a resource disadvantage (Crouch & Mabogoane, Citation1998). This suggests that managing the available resources well rather than benefiting from a larger stock of resources may be the most critical school-level determinant of student performance.
In developing countries there is a tendency for public spending on education to be progressive at lower levels while highly regressive at tertiary levels (Meerman, Citation1979). Higher drop-out rates and lower enrolment rates by the poor at higher education levels translate into a more regressive distribution of public spending on education per enrolled student. The General Household Survey of 2006 (Stats SA, Citation2007) reveals that these patterns of public spending on tertiary education have prevailed despite more than a decade having passed since the dismantling of apartheid. The very low proportion of subsidies estimated to go to the poor in South Africa in 2006 was the result of a combination of three factors. Firstly, the weak performance of many schools attended by poor children effectively prevented many from completing school or obtaining a good enough matriculation pass to be accepted at a university. This limited their opportunity to attend tertiary institutions. Secondly, poor children who did perform well enough to qualify for tertiary education often lacked the financial resources to do so, despite the assistance of the means-tested NSFAS (National Student Financial Aid Scheme of South Africa) national loan and bursary fund scheme. Thirdly, the data relating to access to tertiary education were probably biased. Estimates were based on household surveys, but many students were no longer resident in their families of origin, so this may have led to inaccurate capturing of their home background in surveys.
The general failure of the South African primary and secondary education system to prepare poor students for tertiary education and to have them successfully complete it remains a significant cause of continuing inequality in the labour market.
4.3 Health and the poor
International cross-country evidence suggests that government health spending has a limited impact on health outcomes (Gupta et al., Citation1999). Measuring performance in health is also extremely challenging, partly because of the variety and complexity of health outcomes and the very complicated paths that inputs have to follow before achieving outcomes.
Government attempts at improving health services have largely focused on a shift to primary health care in an attempt to improve access. Shifts of health spending to provinces historically poorly endowed with health resources (Collins et al., Citation2000) and within provinces to primary health care, particularly clinics, have also been accompanied by subsidies intended to lower the costs of primary health services to certain users, and to provide free health care to pregnant women and young children.
There is general dissatisfaction with many public health services. shows that satisfaction rates for public hospital services (mainly used by those without medical aid) are significantly less than for private hospital services (mainly used by those with medical aid).
Figure 6: Levels of satisfaction (%) with hospital services among individuals visiting public and private hospitals, 2006 FootnoteNotes.
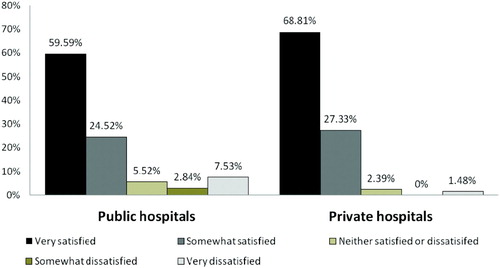
An earlier fiscal incidence study reported that even among the poorest wealth quintile, where only 1.1% of the population is covered by medical aid, 8% of those ill or injured in the month preceding the survey visited private health facilities (Van der Berg, Citation2005, using results from Booysen, Citation2002, from the 1998 Demographic and Health Survey data, DoH, Citation2002), indicating that many poor households are prepared to use their own funds for private health care. In economic terms, public health is an inferior good and the demand for health care reflects a strong preference for private health care where this is available and affordable. Public health facilities are also used less by people in the top quintile, where own income and access to medical aid make private health care more affordable.
These results are consistent with findings by Castro-Leal et al. (Citation2000:68–9) suggesting that South Africa's poor are much more likely than their counterparts in other African countries to substitute private for public health care (see ). This difference between South Africa and the other African countries is the result both of South Africa's relatively well-developed private health care system and the strong preference of South Africa's poor for private health care.
Figure 7: Household response to illness in six African countries, 1998 FootnoteNotes.
Except for some of the rural poor, who find it difficult to afford or access private facilities, the use of private facilities is surprisingly extensive throughout the population. From a policy perspective, this preference for private health care could imply that government should place greater emphasis on improving access to private health facilities (by subsidising them or by encouraging private practitioners to move to rural areas) or on improving the quality of public health care.
5. Conclusion
South Africa's post-transition government has enjoyed considerable success in shifting spending to the poor, in a period of good economic performance and impressive fiscal performance. The overwhelming message conveyed by the data on social service delivery is that social spending has often not produced the desired social outcomes, both in social delivery programmes, where there now appears to be an urgent need to use resources more efficiently, and in households, particularly the most vulnerable, which differ in their propensity to convert social grant spending into improved living standards. However, from a redistributive perspective the scope for reducing inequality any further through fiscal shifts is limited.
The true goal of welfare spending is not simply to transfer resources but rather to ensure that the desired outcomes are achieved. The primary challenge facing South African fiscal policy makers is to strengthen the links between fiscal resource shifts and social outcomes. Spending in a way that does not ensure outcomes is both ineffective and fiscally unsustainable. The large number of people who are being failed by the education and health system today will not be able to contribute as ably to the fiscus as the modest number of those who have received a good quality education and good health service and are therefore able to contribute amply. The policy discussion, after 17 years of substantial fiscal resource shifts, should therefore focus on why the conversion of fiscal inputs into the desired outputs has been largely unsuccessful, and how to remedy the situation.
Notes
1In principle the most-targeted spending would have a value approaching –1, but in practice that is hardly likely. It would only occur where almost all spending goes to the poorest 1% of the population.
Source: Constructed using data from Stats SA Citation(2007).
Source: Constructed using data from Castro-Leal et al. Citation(2000).
References
- Booysen, F , 2002. Using demographic and health surveys to measure poverty: An application to South Africa , Journal for Studies in Economics and Econometrics 26 (3) (2002), pp. 53–70.
- Burger, R , Van der Berg, S , Van der Walt, S , and Yu, D , 2004. Geography as destiny: Considering the spatial dimensions of poverty and deprivation in South Africa . Presented at Paper presented at DPRU/TIPS (Development Policy Research Unit/Trade and Industrial Policy Strategies)/Cornell University Conference on African Development and Poverty Reduction. 13–15, October, Somerset West, South Africa.
- Case, A , and Deaton, A , 1998. "Large cash transfers to the elderly in South Africa". In: NBER Working Paper No. 5572 . Cambridge: National Bureau for Economic Research; 1998.
- Castro-Leal, F , Dayton, J , Demery, L , and Mehra, K , 2000. Public spending on health care in South Africa: Do the poor benefit? , Bulletin of the World Health Organisation 78 (1) (2000), pp. 66–74.
- Collins, D , Brijlal, V , Makan, B , and Cross, P , 2000. Why do Some South African Provincial Governments Spend More on Health Care than Others? . Pretoria: Department of Education, Government Printer; 2000.
- Crouch, L , and Mabogoane, T , 1998. When the residuals matter more than the coefficients: An educational perspective , Studies in Economics and Econometrics 22 (2) (1998), pp. 1–14.
- De Villiers, P , 2009. "The cost of fiscal subsidies to higher education students in South Africa: A comparison between 2000 and 2006". In: Stellenbosch Working Paper Series No. WP13/2009 . Department of Economics/Bureau for Economic Research (BER), Stellenbosch University; 2009.
- DoH (Department of Health), 2002. South African Demographic and Health Survey 1998 . Pretoria: Department of Health; 2002.
- Essop, H , and Moses, E , 2009. "Main findings on free basic services from National Treasury Fiscal Incidence Report". In: Stellenbosch Working Paper Series No. WP14/2009 . Department of Economics/Bureau for Economic Research (BER), Stellenbosch University; 2009.
- Glewwe, P , 2002. Schools and skills in developing countries: Education policies and socioeconomic outcomes , Journal of Economic Literature 40 (2002), pp. 436–82.
- Gupta, S , Verhoeven, M , and Tiongson, E , 1999. "Does higher government spending buy better results in education and health care?". In: Working Paper No. 9921 . Washington, DC: International Monetary Fund; 1999.
- Gustafsson, M , and Patel, F , 2006. Undoing the apartheid legacy: Pro-poor spending shifts in the South African public school system , Perspectives in Education 24 (2) (2006), pp. 65–77.
- Klasen, S , and Woolard, I , 2009. Surviving unemployment without state support: Unemployment and household formation in South Africa , Journal of African Economies 18 (1) (2009), pp. 1–51.
- Lam, David , 1999. "Generating extreme inequality: Schooling, earnings, and intergenerational transmission of human capital in South Africa and Brazil". In: Research Report No. 99-439, August . Population Studies Center, University of Michigan; 1999.
- Lee, J , and Barro, R , 1997. "Schooling quality in a cross section of countries". In: NBER Working Paper 6198 . Cambridge: National Bureau of Economic Research; 1997.
- Leibbrandt, M , Levinsohn, J , and McCrary, J , 2005. "Incomes in South Africa since the fall of apartheid". In: NBER Working Paper 11384 . Cambridge: National Bureau for Economic Research; 2005.
- Meerman, J , 1979. Public Expenditure in Malaysia, Who Benefits and Why . New York: Oxford University Press; 1979.
- Posel, D , Fairburn, J , and Lund, F , 2006. Labour migration and households: A reconsideration of the effects of the social pension on labour supply in South Africa , Economic Modelling 23 (2006), pp. 836–53.
- Reddy, V , 2006. Mathematics and Science Achievement at South African Schools in TIMSS 2003 . Cape Town: HSRC (Human Sciences Research Council) Press; 2006.
- Stats SA (Statistics South Africa), 2007. General Household Survey 2006 . Pretoria: Stats SA; 2007.
- Streak, J C , Yu, D , and Van der Berg, S , 2009. Measuring child poverty in South Africa: Sensitivity to the choice of equivalence scale and an updated profile , Social Indicators Research 94 (2009), pp. 183–201.
- Twist, L , Schagen, I , and Hodgson, C , 2007. "Readers and Reading: National Report for England 2006". Slough: National Foundation for Educational Research; 2007.
- UNDP (United Nations Development Programme), 2003. South Africa Human Development Report 2003: The Challenge of Sustainable Development . Pretoria: UNDP South Africa; 2003.
- Van den Heever, A , 2009. "Fiscal incidence analysis: Healthcare". In: Stellenbosch Working Paper Series No. WP11/2009 . Department of Economics/Bureau for Economic Research (BER), Stellenbosch University; 2009.
- Van der Berg, S , 2001a. Trends in racial fiscal incidence in South Africa , South African Journal of Economics 69 (2) (2001a), pp. 243–68.
- Van der Berg, S , 2001b. Redistribution through the budget, Public expenditure incidence in South Africa , Social Dynamics 27 (1) (2001b), pp. 140–64.
- Van der Berg, S , 2001c. Resource shifts in South African schools after the political transition , Development Southern Africa 18 (4) (2001c), pp. 309–25.
- Van der Berg, S , 2005. "Fiscal expenditure incidence in South Africa, 1995 and 2000". In: Report to National Treasury . University of Stellenbosch; 2005, www.treasury.gpg.gov.za/docs/FiscalIncidenceReport2005.pdf Accessed 4 November 2011.
- Van der Berg, S , 2006. The targeting of public spending school education, 1995 and 2000 , Perspectives in Education 24 (2) (2006), pp. 49–64.
- Van der Berg, S , 2007. Apartheid's enduring legacy: Inequalities in education , Journal for African Economies 16 (5) (2007), pp. 849–80.
- Van der Berg, S , 2009. "Fiscal incidence of social spending in South Africa, 2006". In: Stellenbosch Working Paper Series No. WP10/2009 . Department of Economics/Bureau for Economic Research (BER), Stellenbosch University; 2009.
- Van der Berg, S , and Burger, R , 2010. "Teacher pay in South Africa". In: Stellenbosch Working Paper Series No. WP26/2010 . Department of Economics/Bureau for Economic Research (BER), Stellenbosch University; 2010.
- Van der Berg, S , Jansen, A , Burger, C , Moses, E , and Essop, H , 2009. "The fiscal incidence of provision of free basic water". In: Stellenbosch Working Paper Series No. WP11/2009 . Department of Economics/Bureau for Economic Research (BER), Stellenbosch University; 2009.
- Yamauchi, F , 2005. Race, equity, and public schools in post-apartheid South Africa: Equal opportunity for all kids , Economics of Education Review 24 (2) (2005), pp. 213–33.