Abstract
There is limited consensus on how to define informal employment in South Africa, but in the South African and international literature the three most common ways of capturing informal employment are the enterprise, employment relationship and worker characteristics approaches. This paper reviews the methods used by Statistics South Africa to measure informal employment before and after the introduction of the Quarterly Labour Force Survey, and other recently proposed methods. It then investigates the congruence, if any, between five measures of informality used in 2009. It finds that 94.7% of the self-employed are informal according to at least one definition, but only 62.6% according to all five combined. In addition, these two proportions are only 67.7% and 6.9% respectively in the case of informal employees. Econometric analysis is conducted to further investigate the differences between these measures.
1. Introduction
Since Hart Citation(1973) first introduced the concept ‘informal sector’ in the early 1970s, there has been considerable debate about what exactly the term ‘informal economy’ means and how to measure informal employment. Defining and measuring ‘informal employment’ has been a problem, both in South Africa and internationally. Since every country is different, a universally accepted definition is hard to come by.
Traditionally, informal employment in a developing country is seen as a possible alternative to limited opportunities for formal employment (Fields, Citation1975; Mazumdar, Citation1976; Bernabè, Citation2002). It is also a survivalist strategy for a labour force with deficient human capital, i.e. people who have a low chance of finding formal employment, such as those retrenched from the formal economy because of economic downturn or structural adjustment, those who voluntarily leave the formal workplace because informal work allows them to balance home and income-raising responsibilities, or entrepreneurs who prefer to operate informally so as to avoid the regulations and taxation imposed on formal enterprisesFootnote1 (Kershoff, Citation1996; Anderson, Citation1998; Palmade & Anayiotos, Citation2005; Perry et al., Citation2007). Furthermore, informal employment allows the labour market to clear more easily, since the informal sector is less subject to certain labour market rigidities (Kingdon & Knight, Citation2004, Citation2007). In contrast, it is argued (Mazumdar, Citation1976; Blunch et al., Citation2001; Henley et al., Citation2009) that since inferior earnings, fringe benefits, job insecurity and a significant level of under-employment are typical of the informal sector, this means that the scale of informal employment in a country can indicate the scale of poor working conditions in that country. Hence, two important policy concerns are to reduce the size of the informal sector and to widen the base of direct taxation. Further, policy concerns must take into consideration the extent to which open unemployment is a precise indicator of labour market performance, if unemployment is actually partly hidden in the informal economy.
Until 2007, Statistics South Africa (Stats SA) used the enterprise approach, as proposed at the 15th International Conference of Labour Statisticians (ICLS) of the International Labour Organisation (ILO) in 1993, to define informal employment as workers in informal sector enterprises. Given the slow employment creation in the formal economy, we would expect South Africa to have a fairly large informal economy. However, looking at other comparable countries, South Africa is an international outlier with regard to the size of this sector (Kingdon & Knight, Citation2004; Essop & Yu, Citation2008a), being characterised by high unemployment but low informal employment.
Various reasons have been advanced for the relatively low level of informal employment in South Africa. One is that there are entry barriers to the informal economy, such as crime, lack of access to finance, infrastructure and training, and insufficient government support to promote microenterprises and the informal sector (Rogerson, Citation2004; Kingdon & Knight, Citation2004, Citation2007). Another is that informal employment is under-captured because the imperfect questionnaire design and indicators used in Stats SA's 1995–2007 enterprise-based method (Devey et al., Citation2003; Muller, Citation2003; Essop & Yu, Citation2008a) hide a significant degree of informality in the formal economy, neglecting to take into account the fact that some formal jobs are characterised by conditions that are typical of informal work (Devey et al., Citation2006; Essop & Yu, Citation2008a). Alternative methods of defining informal employment have therefore been suggested (e.g. Devey et al., Citation2006; Heintz & Posel, Citation2008; Essop & Yu, Citation2008b) that take the nature of employment relationship into consideration, as proposed in the 17th ICLS in 2003. In other words, informal employment should also include people employed outside the informal sector who display informal characteristics, most notably the lack of social and legal protection in employment (Hussmanns, Citation2005).
Since the introduction of the Quarterly Labour Force Survey (QLFS) in 2008, Stats SA has defined informal employment in two ways: employment in the informal sector, and informal employment, which includes both informal sector workers and informal employment outside the informal sector. The following questions therefore need to be asked: Which Stats SA method measures informal employment more accurately? Would the recently proposed alternative methods mentioned above still be applicable in the QLFS, and would they result in a much larger estimate of informal employment? Would each method define different workers as informal? Furthermore, recent international studies (e.g. Gasparini & Tornarolli, Citation2007; Henley et al., Citation2009) recommend that worker characteristics such as educational attainment, earnings and occupation should be considered when defining informal workers. This leads to two further questions: Could such a worker-based approach to defining informal employment be applied to South Africa, and what will be the estimated size of the informal employment sector if it is possible to do so?
The rest of the paper is structured as follows. Section 2 reviews the official and recently proposed alternative methods for defining informal employment in South Africa, Section 3 examines the degree of coincidence of different measures of informal employment, Section 4 uses econometric techniques to investigate the commonalities and differences in the way in which these measures of informality are associated with various characteristics of the workers, and Section 5 concludes. The paper excludes from the analysis those employed whose broad industry category is agriculture, hunting, forestry or fishing, or ‘private households’. In addition, only the working-age population (15–65 years) is included.
2. Defining informal employment
Until 2007, Stats SA used the enterprise approach to define informal employment as only those working in the informal sector. The direct, self-perception question on the formal/informal sector status was the only criterion used to define informal workers, for both the self-employed and employees (Essop & Yu, Citation2008a:7). However, it is argued (Muller, Citation2003:6–9; Stats SA, Citation2006:10; Heintz & Posel, Citation2008:30–2) that a respondent's answer to this question might not give reliable estimates, and other indicators should be considered, so as to define informal employment more precisely. Hence, alternative definitions of informal employment have been proposed, most notably by Devey et al. Citation(2006), Essop and Yu Citation(2008b) and Heintz and Posel Citation(2008).
Heintz andPosel (2008:32) suggest that those self-employed who self-identify as informal sector workers but also report that the enterprise is registered for VAT or as a company or close corporation be re-coded as formal sector workers. On the other hand, employees are classified as formal if they have a written employment contract or receive both paid leave and pension contributions, regardless of whether they work in a formal or informal enterprise, since these characteristics are entitlements of workers according to the Basic Conditions of Employment Act of 1997. This method suggests that the enterprise approach should still be applied to define informal self-employed, but that the characteristics of the employment relationship with regard to social and legal protection be considered when defining informal employees. Alternatively, it could be said that there is an intersectoral margin between formal and informal enterprises in the case of the self-employed, but an intersectoral margin of formal and informal workers operating through the labour market when looking at the employees (Maloney, Citation2006).
Devey et al. (Citation2006:314–16,321) argue that the distinction between formal and informal sectors seems to imply a clear line between the two, but they are integrally linked. Furthermore, while the enterprise approach exposes differences between the characteristics of formal and informal workers, the categories are by no means mutually exclusive, since workers could display both formal and informal characteristics. That is, there is an intra-worker margin where workers are partly formal and partly informal. Hence, they propose a formal-informal index, developed from a set of 13 indicators. Five indicators are enterprise-based (i.e. the number of regular workers in the enterprise, works for a registered company or close corporation, whether the enterprise is registered to pay VAT, where the enterprise is located, and the number of employers), seven are related to the employment relationship (i.e., permanence of work, written contract, employer contributes to pension or retirement fund, paid leave, employer makes UIF deductions, employer makes medical aid or health insurance payments, and who pays wages) and the remaining indicator is related to the characteristic of the workers (membership of trade union). All the indicators carry equal weight in the index. The most formal and the most informal workers would achieve a score of 13 and zero respectively. However, this method could only be applied to the employees. In addition, a few problems in applying this method have been pointed out by Essop and Yu (Citation2008b:10–11), such as how to choose an appropriate cut-off score to distinguish informal workers from workers with strong informal characteristics, whether the indicators should carry equal weight, and how to include the number of employers as one of the indicators. Essop and Yu (Citation2008b:15–16) therefore propose a revised Devey et al. index, with the main change being replacing the question about the number of employers with a question about the flexibility of work hours.
With the inception of the QLFS in 2008, Stats SA adopted two new methods of defining informal employment (Stats SA, Citation2008:17–18). In the first (method A), informal employment once again means those working in the informal sector. However, the direct self-identification question, although still asked in the QLFS, is no longer considered when defining informal sector workers. Instead, employees are classified as informal if income tax (PAYE – Pay As You Earn, or SITE – Income Tax on Employees) is not deducted from their salary or wage and the number of employees at the place of work is fewer than five, while the self-employed are classified as informal if they are not registered for income tax, or registered for income tax but not for VAT. In the second approach (method B), informal employment means those working in the informal sector as well as those displaying informal characteristics but working in the formal sector, i.e. the suggestions of both the 15th and 17th ICLS are considered. Informal sector workers as defined by method A are still considered informal workers, while all the remaining people who are unpaid workers in household business but are not defined as informal sector workers are also classified as informal. Finally, employees classified as formal by method A are re-coded as informal if they are not entitled to medical aid or pension funds, or do not have a written contract with the employer. Stats SA only release the informal employment figures using the first method in all the QLFS statistical reports.
The former and current Stats SA methods and the Heintz & Posel method discussed above clearly indicate that the definition of informal self-employed still stresses enterprise characteristics, despite the fact that the indicators used differ across methods. Similar indicators (i.e. company or close corporation registration, VAT registration, income tax registration) are also adopted in recent international studies to define the informal self-employed (e.g. Anderson, Citation1998; ILO, Citation2004; Naik, Citation2009). With regard to the employees, the employment relationship characteristics (as in the Heintz & Posel method) or a combination of enterprise and employment relationship characteristics (as in the two formal–informal index approaches, Devey et al., Citation2006 and Essop & Yu, Citation2008a) are considered when classifying the informal employees in the South African studies, such as Essop & Yu (Citation2008a, Citation2008b). A similar approach is adopted in international studies, with the employment relationship criteria frequently used to capture informal employees being permanence of work, written contract, employer's contributions to pension or retirement fund, paid leave and employer's medical aid payments (e.g. Portes et al., Citation1986; Anderson, Citation1998; ILO, 2004; Gasparini & Tornarolli, Citation2007; ECA, Citation2008; Henley et al., Citation2009; Naik, Citation2009). In contrast, the most commonly used enterprise characteristics are enterprise registration status, work location and the size of the enterprise (e.g. Bekkers & Stoffers, Citation1995; Bernabè, Citation2002; Gasparini & Tornarolli, Citation2007; ECA, 2008; Henley et al., Citation2009; Naik, Citation2009). With regard to the enterprise size criterion, a measure of fewer than five regular workers or employees is defined as ‘small’ before the employees are classified as informal in all the studies, except in Bekkers & Stoffers Citation(1995) (fewer than 10 employees), and Devey et al. Citation(2006) and Essop & Yu Citation(2008b) (fewer than 50 regular workers).
The enterprise and employment relationship indicators used in the approaches discussed so far are, in general, the popular economic criteria used to define informal employment in less developed countries (Gërxhani, Citation2004:272–4). However, some recent international studies propose that a third type of characteristic should be considered when defining informal employment, namely worker characteristics. First, the study by Gasparini & Tornarolli (Citation2007:2–4) on the Latin American and Caribbean countries argues that informal workers are engaged in unskilled, low-productivity jobs in small-scale and often family-based activities with low income. Hence, under the so-called productive approach, the self-employed are classified as informal if they are unskilled workers, which stands for all individuals without a tertiary education qualification. Moreover, employees are classified as informal if they are salaried workers (i.e. earning non-zero income) in a small private enterprise with fewer than five employees, or if they are zero-income workers.
In contrast, the study by Henley et al. (Citation2009:996) on the Brazilian economy adopts the formal sector activity approach to define employees as formal workers if they are employed in an enterprise that has at least five employees, while the self-employed are classified as formal if their occupation is ‘creative and technical’ or ‘administrative’ (so as to capture professional activities). The rest are considered informal workers. This approach is thus similar to the productive definition of the Gasparini & Tornarolli method, as the enterprise characteristic (enterprise size) is considered when defining informal employees, while worker characteristics are the criteria used in the case of the self-employed.
The worker characteristics adopted in the two approaches discussed above – earnings, education, and occupation – are also the criteria taken into consideration to define informal workers by the United Nations Region Employment for Latin America (PREALC) (Tokman, Citation1982), and Anderson Citation(1998) in a study of the Mongolian economy. Lastly, the public/private sector work status of the employees is another worker characteristic considered to define informal workers in a study by the ECA (2008) of the Namibian and Tanzanian economies, as all public sector workers are excluded from informal employment.
3. Informality in South Africa according to different methods of classification
To assess the possible extent of informal employment in South Africa, with particular focus on what happened in the QLFSs, the following five methods are investigated here: (1) Stats SA method A, (2) Stats SA method B, (3) the Heintz & Posel method, (4) the Gasparini & Tornarolli productive method, and (5) the Henley et al. formal sector activity method. The last three methods would require revisions before they could be adopted for the QLFS. Firstly, the question on company/close corporation registration, one of the indicators used in the Heintz & Posel method, is no longer asked in the QLFSs. Secondly, although the direct, self-identification question is asked in all QLFSs, the results have not been included since QLFS 2009Q3, when Stats SA released the data. Hence, it was rather decided to revise the Heintz & Posel method as follows: Stats SA method A was used to capture the self-employed in the informal sector, while the same three indicators as discussed in Section 2 were used to define the informal employees (i.e. nature of employment contract, entitlement to paid leave, and pension contributions by employer).
Thirdly, the main problem with the productive definition recommended by Gasparini and Tornarolli is that the question on earnings from the main job has not been asked since the introduction of the QLFS. Furthermore, it is difficult to adopt Henley et al.'s activity method unchanged for the South African data, since Brazil and South Africa classify occupations differently. The following revised Gasparini & Tornarolli productive method was therefore adopted: the self-employed are still classified as informal workers if they do not have a bachelor degree, while employees are classified as informal workers if they work in an enterprise with fewer than five employees. Finally, in the Henley et al. activity method, the same method was adopted to distinguish the formal employees, that is, those who work in an enterprise with at least five employees (this implies that both the revised Gasparini & Tornarolli productive method and the revised Henley et al. method define informal employees in the same way), while informal self-employed are classified as those involved in semi-skilled or unskilled occupations.
The analysis here considers not only the informal employment numbers and trends from these five methods, but also the correspondence between these methods, i.e. whether the different methods capture the same groups of informal workers. As seven indicators used in the Devey et al. and the Essop & Yu formal-informal index methods are still used in the QLFS, a principal components analysis (PCA) approach is also used here to derive a mini Devey et al. formal/informal index. It was decided to call this index the ‘mini Devey et al. index’ to distinguish it clearly from the revised Devey et al. index derived by Essop and Yu Citation(2008b). This index is then used to divide the employees into quintiles, after which the informal employment derived from the five methods as mentioned above is analysed by quintile, to explore in greater detail whether there are underlying differences between these definitions. summarises the indicators used to define informal employment in each method.
Table 1: Indicators used to define informal employment in each approach
presents the numbers and proportions of the self-employed classified as informal by each method. The number of informal self-employed and the rates of informality fluctuate at the 1.3–1.5 million and 68–72% ranges respectively in all five methods, except in the revised Gasparini & Tornarolli method, which gives a higher rate of informality (approximately 90% during the period under study).
Table 2: Self-employed in informal employment (weighted, 1000s), QLFS 2008Q1–QLFS 2009Q4
shows the same statistics as for employees. Stats SA method B gives the highest estimate of the rate of informality at about two thirds (more than 6 million) of all employees during the period under investigation, followed by the revised Heintz & Posel method, which estimates that about 15% of employees (between 1.2 and 1.5 million during the period) are informal. The rate of informality is lowest in Stats SA method A.
Table 3: Employees in informal employment (weighted, 1000s), QLFS 2008Q1–QLFS 2009Q4
analyses the QLFS 2009Q4 informal employment in more detail by showing the percentage shares of self-employed and employees respectively. The results suggest that a majority of the informal workers are self-employed in all five methods, except in Stats SA method B, in which slightly more than 80% of the informal workers are employees. This contradicts the general findings in the South African studies (Devey et al., Citation2003; Essop & Yu, Citation2008a) that the self-employed comprise a bigger share of informal employment.
Figure 1: Proportions of self-employed and employees in informal employment, QLFS 2009Q4
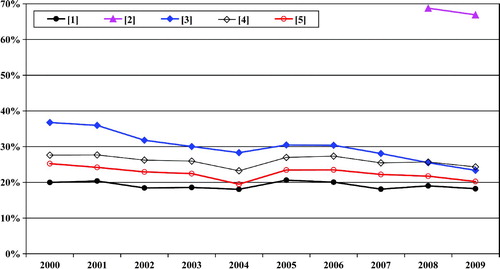
Informal employment as a percentage of all employed in QLFS 2009Q4 is presented in . It can be seen that the proportion is lowest using Stats SA method A (18.4%), followed by the revised Henley et al. method (19.4%). The revised Heintz & Posel and the revised Gasparini & Tornarolli methods give a slightly higher result, classifying approximately a quarter of the employed as informal. The highest result is for Stats SA method B, which shows that two out of three employed are informal workers (66.9%). If this last method is adopted, would South Africa still be classified as an international outlier with high unemployment but low informal employment? provides more detail, showing what has been happening since 2000. The enterprise-based approaches used in Stats SA's 1995–2007 method and in method A give the lowest rates of informality in all years.
Figure 2: Informal employment as percentage of all employed, QLFS 2009Q4
Figure 3: Informal employment as percentage of all employed, 2000–2009 FootnoteNotes.
Finally, as mentioned in the Introduction, unemployment could be hidden in the informal economy to some extent, so shows the percentage of the labour force who are classified as either strictly unemployed or informal workers in QLFS 2009Q4. As expected, this proportion is the highest if Stats SA method B is adopted, since a very high number of employees are identified as informal. This suggests either that the problem lies in the extremely slow rate of employment creation in the formal economy or that this method might be too broad a measure to capture informal employees.
Figure 4: Percentage of labour force defined as unemployed or informal workers, QLFS 2009Q4
Although the descriptive statistics discussed above show that the rates of informality are similar in some methods, this does not imply that the same workers are classified as informal by all five methods. For this reason, presents three matrices, showing the proportion of workers classified as informal by one method who are also classified as informal by another method, in the case of the self-employed, employees and all employed, in QLFS 2009Q4. For example, the value 0.84 in the second row of the first matrix means that 84% of those classified as informal self-employed by Stats SA method B are also classified as informal self-employed by the revised Henley et al. method.
Table 4: Proportion of workers classified as informal by one approach but informal by another, QLFS 2009Q4
The first matrix of the table shows that all these methods capture a very similar group of the informal self-employed, except for the revised Gasparini & Tornarolli method, where only about three out of four workers classified by this method as informal self-employed are also classified as informal by each of the other four methods. The second matrix clearly shows that a very low proportion of workers classified as informal by the Stats SA method B are also classified as informal by the other methods. Further, all employees classified as informal by the revised Heintz & Posel method are also classified as informal by Stats SA method B, but this proportion is only about 0.35 when compared with the other three methods. This suggests that Stats SA method B and the revised Heintz & Posel method may have captured different groups of informal employees.
and provide further illustration of the coincidence of the various definitions of informal employment. First, shows that 94.7% of the self-employed are classified as informal by at least one of the five methods under study in QLFS 2009Q4. Looking at these informal self-employed in greater detail, it is apparent that just under two thirds of them are classified as informal by all five methods, while over 20% are classified as informal by between two and four of the methods. However, about 15% are classified as informal only by the revised Gasparini & Tornarolli method. The results again imply that this method may have captured a different group of informal self-employed. With regard to employees, 67.7% of them are classified as informal by at least one of the methods under study, as shown in . However, only 6.9% of these informal employees are classified thus by all five methods. In addition, about two thirds are classified as informal only under the Stats SA 2008b method.
Figure 5: Coincidence of various definitions of informal self-employment, QLFS 2009Q4
Figure 6: Coincidence of various definitions of informal employees, QLFS 2009Q4
aims to confirm the findings discussed above by looking at the racial, gender and educational attainment characteristics of the informal workers according to each method. The results once again suggest that the self-employed captured as informal by the revised Gasparini & Tornarolli method are different, as the black and female shares are 10 and 5 percentage points lower respectively, and these informal workers are more educated on average by 0.5 of a year. With regard to the employees, although a very high proportion of them are classified as informal only by the Stats SA method B, in general these informal workers have similar characteristics to those classified as informal employees by the revised Gasparini & Tornarolli and the revised Henley et al. methods. However, the black share is clearly higher, and the mean years of educational attainment are lower for informal employees as defined by either Stats SA method A or the revised Heintz & Posel method.
Table 5: Descriptive analysis by informal employment definition – gender, race and education, QLFS 2009Q4
As mentioned in Section 2 above, many workers could display both formal and informal characteristics, but all the methods discussed so far, except the two formal–informal index approaches, seem to suggest there is a clear dividing line between formal and informal workers. Therefore, to conclude this section, seven of the 13 indicators that can be retained from the questions in the QLFS (i.e. number of employees in the enterprise, permanence of work, written contract, employer contributes to pension or retirement fund, paid leave, employer makes UIF deductions, and employer makes medical aid or health insurance payments) are used to derive the mini Devey et al. index using the PCA, with each indicator carrying a different weight. All employees are then divided into five equal groups (i.e. quintiles) using this index, after which the distribution of informal employees as defined by each of the five methods is investigated.
The results are presented in . More than 95% of the employees classified as informal by the revised Heintz & Posel method are in quintile 1, the quintile displaying the strongest informal characteristics, and all informal employees are in the first two quintiles. A somewhat similar pattern is observed for the Stats SA method A, where a little over three quarters of employees classified as informal by this method are in quintile 1. In contrast, approximately 30% of the employees classified as informal by Stats SA method B are in each of the first three quintiles. The results suggest that method B may capture informality too broadly, since some of these informal workers may not display strong informal characteristics.
Table 6: Proportion of employees defined as informal by quintile of the mini Devey et al. index, QLFS 2009Q4
4. Multivariate analysis of factors associated with informality
The preceding analysis is limited in that it takes into account only one or two demographic variables when describing the characteristics of informal workers. However, in each of the five methods discussed above, many variables act together to determine whether the employed person is classified as informal. Probit regressions were therefore run to estimate the marginal effects of different potential influences on the likelihood of a worker being classified as informal by each method in QLFS 2009Q4. The independent variables in the regressions are the demographics (gender, race and age), educational attainment, geographical location (province), broad industry category of the employed, and number of children, elderly and self-employed in the household. The results are presented in and for the self-employed and employees, respectively.
Table 7: Probit estimates of the likelihood of the self-employed being defined as informal, QLFS 2009Q4
Table 8: Probit estimates of the likelihood of employees being defined as informal, QLFS 2009Q4
Looking at the self-employed, the results from suggest that females and blacks are more likely to be classified as informal by all five methods, but the probability is the lowest using the revised Gasparini & Tornarolli method. This finding is consistent with what was observed in , i.e. the female and black shares of informal self-employed as defined by this method are lower. In addition, the age dummies suggest that the probability of being classified as informal decreases in the older age categories, except in the revised Gasparini & Tornarolli method. Furthermore, as expected, a higher educational attainment results in a lower likelihood of being classified informal. With regard to the influence of other explanatory variables, the self-employed are more likely to be classified informal if the number of elderly people living in the household increases, but the opposite happens if the number of children living in the household increases. Finally, the self-employed are less likely to be classified as informal if there are already a lot of other self-employed members present in the household. To conclude, the results of once again suggest that the revised Gasparini & Tornarolli method, using a worker characteristic – educational attainment – to define the informal self-employed, may have captured a different group of workers.
With regard to the employees, shows that females are more likely to be classified as informal, except when the revised Heintz & Posel method is adopted. This may explain the much lower female share of informal employees using this method (30.3%, compared with about 40 to 45% using the other methods, as shown in ). Being black is associated with a greater likelihood of being classified as informal by all five methods, while younger age groups are more likely to be classified as informal employees in general. Furthermore, higher levels of educational attainment coincide with a lower likelihood of being classified as informal, but this happens only where an employee has at least Matric using the Stats SA method A, revised Gasparini & Tornarolli and revised Henley et al. methods, and at least some secondary education using the revised Heintz & Posel method.
When it comes to the influence of other independent variables on the probability of the employees being classified as informal, the number of children and the number of elderly people in a worker's household have different impacts on this likelihood using different methods, as the sign of the coefficients is positive in some regressions but negative in others. These two coefficients are both negative only if the Stats SA method A and revised Heintz & Posel method are used. Finally, contrary to what was observed in the case of self-employed, employees are more likely to be classified as informal if the number of self-employed members in the household increases. However, this probability is higher using the revised Heintz & Posel method (5.7%) than using the other methods (between 1.6% and 2.5%). This positive relationship was also observed by Henley et al. Citation(2009) when looking at the likelihood of employees being classified as informal in the Brazilian economy.
5. Conclusion
There is limited consensus on how to define informal employment in South Africa. This paper reviews Stats SA methods for measuring informal employment before and after the introduction of the QLFS (Quarterly Labour Force Survey), as well as other recently proposed methods, to investigate the congruence, if any, between the various measures of the rate of informality. Econometric techniques are used to investigate commonalities and differences in the various ways the different measures of informality are associated with demographic, education, employment and household characteristics. The results suggest that estimates of informal employment are higher if the revised Gasparini & Tornarolli and the Stats SA method B are used in the case of the self-employed and employees respectively. Furthermore, the Gasparini & Tornarolli method may have captured a slightly different group of informally self-employed, as the black share and female share are clearly lower, but the mean years of educational attainment are higher. Finally, the rate of informality rises considerably with the application of Stats SA method B in the case of the employees.
Does this mean that South Africa will no longer be regarded an international outlier regarding the size of its informal economy if such a broad definition of informal employment is adopted, as in the Stats SA method B? No answer can be given to this question until such data are available by country.
Acknowledgements
The author gratefully acknowledges valuable comments by Roger Kaufman and Servaas van der Berg.
Notes
1This is also known as the legalists' view of the informal economy. Over the years, the diverging views have been categorised into three main schools of thought: the dualist school, the structuralist school and the legalist school (Chen, Citation2007:7; Bacchetta et al., Citation2009:40).
Notes: Citation[1] Stats SA 1995–2007 methodology in 2000–2007, and method A in 2008–2009. Citation[2] Stats SA method B in 2008–2009. Citation[3] Heintz & Posel approach in 2000–2007, and revised Heintz & Posel approach in 2008–2009. Citation[4] Gasparini & Tornarolli approach in 2000–2007, and revised Gasparini & Tornarolli approach in 2008–2009. Citation[5] Henley et al. approach in 2000–2007, and revised Henley et al. approach in 2008–2009.
Related Research Data
References
- Anderson, J H , 1998. "The size, origins, and character of Mongolia's informal sector during the transition". In: Policy Research Working Paper 1916 . Washington, DC: World Bank; 1998.
- Bacchetta, M , Ernst, E , and Bustamante, J P , 2009. "Globalization and Informal Jobs in Developing Countries". Geneva: World Trade Organization and International Labour Office; 2009.
- Bekkers, H , and Stoffers, W , 1995. Measuring informal sector employment in Pakistan: Testing a new methodology , International Labour Review 134 (1) (1995), pp. 17–36.
- Bernabè, S , 2002. "Informal employment in countries in transition: A conceptual framework". In: CASE paper 56 . London: Centre for Analysis of Social Exclusion; 2002.
- Blunch, N H , Canagarajah, S , and Raju, D , 2001. "The informal sector revisited: A synthesis across space and time". In: World Bank Social Protection Paper No. 0119 . Washington, DC: World Bank; 2001.
- Chen, M A , 2007. "Rethinking the informal economy: Linkages with the formal economy and the formal regulatory environment". In: DESA Working Paper No. 46, Department of Economic and Social Affairs . New York: United Nations; 2007.
- Devey, R , Skinner, C , and Valodia, I , 2003. Informal economy employment data in South Africa: A critical analysis . Presented at Proceedings of the TIPS & DPRU (Trade and Industrial Policy Strategies & Development Policy Research Unit) Forum. Johannesburg, 8–10, September.
- Devey, R , Skinner, C , and Valodia, I , 2006. "Definitions, data and the informal economy in South Africa: A critical analysis". In: Padayachee, V , ed. The Development Decade? Economic and Social Change in South Africa, 1994–2004 . Cape Town: HSRC (Human Sciences Research Council) Press; 2006.
- ECA (United Nations Economic Commission for Africa), 2008. "Informal sector, definition, concepts and weighting in African economies". In: A report discussed in the first meeting of the Statistical Commission for Africa . Addis Ababa: United Nations Economic Commission for Africa; 2008.
- Essop, H , and Yu, D , 2008a. "The South African informal sector (1997–2006)". In: Stellenbosch Working Paper Series No. WP03/2008 . Department of Economics/Bureau for Economic Research (BER), Stellenbosch University; 2008a.
- Essop, H , and Yu, D , 2008b. "Alternative definitions of informal sector employment in South Africa". In: Stellenbosch Working Paper Series No. WP21/2008 . Department of Economics/Bureau for Economic Research (BER), Stellenbosch University; 2008b.
- Fields, G S , 1975. Rural–urban migration, urban unemployment and underemployment, and job search activity in LDCs , Journal of Development Economics 2 (1975), pp. 165–87.
- Gasparini, L , and Tornarolli, L , 2007. "Labour informality in Latin America and the Caribbean: Patterns and trends from household survey microdata". In: CEDLAS Working Paper No. 46 . La Plata: Centre for Distributive, Labour and Social Studies; 2007.
- Gërxhani, K , 2004. The informal sector in developed and less developed countries: A literature survey , Public Choice 120 (3–4) (2004), pp. 267–300.
- Hart, K , 1973. Informal income opportunities and urban employment in Ghana , Journal of Modern African Studies 11 (1973), pp. 61–89.
- Heintz, J , and Posel, D , 2008. Revisiting informal employment and segmentation in the South African labour market , South African Journal of Economics 76 (1) (2008), pp. 26–44.
- Henley, A , Arabsheibani, G R , and Carneiro, F G , 2009. On defining and measuring the informal sector: Evidence from Brazil , World Development 37 (5) (2009), pp. 992–1003.
- Hussmanns, R , 2005. "Measuring the informal economy: From employment in the informal sector to informal employment. Working Paper No. 53, Policy Integration Department, Bureau of Statistics". Geneva: International Labour Organization (ILO); 2005.
- ILO (International Labour Organization), 2004. "Employment in the Informal Economy in the Republic of Moldova". Geneva: ILO; 2004.
- Kershoff, G J , 1996. "The informal sector in South Africa. BER Occasional Research Paper 1996/1". Stellenbosch: Bureau of Economic Research; 1996.
- Kingdon, G G , and Knight, J , 2004. Unemployment in South Africa: The nature of the beast , World Development 32 (3) (2004), pp. 391–408.
- Kingdon, G G , and Knight, J , 2007. Unemployment in South Africa, 1995–2003: Causes, problems and policies , Journal of African Economics 16 (5) (2007), pp. 813–48.
- Maloney, W F , 2006. "Informality". In: Deconstructed. Mimeo . Washington, DC: World Bank; 2006.
- Mazumdar, D , 1976. The urban informal sector , World Development 4 (8) (1976), pp. 655–79.
- Muller, C , 2003. "Measuring South Africa's informal sector: An analysis of national household surveys". In: DPRU Working Paper 03/71 . Development Policy Research Unit, University of Cape Town; 2003.
- Naik, A K , 2009. Informal sector and informal workers in India . Presented at Proceedings of the IARIW-SAIM (Association for Research in Income and Wealth–South Asian Institute of Management) Conference on Measuring the Informal Economy in Developing Countries. 23–26, September.
- Palmade, V , and Anayiotos, A , 2005. "Rising Informality". In: Policy for the Private Sector: Note 298 . Washington, DC: World Bank; 2005.
- Perry, G E , Maloney, W F , Arias, O S , Fajnzylber, P , Mason, A D , and Saavedra-Chanduvi, J , 2007. "Informality: Exit and Exclusion". Washington, DC: World Bank; 2007.
- Portes, A , and Blitzer, S , 1986. The urban informal sector in Uruguay: Its internal structure, characteristics, and effects , World Development 14 (6) (1986), pp. 727–41.
- Rogerson, C M , 2004. The impact of the South African government's SMME programmes: A ten-year review (1994–2003) , Development Southern Africa 21 (5) (2004), pp. 765–84.
- Stats SA (Statistics South Africa), 2006. Statistical Release P0210. Labour Force Survey, September 2006. Stats SA, Pretoria..
- Stats SA (Statistics South Africa), 2008. Guide to the Quarterly Labour Force Survey. Stats SA, Pretoria..
- Tokman, V E , 1982. Unequal development and the absorption of labor. CEPAL (Comisión Económica para América Latina y el Caribe) , Review 17 (1982), pp. 121–33.