Abstract
This paper aims to determine the degree to which class and socio-economic background influence a child's life chances and their future perspectives. We build on the growing number of papers that deal with the concept of inequality of opportunity. Comparing children from lower and upper middle-class households we find significant differences in terms of access to basic education, sanitation, clean water and mobility. Our multivariate analysis highlights the importance of class membership for schooling outcomes and labour market prospects of a child. The single most important variable to explain schooling outcomes is mother's education. While income seems to be less important for younger ages, it becomes increasingly important for the chances of reaching matric and obtaining tertiary education. The results are robust for various models and panel data.
1. Introduction
According to Du Toit & Kotzé (Citation2011:77), ‘formal equality in South Africa was achieved by constitutional ruling, but actual socioeconomic quality, however, was not’. This simple statement points to one of the core problems in South African society after the political transition, namely the lack of substantive economic inclusion following political liberalisation.Footnote2 Almost two decades since the end of apartheid, poverty has retained its strong racial dimensions. This remains the state of affairs despite the elimination of formal discriminatory rules and legislation.
While poverty has remained very concentrated amongst blacks, there has however been some evidence of improved social mobility at the top end of the income distribution, attested to by an increase in the black share of affluence. Consequently, there has been rising inequality within the racial groups, with a sharp increase in the Gini coefficient of both the white and the black population groups in the post-apartheid period (Leibbrandt et al., Citation2010; Yu, Citation2010; Van der Berg, Citation2011).
There is comprehensive literature about inequality and poverty in South Africa, including income inequality, poverty (Hoogeveen & Özler, Citation2006; Leibbrandt et al., Citation2010; Özler, Citation2007) and education inequality (Lam et al., Citation2011, Van der Berg, Citation2007, Citation2009). Other literature dealt with the concept of classes and the rising black middle class (Seekings & Nattrass, Citation2005; Gornick & Jäntti, Citation2013). While the concept of inequality or class is rather static, this paper uses the more dynamic concept of inequality of opportunity. This approach has the advantage that it gives a prediction of future inequality by looking at inequality of opportunity within children. Even within a very unequal society, inequality is more tolerable if opportunities are equal to future generations.
This paper adds to the existing literature by combining the concept inequality of opportunity and class. While there are some studies looking at inequality of opportunities in terms of service delivery (e.g. World Bank, Citation2012), this paper more explicitly looks at how parental background and class influence opportunity of their offspring. Such a focus is insightful and useful because studies have shown that gaps which emerge early in life tend to be permanent and often widen further over the lifecycle (Heckman, Citation2000). Additionally, this focus may also be strategic because there is an increasing body of evidence in support of early invention and this has also garnered policy prominence in South Africa and internationally. This paper evaluates access to opportunities in South Africa by comparing the opportunities of individuals from different socio-economic backgrounds at different life stages, in terms of access to basic amenities and goods such as clean water and food at a young age, reaching matric or obtaining tertiary education, and finding employment as an adult. The paper shows that class and socio-economic background have a dramatic influence on a child's life chances in terms of these criteria and that such opportunities affect a child's starting point in life. Our multivariate analysis highlights the importance of class membership for schooling outcomes and labour market prospects of a child.
2. Theory and literature review
This section of the paper provides a short review of the literature and the concept of inequality of opportunity. In the past two decades, several studies have observed socio-economic and intergenerational mobility; for example, Corak (Citation2006) has shown in an international comparison that children from low-income families become low-income earners. More recently, other researchers have focused attention on the conceptual issue of mobility and on the notion of equality of opportunity (e.g. Paes de Barros et al., Citation2009; Bourguignon et al., Citation2007; Ferreira & Gignoux, Citation2011). For South Africa, a paper by Burns & Keswell (Citation2011) focuses on intergenerational persistence of educational status in KwaZulu-Natal, and finds that such persistence has increased over generations, while a paper by the World Bank (Citation2012) observes inequality of opportunity among children in South Africa using the Human Opportunity Index (HOI). Another paper comparing two different measures for inequality of opportunity in a number of different countries including South Africa by Brunori et al. (Citation2013) concludes that most differences in inequality of economic opportunity arise from exogenous factors such as family background, race or gender and not due to individual effort. Finally, a further paper by Piraino (Citation2012) developed a method to measure inequality of opportunity in South Africa.
Most of the research regarding inequality of opportunity is motivated as a theory of fairness and justice. Commencing with Rawls's (Citation1971) A Theory of Justice and Sen's (Citation1980) Tanner Lectures, political philosophers and economists have discussed the appropriate sphere wherein equality should be promoted. A key development in this discussion is the incorporation of a central role for personal responsibility into the definition of fairness (Ferreira et al., Citation2011); that is, equality of opportunity is often described as an ideal compromise between different perspectives on equity, because it retains the vital dimensions of egalitarianism, while simultaneously allowing for differences in outcomes based on effort, merit and other relevant criteria. Allowing outcomes to differ is critical because this entails that choices can have consequences, and consequences can in turn help to inform and reward individuals' behaviour.
This analysis will follow the approach by John Roemer (Citation1998), who acknowledges this tension between egalitarianism and effort by differentiating between two potential sources of unequal outcomes, namely circumstances (factors exogenous to the person, such as gender, race, family background or place of birth) and individual efforts (outcome determinants that can be affected by individual choice). Essentially, this forms the basis of a simple binary view of the fairness of life chances. Within this conceptual framework, a level playing field is one where one's fate is largely determined by one's own efforts, rather than being determined by inherited factors and circumstances such as one's family background, gender or race.
Our approach acknowledges the New-Weberian school, in as much as we wish to ascertain the extent to which factors such as inequality of life chances among individuals and families are structured on the basis of class. One central claim in the New-Weberian tradition is that variations in market positions arise out of differences in the possession of market-relevant assets that determine life chances. Inspired by this work, instead of merely investigating how life chances limit choices, we invert the question and investigate how class influences the ability to escape from poverty and enables the next generation to form their own choices.
3. Data
The two panel studies used in this paper are KwaZulu-Natal Income Dynamics Study (KIDS) and National Income Dynamics Survey (NIDS). Most of the analysis conducted in this paper comes from the first wave of NIDS. The first representative national panel study, conducted by the Southern Africa Labour and Development Research Unit at the University of Cape Town, NIDS is a large and representative survey, with 31 163 individual observations and 6921 households in 2008. The survey includes detailed information about living conditions, education, household formation, occupation, income and expenditure. In addition, it includes various questions on subjective well-being and satisfaction levels. Consequently, we can use this dataset to compare the living conditions, education and labour market outcomes as well as self-perception for a representative sample of youths, coming from different class backgrounds.
The only disadvantage of NIDS is that it covers a relatively short time period, spanning four years. For this reason, we also test our findings using KIDS, a three-wave panel dataset spanning the first decade of South Africa's democracy. However, KIDS only covers the province of KwaZulu-Natal and is limited to black and Indian households, thereby excluding households with coloured or white heads due to likely sampling bias (see Agüero et al., Citation2007). However, Woolard & Klasen (Citation2005) show that the African population in KwaZulu-Natal are comparable with Africans elsewhere. Overall attrition is reasonable, with 1132 households (83.6%) having been successfully re-interviewed for the second wave in 1998 (Adato et al., Citation2006). For the third wave in 2004, some 74% of the households contacted in 1998 were re-interviewed. In total, 841 households could be successfully interviewed through all three survey waves. Having a time span of 11 years allows one to test for the robustness of the results from NIDS dataset and to control for potential endogeneity.
4. Estimating inequality of opportunity at various life stages
In this section of the paper we will examine life chances by comparing the respective opportunities of young school children, emerging adults and young adults from different socio-economic classes and backgrounds. Comparing the opportunities of young children from privileged and disadvantaged backgrounds is informative because young individuals have had limited opportunity to differentiate themselves based on effort and hard work, thus differences in opportunities between them are largely attributable to differences in the circumstances into which they were born. Further, the level of education is of particular interest due to its strong correlation with life chances (Burns & Keswell, Citation2011). We believe that looking at emerging adults and their school to work transition is particularly of interest in the case of South Africa where youth unemployment is exceptionally high.
4.1 Circumstances and opportunities of young children
Access to key goods and services such as clean water, basic education, health services, minimum nutrition and citizenship rights is crucial to allow individuals to pursue a life of their own choosing (World Bank, Citation2010:32). Providing children with a complete set of basic opportunities is essential in affording them the opportunity to make their own life choices and to realise their productive potential.
considers the likelihood that children aged between 10 and 14 would live in certain circumstances and would reach various benchmarks based on their socio-economic background. To this end, we compare the life chances of a child from lower-class households with those of upper middle-class households. For the purposes of the subsequent analysis, a household is defined as ‘lower class’ if it belongs to the bottom two quintiles, and neither parent has completed primary education. A household is classified as ‘upper middle class’ if it belongs to the richest income quintile, at least one biological parent live in the household and at least one parent has completed high school or achieved a higher education. Choosing the cut-off lines for the class analysis is somehow arbitrary since there are many different ways to define the ‘middle class’ in the literature (Hertova et al., Citation2010) and different approaches do not identify the same people as middle class in South Africa (see Visagie & Posel, Citation2013). We follow the approach of Easterly (Citation2001) and Barro (Citation1999) and other studies and use income deciles as well as parent education.
Figure 1: Estimated probability of reaching various benchmarks for children from different socio-economic background (age 10 to 14)
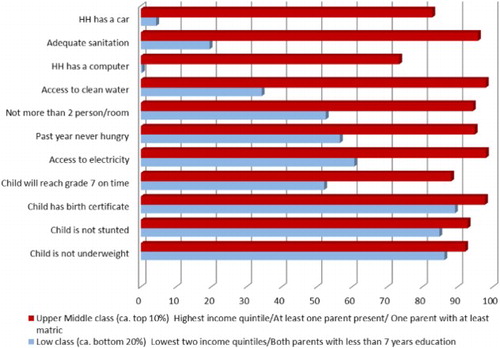
In most cases – apart from reaching Grade 7 on timeFootnote3 – these circumstances and benchmarks are not under the direct control of these children and differences should therefore be interpreted as indicative of inequalities that cannot be attributed to effort.
The resultsFootnote4 show that living in a disadvantaged household reduces the chances of reaching Grade 7 on time by about 36 percentage points (52% vs. 88%). Children completing Grade 7 on time are more likely to have had access to schools of reasonable quality and can avoid unnecessary grade repetition (World Bank, Citation2010:45). However, some provinces in South Africa do not endorse grade repetition, which might lead to an underestimation or mis-estimation of inequality of school quality when using this measure.
The outcome differences are even more pronounced in terms of the chances of a child from a poor socio-economic background living in a household with access to adequate sanitation (20% vs. 96%) and clean water (34% vs. 98%).Footnote5 Having access to clean water and sanitation are important factors in determining susceptibility to serious illnesses like cholera. For example, Mugero & Hoque (Citation2001) find that contaminated water and low latrine coverage are key risk factors for a cholera epidemic in affected rural areas. The chances of having access to a car (4% vs. 83%) or a computer (0.4% vs. 73%) are close to zero for children from lower class background. On the other hand, there seem to be only small differences in the likelihood of the child being underweight (six percentage point difference) or being stunted (eight percentage point difference) between children from lower and upper middle-class households.
In terms of living conditions, the likelihood that a child will live in an overcrowded household (more than two people per room) and with no electricity (a key factor enabling a child to read and do homework when it is dark) is between 38 and 42 percentage points higher when the child is from a lower class background. These children also face a much higher likelihood of being hungry. Our results are in line with the findings of the Word Bank (Citation2012) study: for the chosen set of basic goods we find significant differences in the access for children from different backgrounds.
As shows, socio-economic class has a very marked influence on the opportunities and circumstances of children. The literature suggests that these circumstances and opportunities mean that young children from disadvantaged and deprived households have a very different starting point in life than young children from upper middle-class households.
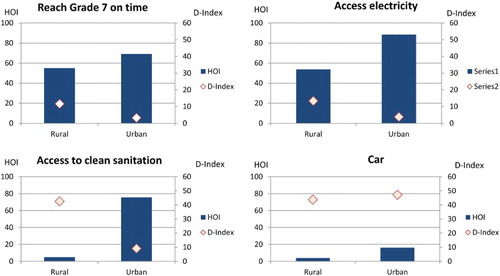
To further examine the origins of the observed differences, we adopt the HOI used in several studies by the World Bank (Citation2010, Citation2012) to explore inequality of opportunity for children. The HOI measures in a single indicator the absolute coverage rate of a particular service, adjusted by how equitably the available services are distributed among groups differentiated by circumstance (World Bank, Citation2012:18). The first part, the average coverage rate, can be directly adopted using household survey data. The second part uses a dissimilarity index (D-Index), which measures the dissimilarity of access rates for a given service for groups defined by the circumstance characteristics (race, location, gender, etc.), compared with the average access rate of the whole population (World Bank, Citation2010).
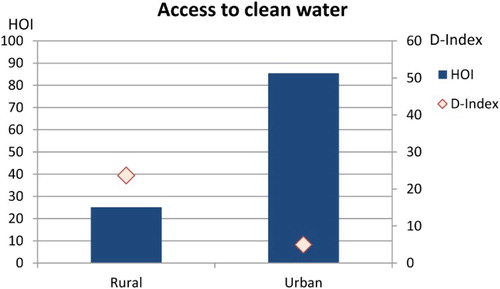
shows the HOI and the D-Index for access to clean water. While a HOI of 100 points would indicate universal access, zero points mean that there is no access to clean water at all. The HOI bar for urban children has a value of about 85 points and the D-Index is about five points. Therefore, water coverage rates are high in urban areas and the differences in opportunities are not based on circumstances. In contrast, the HOI has only a value of about 25 points, indicating much lower access rates in rural areas. In addition, the D-Index has a value of 40 points which indicates that about 40% of opportunities are inequitably allocated among circumstance groups.
Figure 2: HOI and D-Index for access to clean water for children (age 10 to 14)
in Appendix A shows significant differences for all infrastructure services in access to the services and the inequality within circumstance groups. Especially stark are the results for access to proper sanitation, which is nearly absent in rural areas and very unequally distributed. While the possession of cars is highly influenced by their circumstances, there are no major differences between children from rural and urban areas. The same patterns hold for computers. These differences in possessions can be partly explained by an asset deficit of the black population who could not accumulate wealth during the apartheid period. Finally, for rural children, finishing Grade 7 on time is less likely and more dependent on background.
The next section focuses on the next stage in people's lives, examining how socio-economic class and background affect outcome variables such as reaching matric, accessing tertiary studies and securing employment in later adolescent life stages.
4.2 Schooling, skill achievement and life satisfaction in emerging adulthood
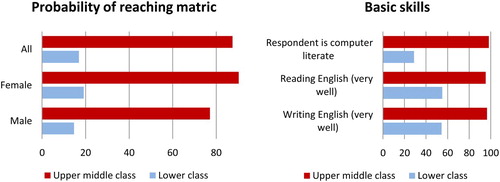
illustrates that the likelihood of an emerging adultFootnote6 reaching matric by the age of 19 or 20 vastly differs between those from a poor socio-economic background and those from upper middle-class households (17% vs. 88%). For male students from disadvantaged backgrounds, the probability is lower than 15%. In addition, there are significant differences in the self-reported ability to read and write English competently and in computer literacy. Such skills are very likely to be relevant for the individual's labour market prospects.
Figure 3: Education differences for emerging adults by socio-economic background (age 19 to 20)
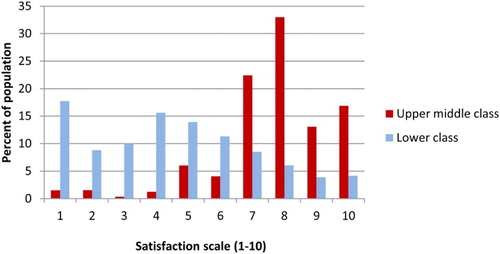
suggests that the disparities in the opportunities and circumstances of these emerging adults affect their life satisfaction. On a satisfaction scale (from one to 10, 10 being most satisfied), emerging adults with upper middle-class parents report considerably higher average satisfaction levels than those with lower class parents. These differences could be attributed to anticipated life circumstances, their current living conditions or a combination of the two. It is telling that such stark differences in reported happiness and life satisfaction can already be discerned at such early stages of these individuals' lives.
Figure 4: Life satisfaction of emerging adults from different parental class (age 17 to 20)
4.3 Young adults and labour market prospects
illustrates the chance a young adult (aged 21 to 25) has of reaching matric, achieving a tertiary qualification and obtaining employment (left-hand panel). Again, those from a lower class household have a considerably lower likelihood of reaching matric by this age than those with upper middle-class parents (19% vs. 77%). Similarly, the likelihood of obtaining some tertiary education is extremely low (1% vs. 50%). Consequently, these individuals also face a much higher likelihood of not finding employment (46% vs. 15%). Yet young adults from an upper middle-class background are more likely to be attending university, which might overestimate the difference. However, they will have a higher likelihood of being offered employment with the completion of their studies.
Figure 5: Likelihood of a young adult (21 to 25) reaching matric, obtaining some tertiary education and not finding employment
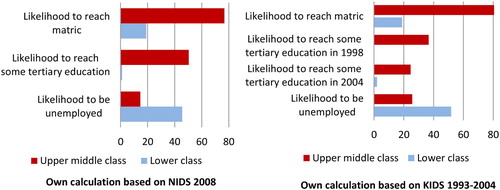
The first wave of NIDS in 2008, however, can only provide a description and no causal correlations. For this reason, we test the robustness of these findings using KIDS 1993–2004. Here we estimate the likelihood that, dependent on the socio-economic class of their parents, a child aged between seven and 17 in 1993 will reach matric or some tertiary education in 2004 or 1998. The results correspond with NIDS findings: a child who lived with lower class parents in 1993 has only a 19% chance of reaching matric in 2004, while a child with upper middle-class parents has an 82% chance. Additionally, the analysis shows that a child with lower class parents has a near-zero chance of accessing tertiary education.
While these results appear to confirm and support the results from the cross-section, we need to note that younger household members who left the household were not followed by KIDS panel, and therefore children leaving the household to pursue tertiary opportunities may often disappear from the sample. This may also help explain why KIDS shows that fewer students accessed tertiary education in 2004 than in 1998.
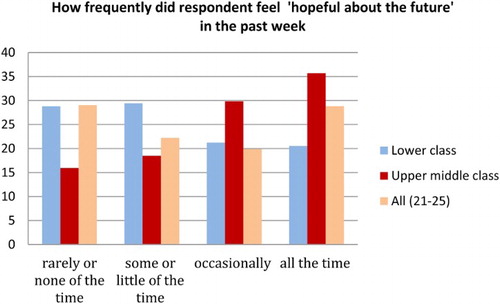
Finally, illustrates the level of optimism reported by respondents of this age group regarding their future. Here again, we detect notable differences between the reported optimism of young adults from lower and those from upper middle-class households.
Figure 6: Respondent's future perspective (age 21 to 25)
Another indicator of self-perception that further highlights the role of socio-economic background is the reservation wage: the lowest wage at which people would be willing to work in the labour market. In NIDS 2010 the reservation wage is identified by the following question: ‘What is the absolute lowest monthly take-home wage that you would accept?’. There are some concerns (e.g. Kingdon & Knight, Citation2001) that responses to reservation wage questions in survey data are not very reliable. However, since the regression results are in line with economic theory, we believe responses to reservation wages and true economic behaviour are significantly correlated.
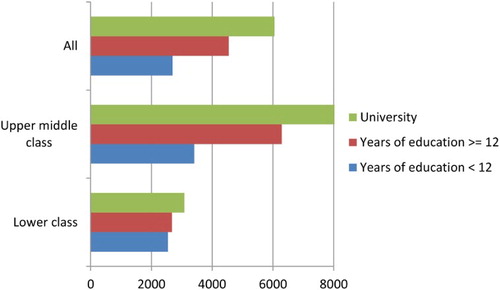
As illustrated in , coming from a poor socio-economic background reduces the reservation wage of young adults quite dramatically. While young adults with an upper middle-class background who went to university have a median reservation wage of about R12 000, the median reservation wage is only about R3000 for their lower class counterparts. This might be explained either by young adults with a better socio-economic background being able to afford to wait for a high-paying job, or that they have a better self-perception of their true ‘market value’, since they are able to compare themselves with their parents.
Figure 7: Median reservation wage for young adults (age 21 to 35)
4.4 Regression analysis
Identifying the factors that explain differences in early school performance is important to understand life opportunities and social mobility. Without access to a good education, children's choices will be severely constrained. There are two plausible ways through which parental education can influence their children's school performance: a direct effect through inherited genetics (intergenerational ability), and an indirect effect via support, assistance and encouragement (parents with higher education will value school quality and education more highly and are able to help their children to perform well at school) (Buis, Citation2012).
In , column (1) illustrates the results of a linear regression estimating the likelihood of reaching Grade 7 on time.Footnote7 Note the convex relationship indicated by the significance of the coefficient on the squared value of the mother's education; the father's education has a positive coefficient but is not significant. Hence, a mother's education seems to have a significantly greater influence than a father's education, a finding that corresponds to other studies (Lam et al., Citation2011; Burns & Keswell, Citation2011; Buis, Citation2012). If parental education works either through helping children perform well at school or through the transmission of cultural capital, one would expect that a mother's education has a stronger effect, since the mother traditionally spends most time with the children (Buis, Citation2012:6).
Table 1: School outcome regressions
The model also shows that on average female students perform significantly better than male students. The same is true for children from a coloured and Indian background. On average, white students do not have a better school record in early life stages, ceteris paribus. This means black children have the same grade progression in early life stages if they have similar socio-economic background, something that often does not apply.Footnote8 The number of children in a household is negatively correlated with the likelihood of reaching Grade 7 on time, whereas household income has a positive but insignificant impact (richer parents may send their children to better quality schools, which may not be reflected in school repetition by Grade 7).
Column (2) of illustrates that the education levels of parents are positive and significantly correlated with the likelihood of reaching matric by the ages of 19 to 20. Again, the mother's education squared term is highly significant and positive, indicating convex returns on a mother's education.
In comparison with the first regression, it is notable that per-capita household income is now larger and significant. Therefore, while in the early life stages education seems to be heavily dependent on the mother's education, income becomes more important in explaining differences in later outcomes of the school career.
The next analysis focuses on factors that determine whether or not a young adult will reach some tertiary education by the ages of 20 to 26. Since South Africa generally has strong convex returns on education, achieving tertiary education is an important factor associated with good prospects in the labour market. The results of , column (1) are in line with our earlier findings, namely the importance of parents' education and household income. Note the highly significant squared term on household income, indicating that richer households are much more likely to enable their children to get some tertiary education. These results stand in opposition to the findings of a study by Lam et al. (Citation2010), who do not find strong credit restraints for South African students. However, their study is confined to students from the Western Cape participating in the Cape Area Panel Study, and regressions control for test results.
Table 2: Tertiary education regression
To test the robustness of our results, we use the panel option of NIDS to follow those students enrolled in school during 2007/08 and note who is making the transition into tertiary education. The results of the panel regression shown in in Appendix A confirm that parents' education is one important factor. We also note that the coefficient for household income is twice the size in , column (2). Household income therefore seems to have a larger impact on the likelihood of pursuing tertiary education than achieving matric. In addition, in the coefficient for white is negative, which seems to be surprising. Yet, when splitting tertiary education into university and other forms of further education, the white coefficient is no longer negative or significant when looking at university education only.
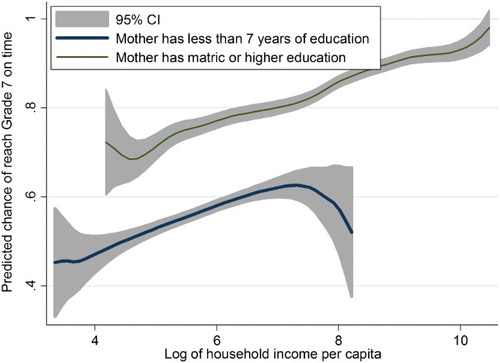
and show a graphic illustration of the model. In the first graph one can see a large increase in the probability of reaching Grade 7 on time (cf. reaching Grade 7 by the age of 14), when the mother has more than 12 years as opposed to less than seven years of education. This highlights the importance of mother's education, independent of the income of the household. Furthermore, the size of the confidence interval emphasises that there is much less unexplained variation when a mother has more than 12 years of education.
Figure 8: Correlation between mother's education/income quintile and reaching Grade 7 on time, derived from regression results (see )
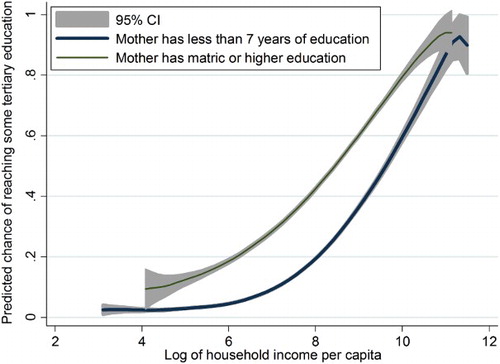
illustrates the influence that a mother's education and living in an upper middle-class household has on accessing tertiary education. The two graphs show that income explains much more of the likelihood of reaching tertiary than lower levels of education. For poor households (below R500 per-capita income), the chances of accessing tertiary education remain slim (below 10%) even with a mother that achieved 12 years of education. However, for individuals with per-capita income above R25 000, the probability of accessing a tertiary institution exceeds 90%, ceteris paribus. The figure also shows virtually no chance of reaching tertiary education for a child with a mother who has less than seven years of education and where the household's per-capita income is below R1000 per month.
Figure 9: Correlation between mother's education/income quintile and reaching some tertiary education, derived from regression results (see )
Finally, illustrates the results of a reservation wage regression to determine which factors influence the minimum income wage a young adult would work for. As expected, for South Africa there are convex returns to education, and therefore obtaining higher education will significantly increase the reservation wage. Secondly, the reservation wage is significantly higher for adults with well-educated parents. It is interesting to note that even for the reservation wage the mother's education seems to be more important than the father's. Most importantly, per-capita household income is significantly positive. While it seems obvious that while an individual is working his/her salary will determine the reservation wage, in column (3) we see that household income influences the decision even when the young adult is unemployed. In addition, it seems that coloureds and whites have significantly higher reservation wages, while females would work for a lesser amount than men, on average ceteris paribus.
Table 3: Reservation wage regression
5. Conclusion
This paper's aim was to determine the degree to which class and socio-economic background influence a child's life chances and their future perspectives. Using NIDS 2008 we found significant differences for children from lower and upper middle-class households in terms of access to sanitation, clean water, mobility, and so forth. In terms of their education, children are much more likely to reach Grade 7 on time when parents and especially mothers are well educated. While income seems to be less important for younger ages, it becomes increasingly important for the chances of reaching matric and obtaining tertiary education. Socio-economic background plays a major role in explaining who enters university and who does not. The results are robust for various models and panel data. Finally, our results show that people have much higher expectations of the labour market and therefore higher reservation wages when coming from a higher socio-economic background, even when controlling for education.
In conclusion, the findings of severe inequality of opportunity for South African youth show the urgency of further interventions. Studies have shown that early intervention at the childhood level might be most effective in increasing healthy physical, emotional, social and cognitive development (e.g. Heckman, Citation2006). Reducing inequality of opportunity will not only make sure South Africa becomes a more fair society, but will also reduce the inequality gap of future generations.
Acknowledgements
Many thanks go to Ronelle Burger and Servaas van der Berg for their helpful inputs and comments throughout this project.
Notes
2This statement refers to the public discourse claiming that participation in the labour market and a movement out of unemployment has not been realised.
3 Which is defined as being in the right class for a child's age.
4The estimations reported are based on NIDS 2008.
5Access to clean water is defined as having a piped water tap in the dwelling, on site or in the yard. Clean sanitation is defined has having either a flush or chemical toilet.
6The term ‘emerging adult’ was coined by Arnett (Citation2000) for late teens to mid-twenties. In this analysis we used the age group 19 to 20.
7A linear model is used since it can be straightforwardly interpreted. As a robust check we also run a logit model (see in Appendix A).
8Note that the outcome variable only measures school attainment despite differences in the quality of education the average black and white child receives. This does not mean increasing the average income of black households will solve all school problems in South Africa. We know that there are strong school fixed effects and that the traditional black part of the school system is significantly underperforming.
References
- Adato, M, Carter, M & May, J, 2006. Exploring poverty traps and social exclusion in South Africa using qualitative and quantitative data. Journal of Development Studies 42(2), 226–47. doi: 10.1080/00220380500405345
- Agüero, J, Carter MR & May, J, 2007. Poverty and inequality in the first decade of South Africa's democracy: What can be learnt from Panel Data from KwaZulu-Natal? Journal of African Economies 16(5), 782–812. doi: 10.1093/jae/ejm015
- Arnett, JJ, 2000, Emerging adulthood: A theory of development from the late teens through the twenties. American Psychologist 55(5), 469–80. doi: 10.1037/0003-066X.55.5.469
- Barro, R, 1999. Determinants of democracy. Journal of Political Economy, 107(6), 158–183.
- Bourguignon, F, Ferreira, F & Menéndez, M, 2007. Inequality of opportunity in Brazil. Review of Income and Wealth 53(4), 585–618. doi: 10.1111/j.1475-4991.2007.00247.x
- Brunori, P, Ferreira, FH & Peragine, V, 2013. Inequality of opportunity, income inequality and economic mobility: Some international comparisons. Policy Research Working Paper 6304, The World Bank, Development Research Group.
- Buis, ML, 2012. The composition of family background: The influence of the economic and cultural resources of both parents on the offspring's educational attainment in the Netherlands between 1939 and 1991. European Sociological Review 29(3), 593–602. doi: 10.1093/esr/jcs009
- Burns, J & Keswell, M, 2011. Inheriting the future: Intergenerational persistence of educational status in KwaZulu-Natal. Economic History of Developing Regions 27(1), 150–75. doi: 10.1080/20780389.2012.682403
- Corak, M, 2006. Do poor children become poor adults? Lessons from a cross-country comparison of generational earnings mobility. Dynamics of Inequality and Poverty. Research on Economic Inequality 13, 143–88. doi: 10.1016/S1049-2585(06)13006-9
- Du Toit, P & Kotzé, H, 2011. Liberal democracy and peace in South Africa: The pursuit of freedom as dignity. Palgrave Macmillan, New York.
- Easterly, W, 2001. The middle class consensus and economic development. Journal of Economic Growth, 6(4), 317–335.
- Ferreira, FHG & Gignoux, J, 2011. The measurement of inequality of opportunity: Theory and an application to Latin America. Review of Income and Wealth 57(4), 622–57. doi: 10.1111/j.1475-4991.2011.00467.x
- Ferreira, FHG, Gignoux, J & Aran, M, 2011. The measurement of inequality of opportunity with imperfect data: The case of Turkey. Journal of Economic Inequality 9, 651–80. doi: 10.1007/s10888-011-9169-0
- Gornick, J & Jäntti, M (Eds), 2013. Income inequality: Economic disparities and the middle class in affluent countries. Stanford University Press, Stanford.
- Heckman, J J, 2000. Policies to foster human capital. Research in Economics 54(1), 3–56. doi: 10.1006/reec.1999.0225
- Heckman, JJ, 2006. Skill formation and the economics of investing in disadvantaged children. Science 312(5782), 1900–2. doi: 10.1126/science.1128898
- Hertova, D, López-Calva, LF & Ortiz-Juarez, E, 2010. Bigger … but stronger? The middle class in Chile and Mexico in the last decade. Research for Public Policy, Inclusive Development, ID-02-2010, RBLAC-UNDP, New York.
- Hoogeveen, JG & Özler, B, 2006. Poverty and inequality in post-apartheid South Africa: 1995–2000. In Bhorat, H & Kanbur, R (Eds.), Poverty and policy in post-apartheid South Africa. HSRC, Cape Town.
- Kingdon, G & Knight, J, 2001. What have we learnt about unemployment from microdatasets in South Africa? Social Dynamics 27(1), 79–95. doi: 10.1080/02533950108458705
- Lam, D, Ardington, C, Branson, N, Goostrey, K & Leibbrandt, M, 2010. Credit constraints and the racial gap in post-secondary education in South Africa. Presented at annual meeting of Population Association of America, 15–17 April, Dallas, TX.
- Lam, D, Ardington, C & Leibbrandt, M, 2011. Schooling as a lottery: Racial differences in school advancement in urban South Africa. Journal of Development Economics 95(2), 121–36. doi: 10.1016/j.jdeveco.2010.05.005
- Leibbrandt, M, Woolard, I, Finn, A & Argent, J, 2010. Trends in South African income distribution and poverty since the fall of apartheid. OECD Social, Employment and Migration Working Papers 101, OECD, Paris.
- Mugero, C & Hoque, A, 2001. Review of Cholera Epidemic in South Africa, with Focus on KwaZulu-Natal Province. Provincial DoH, KwaZulu-Natal.
- Özler, B, 2007. Not separate, not equal: Poverty and inequality in post-apartheid South Africa. Economic Development and Cultural Change 55(3), 487–529. doi: 10.1086/511191
- Paes de Barros, R, Ferreira, FHG, Molinas Vega, JR & Saavedra Chanduvi, J, 2009. Measuring inequality of opportunities in Latin America and the Carribean. World Bank, Washington, DC.
- Piraino, P, 2012. Inequality of opportunity and intergenerational mobility in South Africa. Paper presented at the 2nd World Bank Conference on Equity, 27–28 June, Washington, DC.
- Rawls, J, 1971. A theory of justice. Harvard University Press, Cambridge, MA.
- Roemer, JE, 1998. Equality of opportunity. Harvard University Press, Cambridge, MA.
- Seekings, J & Nattrass N, 2005. Class, race and inequality in South Africa. Yale University Press New, Haven, CT.
- Sen, A, 1980. Equality of what? In McMurrin, S (Ed.), Tanner lectures on human values. Cambridge University Press, Cambridge.
- Van der Berg, S, 2007. Apartheid's enduring legacy: Inequalities in education. Journal for African Economies 16(5), 849–80. doi: 10.1093/jae/ejm017
- Van der Berg, S, 2009. The persistence of inequalities in education. In Aron, J, Kahn, B & Kingdon, G (Eds), South African economic policy under democracy. Oxford University Press, Oxford, pp. 327–54.
- Van Der Berg, S, 2011. Current poverty and income distribution in the context of South African history. Economic History of Developing Regions 26(1), 120–40. doi: 10.1080/20780389.2011.583018
- Visagie, J & Posel, D, 2013. A reconsideration of what and who is middle class in South Africa. Development Southern Africa 30(2), 149–67. doi: 10.1080/0376835X.2013.797224
- Woolard, I & Klasen, S, 2005. Determinants of income mobility and household poverty dynamics in South Africa. Journal of Development Studies 41(5), 865–97. doi: 10.1080/00220380500145313
- World Bank, 2010. How far are we from ensuring opportunities for all? The human opportunity index. The World Bank, Washington, DC.
- World Bank, 2012. South Africa economic update: Focus on inequality of opportunity. The World Bank Group Africa region poverty reduction and economic management, (3). The World Bank, Washington, DC.
- Yu, D, 2010. Poverty and inequality trends in South Africa using different survey data. Working Papers 04/2010, Stellenbosch University, Department of Economics.
Appendix A
Figure A1: HOI for access to selected key basic goods for children age 10 to 14