Abstract
Two very different pictures emerge when one compares income changes of the relatively affluent ‘middle class' with those of households in the literal middle of the income spectrum. In the affluent middle there has been significant racial transformation and growth of the ‘black middle class'. However, households in the actual middle of the income spectrum have experienced the lowest income growth of all groups since 1993. Both perspectives are crucial in the pursuit of a more equitable path of development and have important implications for policy design.
1. Introduction
Any discussion of changes in the income status of the middle class in South Africa depends on how the term ‘middle class’ is defined. In previous work (Visagie & Posel, Citation2013), I have shown how the common practice of defining the middle class as ‘the relatively affluent’ is inconsistent with a focus on those in the actual middle of the distribution of income. Widespread poverty and income inequality in South Africa imply that households which are in the middle in terms of their income status are still a long way off from what is deemed a middle-class standard of living. In fact, those in the middle still are quite poor.
However, holding these two perspectives (the median versus affluent middle class) in tension provides novel insight into the nature of South African income growth over the first 15 years of democracy, with important implications for policy. In this article, I track changes that have taken place in these two different ‘middle class' groups since 1993 and ask: have they become better off? The answer to this question provides novel insight into changes in the income landscape in the country.
The remainder of the article is structured as follows. Section 2 provides a brief context of the importance of the middle class and of relevant policy in South Africa. Section 3 discusses an ‘affluence-based’ and a ‘median-based’ definition of the middle class and outlines the household survey income data used in the study. Section 4 presents descriptive findings on changes in the size and demographic composition of the affluent middle class over the period 1993–2008, whereas Section 5 contrasts these findings with an evaluation of income growth of households in the actual middle. The final section draws out the implications for policy design.
2. The importance and the politics of the middle class
The middle class is considered to provide a range of key functions for the economic growth and development of a country. These functions include: providing a base of growing human capital (Galor & Zeira, Citation1993; Perotti, Citation1996; Sokoloff & Engerman, Citation2000), through attitudes and behaviours specific to the middle class (such as savings and entrepreneurship) (Landes, Citation1998; Doepke & Zilibotti, Citation2005), as the primary driver of domestic consumption (Brown, Citation2004; Bhalla, Citation2007; Pressman, Citation2007; Kharas & Gertz, Citation2010), holding government accountable (Kharas & Gertz, Citation2010; African Development Bank, Citation2011) and promoting political stability (Barro, Citation1999; Easterly, Citation2001, Citation2007).
However, the above summary of the importance of the middle class for economic development hides fairly obvious contradictions in the way in which this group is used and defined across each of these studies. Such ambiguity needs to be more carefully considered and acknowledged, particularly in light of the implications for income inequality or inclusive growth in developing economies (Visagie & Posel, Citation2013).
The idea of the middle class has its genesis in the sociology literature, particularly the seminal works of Weber (Citation1961) and Marx (Citation1974). From a sociological perspective, the middle class is defined by their economic function. In practice, however, class has been measured using a wide variety of indices (and in various combinations), such as measures of income, household assets, education levels and occupation (Pressman, Citation2007; Birdsall, Citation2010; Atkinson & Brandolini, Citation2013). The economics literature makes widespread use of income (or expenditure) to very pragmatically measure and define the middle class (Ravallion, Citation2010; Atkinson & Brandolini, Citation2013). I follow on from previous work in Visagie & Posel (Citation2013) in exploring two common measures of the middle class from the economics literature: those in the actual middle of the income distribution (median-based approach), and those with a middle-class standard of living (affluence-based approach). However, widespread poverty and very high income inequality in South Africa imply that these two ‘middle class' groups do not overlap. The middle class in South Africa cannot be defined as the relatively affluent and simultaneously as the middle majority (Visagie & Posel, Citation2013).Footnote1
This tension equally applies to thinking about the politics of the middle class in South Africa. During apartheid, class cleavages were legislated according to race with middle-class affluence promoted amongst whites (Seekings & Nattrass, Citation2005). Individuals of ‘colour’ were denied business opportunities, dispossessed of property, forcibly relocated and barred from occupational advancement. The rise of the African National Congress to power in 1994 marked the end of such a coerced relationship between race and class. Nevertheless, after 46 years of apartheid, the relative economic advantage of whites within South Africa had been firmly established. In 1993 the median per-capita income for whites was more than nine times larger than that for Africans (author's own estimates; Project for Statistics on Living Standards and Development [PSLSD] 1993). A central policy goal within the democratised administration is therefore a rise in the economic status amongst previously disadvantaged groups, and particularly amongst Africans. This is seen in Affirmative Action and Black Economic Empowerment (BEE) legislation. However, a common criticism of BEE policy is that it fosters the growth of a black elite whilst failing to empower the black majority (Ponte et al., Citation2007; Southall, Citation2007, Hoffman, Citation2008). In other words, while BEE policy targeted the creation of a ‘black middle [and upper] class', such policy does little for the average black household in the actual middle.
The cause of the middle majority, however, does find traction in South African macroeconomic strategy, which consistently makes reference to the importance of reducing income inequalities. This is emphasised in the Reconstruction and Development Programme, which places ‘the problems of poverty and gross inequality’ as foremost challenges to South Africa's development (RDP, Citation1994:4). The Growth, Employment and Redistribution strategy that followed on from the RDP again recognises the need to address inequality – although lowering inequality is limited to an outcome of economic growth. Replacing the Growth, Employment and Redistribution strategy, the Accelerated and Shared Growth Initiative for South Africa re-emphasises that growth itself is unsustainable without a reduction in historical inequalities; that is, reducing inequality can be an outcome and a means to achieve economic growth. Similarly, the New Growth Path and the National Development Plan explicitly acknowledge inequality as a core development challenge and intentionally plan for a more ‘inclusive’ society. The point here is that the growth and development of the middle majority is implicit within South African macroeconomic policy, albeit outside the narrow policy reach of BEE (which applies narrowly only to the most affluent).
3. Definitions and data
In this study I track changes that have taken place in both the median-based and affluence-based middle-class groups. Both groups of ‘middle class' households are of analytical interest and become even more useful when contrasted against each other. Hence two competing perspectives of the middle class are investigated in this study.Footnote2
In analysing the actual middle of the income distribution in South Africa, I define the middle strata as households (and individuals) which fall within an interval of 50 to 150% of the median per-capita household income. This is a common approach within the international literature, particularly in developed economies (see Thurow, Citation1987; Davis & Huston, Citation1992; Pressman, Citation2007). Using data from the 2008 National Income Dynamics Study (NIDS), the middle strata are identified by a per-capita household income of between R380 and R1140 per capita per month in 2008 prices.
To identify individuals with a middle-class lifestyle or the ‘affluent middle class', I use an income threshold of between R1400 and R10 000 per person per month (after-tax earnings in 2008 prices). This corresponds to the average earnings for households in which the highest income earner is in a typically ‘middle-class' occupation in the NIDS 2008.Footnote3 The upper bound of R10 000 places only the wealthiest 2% of individuals from the South African income distribution into the upper class (based on NIDS 2008 data). The lower bound of R1400 also roughly corresponds to a commonly utilised lower income threshold in the international literature of $10 per day (Bhalla, Citation2007; Birdsall, Citation2010; Kharas & Gertz, Citation2010). Those in the lower class (individuals with less than R1400 per capita per month) are further divided into the poor (<R515) and non-poor (R515 to R1399) using a basic cost-of-needs poverty line (see Hoogeveen & Özler, Citation2006; Posel & Rogan, Citation2009; Leibbrandt et al., Citation2010).
The data come from three nationally representative cross-sectional datasets for South Africa. These are the 1993 PSLSD; the 2000 Income and Expenditure Survey (IES), which can be combined with the 2000 Labour Force Survey (LFS) as they surveyed the same group of households; and lastly the NIDS 2008. The NIDS provides a later wave of data for 2010/11, but there is a high rate of sample attrition for individuals at the top of the income distribution. Despite reweighting the data to correct for this attrition, Finn et al. (Citation2012) find that there remains a downward bias in incomes at the top, and hence wave 2 data from the NIDS has not been included. Nevertheless, my own preliminary examination of the NIDS 2010/11 data suggests little difference compared with estimates of the middle class in 2008 (discounting the possible effects of sample attrition).
These particular cross-sectional datasets have been chosen because they each collect detailed information on household income (and expenditure), as opposed to merely a one-shot question on total household income (as has been used previously in studies of the middle class; Schlemmer, Citation2005; Van der Berg, Citation2010) as well as providing detailed labour market and demographic information. Total household income is computed from the collation of individual incomes from a comprehensive list of sources: namely, income from the labour market, government grant income, income from investments and remittance income. This is a noteworthy improvement on previous estimates of the middle class in South Africa.
Using three different cross-sectional datasets will evidently introduce unwanted complication in the comparison of data across time. These concerns are well discussed in the wider literature on measuring changes in poverty and inequality in South Africa (Bhorat & van der Westhuizen, Citation2008; Posel & Rogan, Citation2009; Leibbrandt et al., Citation2010). There may be some unavoidable bias in comparisons of income data across time. However, three notable features help build some measure of confidence in the results to follow. Firstly, a decline in the poverty headcount ratio between 1993 and 2008 as reported in (described by the size of the poor lower class) is corroborated by other studies of income poverty in South Africa – such as the use of AMPS data scaled up to the national accounts aggregates by Van der Berg et al. (Citation2008) or the use of October Household Surveys and General Household Surveys by Posel & Rogan (Citation2009). Secondly, trends in class size and composition are consistent across all three periods and are not merely the construction of a faulty base estimate. Thirdly, the income data are the aggregation of detailed information on the sources of household income in all three datasets.
Table 1: Class size and income share, 1993–2008
4. Perspective 1: The affluent middle and the black middle class
4.1 The size of the affluent middle class
Important in the first perspective of affluence-based middle-class development are changes to the size and racial composition of the affluent middle class (R1400 to R10 000 per capita per month in after-tax income from all sources).
Between 1993 and 2008, an additional 2.7 million individuals were added to the middle class (see ). Hence, in absolute terms there was sizeable growth in number of individuals who attained a middle-class lifestyle. Nevertheless, in relative terms, the size of the middle class increased only slightly ahead of population growth – the population share of the middle class increased from 19.3% of the total population in 1993 to 21.3% in 2008.
This discounts a small share of individuals at the very top of the distribution (i.e. upper class) with incomes in excess of R10 000 per capita per month. Although growing from a low base of less than half a million individuals in 1993, the upper class experienced the largest relative growth of all class groups, trebling in size to 2.8 million individuals over the period (but still accounting for less than 3% of the total population in 2008). Showing strong growth of the upper class (rather than the middle class) illuminates the nature of increases in income inequality experienced in the post-apartheid period (Van der Berg & Louw, Citation2004; Hoogeveen & Osler, Citation2006; Leibbrandt et al., Citation2010).
The vast majority of individuals in South Africa are situated in the lower income classes (poor and non-poor). In 1993, close to 80% of the population fell beneath the middle-class lower bound of R1400 per capita per month (). Hence, recognising that the affluent middle approximates the top 20% of individuals in the distribution (when combined with the top-most 3% from the upper class) shows that there is nothing ‘middle’ about middle-class affluence in South Africa.
Figure 1: Class population shares, 1993–2008
Notes: The data are weighted; author's own estimates.
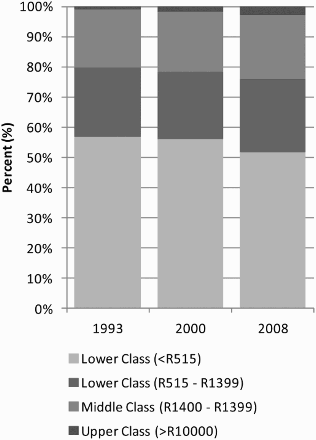
The lower class is further divided into the poor and non-poor for further depth of analysis. The proportion of individuals living below the poverty line (R515 per capita per month) declined by 5.2 percentage points between 1993 and 2008. Most of this decrease occurred post 2000, in response to a large expansion in social grant payments. However, in spite of a relative shift away from poverty, the absolute number of individuals living in poverty increased by 2.4 million due to population growth.
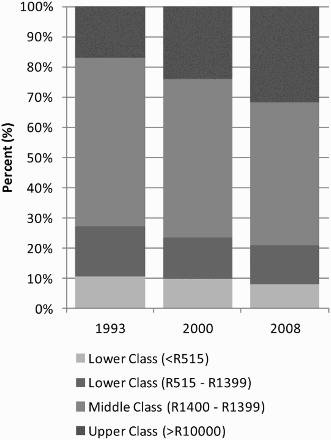
The relative size of the middle class is also sometimes measured in terms of the size and share of total income (Pressman, Citation2007; Palma, Citation2011). illustrates how the share of total income shifted between income classes between the years 1993, 2000 and 2008. Most striking is a rise in the share of total income accruing to the upper class, at the expense of the remaining income classes. The middle-class income share actually declined from 56% in 1993 to 47% by 2008 – evidence of a ‘middle class' income squeeze (see also Palma, Citation2011).
Figure 2: Class income share, 1993–2008
Notes: The data are weighted; author's own estimates.
The fact that the size of the middle class increased only modestly between 1993 and 2008 and that the income share of the middle class actually declined is somewhat surprising in light of other studies of the middle class in South Africa, which generally report strong middle class growth post 1994 (Whiteford & Van Seventer, Citation2000; Schlemmer, Citation2005; Van der Berg, Citation2010). I suggest three potential reasons for this discrepancy (notwithstanding the confounding impact of differences in definition between these studies). The first reason is that there may have been a large absolute increase in the size of the middle class, but the same is not true of a large relative increase in the size of the middle class (or in terms of the income share of the middle class). Secondly, previous studies of the middle class in South Africa have not distinguished between the middle class and the upper class, and the upper class did experience very large growth (albeit from a low base). A third factor is that my estimates of middle class growth are not limited to Africans. In other words, the African middle class may have experienced sizeable growth over the period but the same cannot be said for the middle class as a whole.
4.2. The rise of black affluence
describes changes in the racial profile of the affluent middle class in South Africa over the period 1993–2008. An additional 3.1 million Africans were added to the middle class over the period, with a steady increase in size between 1993 and 2000 and between 2000 and 2008. Growth in the number of middle-class Africans is partly driven by growth at the population level – the African population grew by eight million between 1993 and 2008. However, the row percentages in the table for Africans show that growth of the African middle class was in excess of population growth.
Table 2: Race and class status, 1993–2008
In 1993, the middle class consisted of a large white majority and . Middle-class whites out-numbered middle-class Africans by almost two to one. However, by 2000 the white middle-class majority had been replaced by an African majority. And Africans continued to increase their relative share of the middle class between 2000 and 2008. By 2008 the number of middle-class Africans out-numbered middle-class whites by roughly two to one. This is a complete reversal of the demographic profile of the middle class from 1993.
The large change in the African-to-white ratio of the middle class is explained mostly by a large rise in the number of middle-class Africans, but is also explained by a significant fall in the number of middle-class whites (by approximately 1.2 million individuals). Shrinking numbers of middle-class whites are partly caused by restructuring in the class distribution for whites towards the top. Amongst the white population, the percentage of whites who were in the middle class fell from 81% to 67% between 1993 and 2008, with a shift towards more whites in the upper class (increasing from 7.8% to 20%). However, a further important factor is a change at the population level – the white population shrunk in size between 1993 and 2008 by approximately one million. Shrinking white population growth can be attributed to a combination of low fertility levels and to white emigration (Van Rooyen, Citation2000). Overall, a dwindling white population combined with a distributional shift amongst whites away from the middle class (and towards the upper class) resulted in a fast declining white share (and a rising African share) of the middle class over the period. Growing numbers of middle-class Africans combined with shrinking numbers of middle-class whites therefore partly explain how the total growth of the middle class between 1993 and 2008 was muted.
The percentage of the middle class who were coloured or Indian remained more stable over the period, but also showed positive transformation) (, ). Amongst coloureds, an additional 530 000 individuals were added to the middle class between 1993 and 2008. This was against the backdrop of coloured population growth of 900 000 individuals over the same period. Hence, the percentage of coloureds who were middle class increased from 23% to 31% and the total share of coloureds in the middle class as a whole increased from 10% to 13% over the period. Less can be said about changes in the size and share of Indians in the middle class (partly owing to the small sample size for Indians).
Figure 3: Racial composition of the middle class, 1993–2008
Notes: Standard errors in parentheses; the data are weighted.
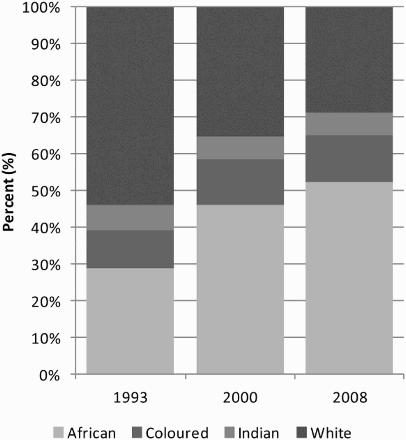
Figure 4: Class status of the African and White populations, 1993 and 2008
Notes: Standard errors in parentheses; the data are weighted.
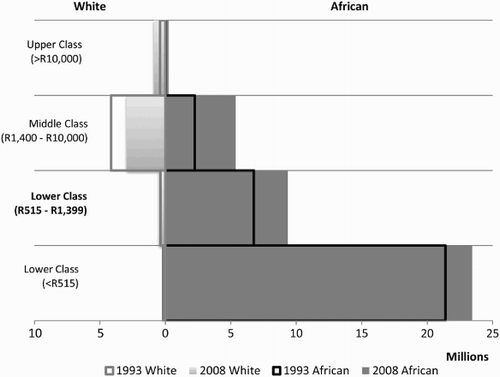
The racial composition of the upper class also showed significant racial transformation over the period (although the upper class remains a very small share of the total population). In particular, there was a 10-fold increase in the number of upper-class Africans between 1993 and 2008, as opposed to a two-fold increase in upper-class whites. However, whites still held the racial majority of the upper class in 2008.
Large shifts in the racial composition of the middle (and upper) class are not repeated when examining the lower class. In fact, the significant feature of the racial composition of the lower classes is their homogeneous African composition. The racial share of individuals who fell below the R515 per-capita per-month poverty line fluctuated between 94.1 and 93.5% African, whilst the racial share of individuals who fell above the poverty line but were still in the lower class fluctuated between 74.5 and 79.9% African. Structural shifts in the racial composition of the class structure are therefore limited to affluence at the top of the distribution.
4.3 Black affluence and occupation
Investigating occupation by race provides an alternative means of verifying the transformation in race and affluence in the post-apartheid period (as generally followed in the sociology literature on class status; Rivero et al., Citation2003; Seekings & Nattrass, Citation2005; Muller, Citation2006). The major pragmatic shortcoming of the occupational approach to measuring class status is that it excludes a large proportion of the population who are not within the labour force, and it may also classify individuals of the same household (who arguably share resources and enjoy the same lifestyle) into different class categories. The use of household per-capita income by economists to define the middle class has the advantage of overcoming such obstacles. Irrespective, occupation and income are obviously correlated.
An investigation of race and class by occupation (see and , and ) shows that there has been a large change in the racial composition of typically ‘middle class' occupations between 1993 and 2008.Footnote4 The demographic composition of middle-class occupations shifted from majority white to majority African over the period (amongst clerks, Africans were already in the majority in 1993, but the African population share of clerks increased over the period).
Figure 5: Managers, legislators and senior officials by race, 1993–2008
Notes: The data are weighted.
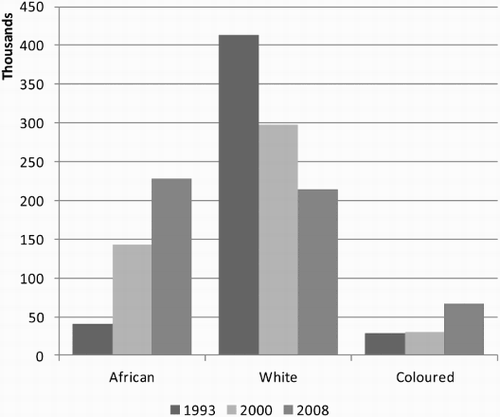
Figure 6: Professionals, associate professional and technicians by race, 1993–2008
Notes: The data are weighted.
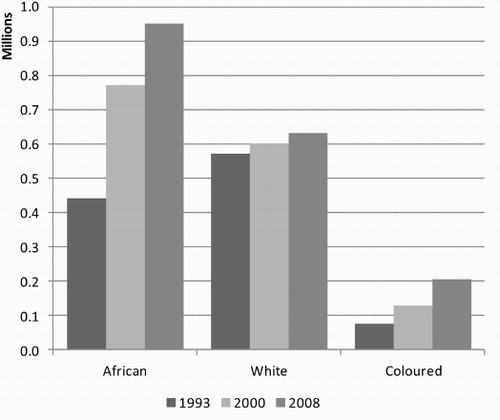
Figure 7: Clerks by race, 1993–2008
Notes: The data are weighted.
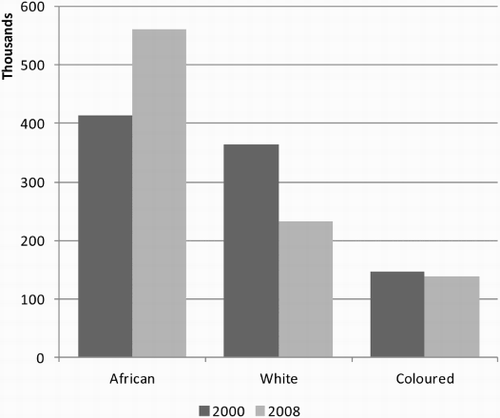
Table 3: Middle-class occupations by race, 1993–2008
These shifts were the result of a declining white share of total employment (due to the decline in the size of the total white population), and large absolute increases in the number of Africans in middle-class occupations (in excess of total African employment growth). Coloureds also experienced large growth in the number of middle-class employees, in excess of coloured employment growth (with the exception of clerical occupations). Interestingly, whites maintained the same number of jobs in professional occupations whilst losing a large number of management/administrator positions. This may reflect the importance of the public sector in creating a large number of middle-class jobs for non-whites.
In sum, the racial composition of the middle class and upper class displayed massive transformation between 1993 and 2008 (as reflected in the income distribution and the occupational hierarchy).Footnote5 That said, there is still significant progress to be made. Whites remain significantly over-represented in the middle (and upper) class relative to their population share (and under-represented in the lower classes), whereas Africans are significantly under-represented in the middle class in relation to their population share.
Moreover, the preceding analysis of the middle class says little about changes in livelihoods for the actual middle. Although racial equity at the top of the income distribution is welcomed, of arguably equal (if not greater) importance is the economic empowerment of the majority. This leads to our second perspective of ‘middle class' development – an examination of changes in incomes for the middle-income strata between 1993 and 2008.
5. Perspective 2: The actual middle and depressed income growth
5.1 The middle-income squeeze
presents the median per-capita income and corresponding income thresholds (50 to 150% of the median) for individuals residing in households that fell in the actual middle of the distribution of income between 1993 and 2008. In 1993 the middle strata received between R345 and R1034 per capita per month (in constant 2008 prices). This is very revealing of the economic hardships faced by the majority of South Africans at the start of the democratic era. In fact, approximately 40% of individuals located in the middle strata fell below the poverty line of R515 per capita per month. The actual middle are anything but ‘middle-class' when compared with the standard of living associated with middle-class affluence.
Table 4: Thresholds for the middle-income strata, 1993–2008
Incomes were very slow to rise between 1993 and 2008. The median per-capita household income increased from R689 per capita per month in 1993 to R749 in 2000 and ended on R759 in 2008. This represents a modest 10% increase in the median per-capita household income over the 15-year period of review. This translates into an average per-capita growth rate of just 0.67% per annum.
presents information on the size and income shares of the lower, middle and upper strata for the period. In absolute terms, total income collected by households in the middle increased from R7.1 billion in 1993 to R9.9 billion in 2008. However, the relative share of income accruing to these households actually declined from 15.2% to 12.7% of total income between 1993 and 2008. This is in spite of growth in the relative size of the middle strata (in terms of the share of households) from 27.7% to 30.9% of households over the period. The lower strata similarly experienced a fall in their share of total income.
Table 5: Size and income shares of the income strata, 1993–2008
Of course it follows that relatively less income received by the lower and middle strata means more income received by households in the upper strata. In fact, it was households at the very top of the upper strata that increased their relative income share. Households in the 10th (and most affluent) income decile increased their share of income from 40.7% to 48.9% of total incomeFootnote6 (this is also shown by Leibbrandt et al., Citation2010).
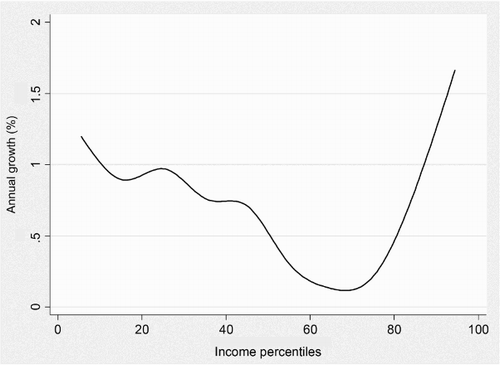
Therefore it follows that the middle strata did not experience ‘inclusive’ growth over the period. The growth incidence curve shown in illustrates this point visually (see Ravallion & Chen, Citation2003). For economic growth to be ‘inclusive’, the curve should angle downwards from left to right; that is, growth should be highest over the lower deciles and lowest over the upper deciles. Although annualised per-capita growth was consistently positive between 1993 and 2008, it was at its lowest over the middle deciles. As seen in the figure, the growth incidence curve is roughly ‘U-shaped’, suggesting a polarised pattern of income growth, but strongly biased in the upper tail of the curve. Relatively better income growth in the lower tail of the curve (in comparison with the middle) reflects the impact of the large expansion in government social grants over the period (Bhorat & Van der Westhuizen, Citation2008; Van der Berg et al., Citation2008). This U-shaped pattern of growth may partially explain how falling poverty levels have gone hand-in-hand with rising income inequality in post-apartheid South Africa.
5.2 Labour market earnings and social grants
To better understand this middle-income squeeze, (see also ) provides a breakdown of the composition of total household income and how this changed over the period.
Figure 9: Changes in the sources of income of the middle-income strata, 1993 and 2008
Notes: The data are weighted. UIF, Unemployment Insurance Fund.
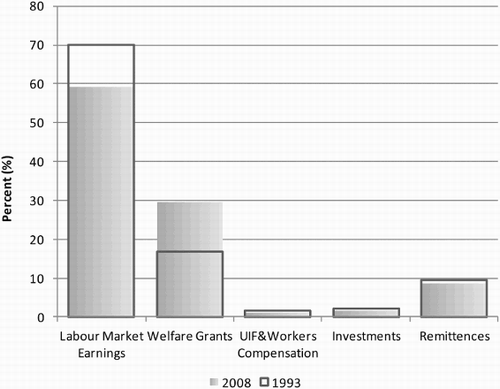
Table 6: Sources of household per capita income, 1993–2008
The middle strata became less reliant upon earnings from the labour market, both in terms of the average rand value of earnings received (constant 2008 prices) and even more so in percentage terms. In 1993, 70% of total income was derived from the labour market, whereas in 2008 only 59% of total income came through the labour market. The lower strata similarly experienced a fall in labour market earnings, although not of the same magnitude as households in the middle strata.
Eroding labour market incomes post 1994 are the result of significant structural shifts in the labour market well documented in the literature. These changes include: falling levels of formal sector employment in the 1990s (Seekings & Nattrass, Citation2005); a general shift from unskilled to skilled labour employment (Oosthuizen, Citation2003; Bhorat, Citation2005; Rodrik, Citation2006); a large increase in labour supply ahead of employment growth (Casale et al., Citation2004); and resulting steady increases in the unemployment rate (whether strict or expanded) (Kingdon & Knight, Citation2004, Citation2007; Seekings & Nattrass, Citation2005). All of the abovementioned trends undermine the aggregate labour market earnings of households in the lower and middle strata in South Africa.
However, falling labour market earnings both amongst the lower and middle strata did not lead to a net reduction in per-capita income. This was due to a large increase in government grant income. Amongst the lower income strata, government grant income increased from just 26% of total income in 1993 to the majority share at 55% of total income in 2008. Even in the middle, the average percentage of income derived from government grants for middle-income households increased from 17% to 30% between 1993 and 2008. Both the lower strata and the middle strata were therefore cushioned from a regression in household incomes through fiscal redistribution. However, the South African fiscus will not allow for the same level of expansion in social welfare into the future – at least not without an ideological change regarding the acceptable size of the budget deficit.
6. Policy implications
The above two perspectives of the ‘middle class' have important implications for economic policy. In terms of middle-class affluence, there is strong evidence of progress in the racial composition of the middle (and upper) class. Although race is still highly correlated with class, the relationship has moved in the right direction. In fact, use of my particular definition of the middle class finds a switch from majority white to majority African between 1993 and 2008 – and this is also borne out in the racial mix of middle-class occupations. Hence, South Africa has moved closer towards racial equity in the class structure as targeted in Affirmative Action and BEE policy.
However, inequality in the South African distribution of income has not fundamentally changed, and has even worsened. Income became even more concentrated at the very top. South Africa therefore moved away from race-based cleavages towards class-based cleavages, and such class-based cleavages strengthened over the period. The upper class experienced very large growth (albeit from a low base), whereas the affluent middle grew only slowly. Policy needs to balance out the need for racial transformation at the top of the income hierarchy alongside the need for deeper structural reform of the class system itself.
A focus on households in the ‘actual middle’ of the distribution shows very modest income growth between 1993 and 2008 of only half a percentage point per annum. This is the result of lost traction in the labour market. If it was not for massive expansion and take-up of social grants in South Africa, incomes for the lower and middle strata may have regressed. Such lacklustre income progress at the middle does not bode well for future social stability. South Africa needs to actualise a far more inclusive growth trajectory – current performance reflects a failure of macroeconomic policy in creating jobs and significantly raising livelihoods for the majority.
Acknowledgements
The author would like to thank Economic Research Southern Africa (ERSA) for their support of this project as well as to thank the editor from the Econ3x3 Forum for useful feedback on this topic.
Notes
1This contradiction between the middle majority and middle-class affluent is not unique to South Africa. Ravallion (Citation2010:445) discusses a wide variety of measures of the middle class across a number of developing countries and concludes that ‘Western notions of the middle class are of little obvious relevance to developing countries’.
2Refer to Visagie & Posel (Citation2013) for an extended discussion of each definition and how these definitions were derived.
3Middle-class occupations are derived from the International Standard Classification of Occupations and are defined as ‘legislators, senior officials and managers', ‘professionals, associate professionals and technicians' and lastly ‘clerks'.
4The upper class is not ascribed a different set of occupations from that of the middle class in this analysis (see Visagie & Posel, Citation2013). The middle class is not always differentiated from the upper class in studies that rely on occupation to define class status (Rivero et al., Citation2003; Seekings & Nattrass, Citation2005).
5The specific size of the racial shift will depend on the choice of income boundary for the affluent middle class (analogous to the choice of poverty line). Irrespective of whether Africans actually outnumber whites in the middle class by 2008 (which will depend on the choice of threshold), there was a notable shift of Africans into higher income thresholds in much larger numbers than whites.
6Given the extent of income inequality in South Africa, the upper bound of 150% of the median income results in a relative large upper strata. Considering the top 10% of households or individuals within the distribution provides further clarity as to the income status of those at the very top of the income distribution.
References
- African Development Bank, 2011. The middle of the pyramid: dynamics of the middle class in Africa. Market Brief. Chief Economist Complex, Tunis-Belvedre, Tunisia.
- Atkinson, A & Brandolini, A, 2013. On the identification of the middle class. In Gornick, J & Jantti, M (Eds), Income Inequality: Economic Disparities and the Middle Class in Affluent Countries. Stanford University Press, Stanford, CA.
- Barro, R, 1999. Determinants of democracy. Journal of Political Economy 107(6), 158–83. doi: 10.1086/250107
- Bhalla, S, 2007. Second Among Equals: The Middle Class Kingdoms of India and China. Peterson Institute for International Economics, Washington, DC.
- Bhorat, H, 2005. Labour market challenges in the post-apartheid South Africa. South African Journal of Economics 72(5), 940–77. doi: 10.1111/j.1813-6982.2004.tb00140.x
- Bhorat, H & van der Westhuizen, C, 2008. The Regulatory Environment and its Impact on the Nature and Level of Economic Growth and Development in South Africa, DPRU Conference, 27–29 October, Glenburn Lodge, Muldersdrift, South Africa.
- Birdsall, N, 2010. The (indispensable) middle class in developing countries. In Kanbur, R & Spence, M (Eds), Equity and Growth in a Globalizing World. The World Bank, Washington, DC.
- Brown, C, 2004. Does income distribution matter for effective demand? Evidence from the United States. Review of Political Economy 16(3), 291–307. doi: 10.1080/0953825042000225607
- Casale, D, Muller, C & Posel, D, 2004. Two million net new jobs: A reconsideration of the rise in employment in South Africa, 1995–2003. South African Journal of Economics 72(5), 978–1002. doi: 10.1111/j.1813-6982.2004.tb00141.x
- Davis, J & Huston, J, 1992. The shrinking middle-income class: A multivariate analysis. Eastern Economic Journal 18(3), 277–85.
- Doepke, M & Zilibotti, F, 2005. Social class and the spirit of capitalism. Journal of the European Economic Association 3(2–3), 516–524. doi: 10.1162/jeea.2005.3.2-3.516
- Easterly, W, 2001. The middle class consensus and economic development. Journal of Economic Growth 6, 317–35. doi: 10.1023/A:1012786330095
- Easterly, W, 2007. Inequality does cause underdevelopment: Insights from a new instrument. Journal of Development Economics 84, 755–76. doi: 10.1016/j.jdeveco.2006.11.002
- Finn, A, Leibbrandt, M & Levinsohn, J, 2012. Income mobility in South Africa: Evidence from the first two waves of the National Income Dynamics Study. SALDRU Working Paper Number 82/NIDS Discussion Paper 2012/5, Southern Africa Labour and Development Policy Research Unit (SALDRU), Cape Town.
- Galor, O & Zeira, J, 1993. Income distribution and macroeconomics. Review of Economic Studies 60, 35–52. doi: 10.2307/2297811
- Hoffman, E, 2008. A wolf in sheep's clothing: Discrimination against the majority undermines equality while continuing to benefit few under the guise of Black Economic Empowerment. Syracuse Journal of International Law and Commerce 36, 87–115.
- Hoogeveen, J & Özler, B, 2006. Not separate, not equal: Poverty and inequality in post-apartheid South Africa. In Bhorat, H & Kanbur, R (Eds), Poverty and Policy in Post-apartheid South Africa. HSRC Press, Cape Town.
- Kharas, H & Gertz, G, 2010. The new global middle class: A cross-over from West to East. In Li, C (Ed.), China's Emerging Middle Class: Beyond Economic Transformation. Brookings Institute Press, Washington, DC.
- Kingdon, G & Knight, J, 2004. Unemployment in South Africa: The nature of the beast. World Development 32(3), 391–408. doi: 10.1016/j.worlddev.2003.10.005
- Kingdon, G & Knight, J, 2007. Unemployment in South Africa, 1995–2003: Causes, problems and policies. Journal of African Economies 16(5), 813–48. doi: 10.1093/jae/ejm016
- Landes, D, 1998. The Wealth and Poverty of Nations. Norton, New York.
- Leibbrandt, M, Woolard, I, Finn, A & Argent, J, 2010. Trends in South African income distribution and poverty since the fall of apartheid. Organisation for Economic Co-operation and Development Social, Employment and Migration Working Papers 101, OECD, Paris.
- Marx, K, 1974. Capital. Lawrence and Wishart, London.
- Muller, S, 2006. The challenge of joining two economies: Assessing changes in the black middle class post-1994. In Gqubule, D (Ed.), Making Mistakes Righting Wrongs: Insights into Black Economic Empowerment. Jonathan Ball, Johannesburg.
- Oosthuizen, M, 2003. Expected labour demand in South Africa: 1998–2003. Development Policy Research Unit Working Paper 03/81, DPRU, Cape Town.
- Palma, J, 2011. Homogeneous middles vs. heterogeneous tails, and the end of the ‘inverted-U’: It's all about the share of the rich. Development and Change 42(1), 87–153. doi: 10.1111/j.1467-7660.2011.01694.x
- Perotti, R, 1996. Growth, income distribution, and democracy: What the data say. Journal of Economic Growth 1, 149–88. doi: 10.1007/BF00138861
- Ponte, S, Roberts, S & van Sittert, L, 2007. Black economic empowerment, business and the state in South Africa. Development and Change 38(5), 933–55. doi: 10.1111/j.1467-7660.2007.00440.x
- Posel, D & Rogan, M, 2009. Women, income and poverty: Gendered access to resources in post-apartheid South Africa. Agenda 81, 25–34.
- Pressman, S, 2007. The decline of the middle class: An international perspective. Journal of Economic Issues 41(1), 181–200.
- Ravallion, M, 2010. The developing world's bulging (but vulnerable) middle class. World Development 38(4), 445–54. doi: 10.1016/j.worlddev.2009.11.007
- Ravallion, M & Chen, S, 2003. Measuring pro-poor growth. Economic Letters 78, 93–9. doi: 10.1016/S0165-1765(02)00205-7
- RDP (Reconstruction and Development Programme), 1994. White Paper on Reconstruction and Development Programme. Government Gazette vol 353, no. 16085. Notice no. 1954 of 1994, Parliament of The Republic of South Africa, Cape Town.
- Rivero, C, Du Toit, P & Kotze, H, 2003. Tracking the development of the middle class in democratic South Africa. Politeia 22(3), 6–29.
- Rodrik, D, 2006. Understanding South Africa's economic puzzles. CID Working Paper No. 130, Center for International Development at Harvard University, Cambridge, MA.
- Schlemmer, L, 2005. Lost in transformation? South Africa's emerging middle class. Centre for Development and Enterprise Focus Papers 8, Centre for Development and Enterprise, Johannesburg.
- Seekings, J & Nattrass, N, 2005. Class, Race and Inequality in South Africa. UKZN Press, Durban.
- Sokoloff, K & Engerman, S, 2000. Institutions, factor endowments, and path of development in the New World. Journal of Economic Perspectives 14(3), 217–32. doi: 10.1257/jep.14.3.217
- Southall, R, 2007. Ten propositions about black economic empowerment in South Africa. Review of African Political Economy 34 (111), 67–84. doi: 10.1080/03056240701340365
- Thurow, L, 1987. A surge in inequality. Scientific American 256, 30–7. doi: 10.1038/scientificamerican0587-30
- Van der Berg, S, 2010. Straddling Two Worlds: Income Inequality in South Africa. Centre for Development and Enterprise, Johannesburg.
- Van der Berg, S & Louw, M, 2004. Changing patterns of South African income distribution: Towards time series estimates of distribution and poverty. South African Journal of Economics 72(3), 546–72. doi: 10.1111/j.1813-6982.2004.tb00125.x
- Van der Berg, S, Louw, M & Yu, D, 2008. Post-transition poverty trends based on an alternative data source. South African Journal of Economics 76 (1), 59–76. doi: 10.1111/j.1813-6982.2008.00161.x
- Van Rooyen, J. 2000. The New Great Trek: The Story of South Africa's White Exodus. Unisa Press, Pretoria, South Africa.
- Visagie, J & Posel, D, 2013. A reconsideration of what and who is middle class in South Africa. Development Southern Africa. DOI:10.1080/0376835X.2013.797224
- Weber, M, 1961. Essays in Sociology. Routledge and Kegan Paul, London.
- Whiteford, A & Van Seventer, D, 2000. South Africa's changing income distribution in the 1990s. Studies in Economics and Econometrics 24(3), 7–30.

