
Abstract
Schooling outcomes in South Africa are characterised by significant inequalities on the basis of race and socio-economic status. This paper reports on findings from a unique panel dataset that follows individuals who participated in the Trends in International Mathematics and Science Study in 2002 as Grade 8 students through to their secondary school-leaving examination (known as ‘matric’) in Grade 12. The paper investigates the extent to which secondary schools differ in converting Grade 8 achievement into matric outcomes. Achievement in Grade 8 is strongly predictive of survival to matric, passing matric and performance in matric. Many students had extremely weak mathematical proficiency in Grade 8 and yet decided to take matric mathematics, only to fail the subject. Increasing the number of matric mathematics passes is a strong policy imperative. Our analysis suggests that the way to achieve this is to improve mathematics learning at earlier stages of the school programme rather than through indiscriminate mathematics participation in matric.
1. Introduction
Educational outcomes in the major school-leaving examination in South Africa (the ‘matric’ examination at the end of Grade 12) are characterised by substantial inequalities along racial and socio-economic lines. In 2011, approximately 44% of black South Africans between the ages of 23 and 24 reported having completed secondary school. In contrast, this figure was more than 83% for Indian South Africans and 88% for whites.Footnote5 Success in the matric examination determines access to higher education and is strongly predictive of labour market outcomes in South Africa (Branson et al., Citation2012).
It is important to trace the evolution of these educational inequalities to earlier phases of the educational process to determine when policy interventions might be most effective. Local and international assessments of educational achievement have consistently revealed substantial educational inequalities between South African children of low and high socio-economic status early in primary school (Van der Berg, Citation2008; Spaull, Citation2012). Taylor (Citation2011) shows that, by Grade 5, children attending historically disadvantaged schools have already accumulated learning deficits equivalent to at least two years of schooling relative to children attending historically advantaged schools.
This paper uses a specially constructed panel dataset to examine whether there is any reduction or exacerbation of these inequalities during the secondary school phase. The paper builds on an earlier analysis of the same dataset (Reddy et al., Citation2012), which described Grade 8 outcomes and Grade 12 outcomes for historically advantaged and historically disadvantaged schools.
There is a rich international literature examining the persistence of early educational inequalities and the effect of schools to widen or narrow such inequalities. The formation of educational inequalities begins early as home background factors impact on cognitive development prior to birth and throughout the educational process. There are numerous channels through which home socio-economic status influences early cognitive development, such as nutrition, health care and physical and mental stimulation from caregivers. All of these processes contribute to differences in cognitive development upon entering the school system, what Lee & Burkham (Citation2002) call ‘inequality at the starting gate’.
Feinstein (Citation2003) showed that differences in cognitive ability between high and low socio-economic status British children existed by the age of 22 months. Test scores at 22 months were correlated with educational attainment at age 26, indicating the importance of early cognitive development. Feinstein also observed considerable upward mobility amongst affluent children who initially performed poorly. Amongst poorer children, those with low initial scores tended to remain near the bottom of the rankings while those with high initial scores were prone to slipping down the ranking.
Similarly, Heckman (Citation2006:1901) found that achievement gaps were stable by the third grade and that subsequent schooling made little difference to these gaps. According to Heckman, the reason for this phenomenon is the hierarchical nature of learning, with early cognitive development being the foundation for all subsequent learning. As Heckman (Citation2006:1900) puts it, ‘the mastery of skills that are essential for economic success and the development of their underlying neural pathways follow hierarchical rules. Later attainments build on foundations that are laid down earlier'. He therefore argues that interventions amongst disadvantaged children will have greatest impact at earlier ages. Studies show that attending pre-school can produce educational benefits which persist at least several years into schooling (e.g. Sammons et al., Citation2004). Some research has even found that the benefits of pre-school, and specifically of learning to read effectively at an early stage, can be compounded over time as positive spillover effects into other subject domains accrue (e.g. Stanovich, Citation1986; Cunningham & Stanovich, Citation1997).
What, then, can formal schooling do to ameliorate the inequalities in cognitive development that are formed during early childhood? The debate on whether schools make a real difference gained momentum with the Coleman Report of 1966. This landmark American study found that school characteristics, notably funding, did not contribute much to schooling outcomes. Rather, the socio-economic status of students and that of their class peers were the important factors. This finding that ‘schools bring little influence to bear on a child's achievement that is independent of his background’ (Coleman et al., Citation1966:325) prompted a reactionary search for school effects amongst researchers. Heyneman & Loxley (Citation1983) argued that the ‘Coleman Report conclusion’ relied too heavily on generalisations from a few of the world's education systems, namely those in North America, Europe and Japan. They argued that school effects were typically weak in high-income countries but stronger in low-income countries. This finding became known as the Heyneman–Loxley effect in the literature, although it also has subsequently been challenged (e.g. Baker et al., Citation2002). On balance, enough studies have found that schools can make a difference to suggest that the pessimistic conclusions of the Coleman Report about the impotence of schools to reverse or reduce student inequalities were too strong. However, the reality is that schools often do not have a substantial positive impact on the educational outcomes of poor students.
An explicitly critical literature contends that schools serve to reproduce capitalist society. In Marxist theory, capitalist societies are characterised by class reproduction, which is fostered by institutions such as schools. Underpinned by variations of this view, numerous ‘reproduction theories’ of schooling emerged during the 1970s and 1980s (e.g. Bowles & Gintis, Citation1976). The current research question – namely, how well different parts of the South African school system convert the levels of academic skill they inherit at the eighth grade into matric outcomes – holds important implications regarding the contribution of the school system to social and economic transformation versus mere reproduction.
The next section introduces the specially constructed panel of students observed in Grade 8 and again in the matric examination. Section 3 presents the main empirical analysis in which the relationships between Grade 8 performance and four matric outcomes (survival to Grade 12, passing matric, participation in matric mathematics and performance in matric mathematics and English) are examined. The final section concludes by highlighting the implications of this paper for education policy in South Africa.
2. Data
This paper uses a panel dataset which it was possible to assemble by virtue of collaboration with the Human Sciences Research Council, who coordinated the South African component of the 2002 Trends in International Mathematics and Science Study (TIMSS). This survey tested 8952 Grade 8 students in 255 schools throughout South Africa. Using confidential student information, 2734 of these students were successfully identified in the Department of Basic Education's matric datasets of 2006 or 2007.Footnote6
The new combined dataset contains information about mathematics and science achievement in Grade 8 as well as a large range of student, home, teacher and school characteristics as collected in TIMSS 2002. It also contains information about matric subject choices, final matric result (pass category) and total marks achieved in matric English, mathematics and science for those students who were identified in matric.
The data also include the former education department that each school would have belonged to under apartheid. There were separate departments for schools serving white students (House of Assembly [HOA]), coloured students (House of Representatives [HOR]), Indian students (House of Delegates [HOD]) and black students (Department of Education and Training [DET]; and separate departments for each nominally independent homeland). Since the abolition of racial segregation in South African schools, historically white, coloured and Indian schools have become considerably heterogeneous in terms of race but now largely serve the middle class. Historically black schools still almost exclusively serve black children from poor families. Despite equalisation in state education spending, these historically different parts of the system continue to perform at very different levels and display a different set of educational and institutional processes (Reddy, Citation2006; Fleisch, Citation2008; Van der Berg, Citation2008).
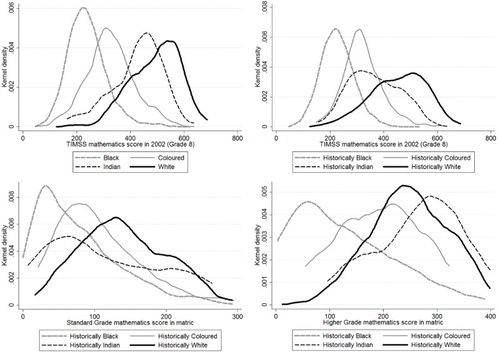
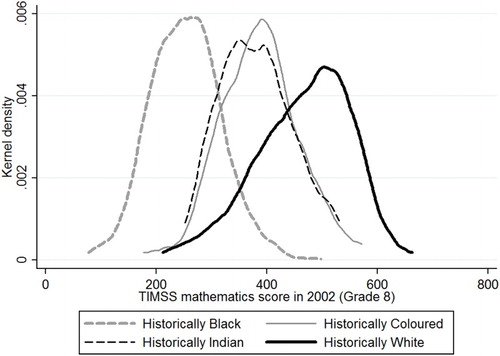
The performance of South African students in TIMSS 2002 was dismal; the average estimated score was the lowest of all participating education systems in both Grade 8 mathematics (score of 264) and Grade 8 science (score of 244). Student performance differed widely across the historically different parts of the school system. In mathematics, the average estimated score was 227 for students in historically black schools, 314 for those in historically coloured schools, 366 for those in historically Indian schools and 468 for those in historically white schools. TIMSS scores were calculated using Item Response Theory and were set to have an international centre-point of 500 points and a standard deviation of 100 points. shows, using kernel density curves, the distributions of scores for mathematics achievement in TIMSS in Grade 8, matric mathematics on the standard grade level (score out of 300) and matric mathematics on the higher grade level (score out of 400), by race group and former department. It is striking how different the patterns of achievement across the historically different parts of the school system remain.
Figure 1: Kernel density distributions of TIMSS mathematics scores and matric mathematics scores by former department and by race
The panel dataset that was constructed for this paper allows numerous questions to be investigated for which previously existing datasets were not suitable. It is now possible, for example, to explore patterns in matric subject choice based on previous achievement. This is especially relevant regarding the decision to take mathematics to matric. It is also possible to test how well Grade 8 achievement predicts various aspects of matric performance. Or, put differently, how predictive is mathematics proficiency at the start of secondary schooling for matric outcomes and ultimate educational attainment? Furthermore, one can examine how well different parts of the school system convert Grade 8 achievement into matric achievement. Specifically, are inequalities between the historically different parts of the school system intensified or reduced over the course of secondary schooling?
3. Results: Predicting matric performance based on Grade 8 achievement
The relationships between Grade 8 achievement in mathematics (TIMSS in 2002) and four different matric outcomes of interest are examined in this section. These four outcomes are survival to matric, the final matric result (pass category), participation in matric mathematics and matric mathematics scores.
3.1 The relationship between TIMSS performance and follow-through to matric
Despite the advantages of this dataset, the matching process was not perfect. Those students who were not identified in matric in 2006 or 2007 were not identified for one of two reasons, and it is impossible to know which reason applies. Either they dropped out of school (or repeated more than once before Grade 12) or they did in fact reach matric but were ‘missed’ due to matching inaccuracies (caused by errors in personal details in either dataset). Although it cannot be determined which individuals dropped out and which were ‘missed’, it is possible to estimate the overall proportion that was ‘missed’ due to imperfect matching.
Using household survey data, it is possible to estimate the proportion of Grade 8 children that indeed go on to reach Grade 12. More specifically, one is interested in knowing the proportion who progress from Grade 8 to Grade 12 in only four or five years. This is not exactly possible to estimate using household survey data, but it is possible to restrict the age range to that roughly reflective of the sample in the TIMSS-to-matric dataset. According to the General Household Surveys (GHS) of 2005 and 2006, approximately 53.7% of 18 to 20 year olds who had attained at least Grade 8 had not yet completed Grade 11 (which is the best proxy available for reaching Grade 12). Because 30.5% of the original TIMSS sample was successfully captured in matric, it can be estimated that the remaining 69.5% consists of 53.7% that dropped out or were still enrolled in a lower grade by 2007 and 15.8% that did reach matric but were ‘missed’ in the identification process.
As presents, the Grade 12 follow-through rate (amongst those with at least Grade 8) is substantially higher amongst an older age range (21 to 25 years) – it is 67.4% as opposed to 46.3%. This difference is largely driven by the black population, in which it appears common to have completed Grade 11 at age 20 and above. This explains why the capturing rate in the TIMSS-to-matric dataset differed substantially by race. Only about one-quarter of the black students that participated in TIMSS were identified in matric, whereas nearly three-quarters of white students were. It is well known that educational attainment differs considerably across the race groups in South Africa, as the GHS estimates confirm. However, reaching matric at a delayed stage appears common amongst the black population. While roughly similar proportions of black and coloured people between the ages of 21 and 25 reach Grade 12, the proportion of 18 to 20 year olds who had reached Grade 12 was substantially lower amongst black people (41.4%) than amongst coloured people (53.1%).
Table 1: Descriptive statistics of key outcomes by race, former department and year of reaching matric
confirms that grade repetition rates are particularly high amongst the black population. For example, an estimated 22.7% of black students in Grade 10 in 2011 were repeating. This relates to a study by Lam et al. (Citation2011), who found that not only was grade repetition typically high within the schools that black children attended, but it was also largely unrelated to learner ability as measured in an independently administered test. The consequence of these practices is that many black students have an incentive to remain in the school system in spite of delays in the hope of attaining matric. This is consistent with what is observed in , namely that many black students only reach Grade 12 when they are relatively old.
Table 2: Grade repetition rates by race group according to GHS 2011
Comparing age-specific enrolment rates across the race groups reveals another side of the story. shows age-specific enrolment rates, separately by race group. Despite higher average levels of achievement in Grade 8 (when enrolment is near universal) amongst coloured students, there is greater dropout between the ages of 16 and 18 than amongst black youth. The reasons for dropout amongst the coloured population probably go beyond poverty and discouragement with learning (which would affect the black population even more) and may include access to labour market opportunities and involvement in gangs, both of which are more prevalent in the Western Cape where the majority of the coloured population resides. Yet household survey data also indicate that coloured youths are more or less as likely to complete matric as black youths.Footnote7 In spite of very low educational performance in Grade 8, black youths spend more years in school than coloured youths but are no more likely to ultimately complete matric.
Figure 2: Age-specific enrolment rates
The Grade 8 participants of TIMSS in 2002 fell into one of three categories in our panel dataset: not identified in matric, identified in 2006 or identified in 2007 (implying that they had repeated one grade since 2002).Footnote8 As one might expect, the group that reached matric without repeating (that wrote matric in 2006) had performed better on average in Grade 8 mathematics. Their mean score was nearly 70 points higher (0.7 standard deviations) than that of the group not identified in matric, and nearly 60 points higher than that of the 2007 cohort. It is interesting that the average TIMSS mathematics score for the 2007 matriculants was not much higher than for the group of students not identified in matric. There are at least two possible reasons for this. It could be that there was no substantial difference between eighth-graders who dropped out of school prior to reaching matric and those who reached matric but took an extra year to do so. This is what one would expect if grade repetition is largely unrelated to actual academic proficiency. Alternatively, the distribution for those not identified could hide two underlying distributions: a distribution of mainly low TIMSS scores by students who truly did not reach Grade 12, and a stronger distribution of scores for students who actually reached matric but were ‘missed’ in the identification process.
There are intriguing differences in these follow-through patterns across the former education departments, as shows. Notably, students in formerly coloured, Indian and white schools who wrote matric in 2007 or were not identified in matric had performed considerably better in Grade 8 than students in historically black schools who wrote matric in 2006. It is also interesting that within historically black schools, the difference in TIMSS scores between students who wrote matric in 2006 and those who wrote a year later was only about 24 TIMSS points on average. Within the other categories of former department, however, the difference in Grade 8 achievement between the 2006 and 2007 matric cohorts was much more substantial. This pattern means one or both of two things: the TIMSS scores did not accurately signal ability amongst students in historically black schools; or grade promotion and repetition decisions were largely unrelated to actual learning within historically black schools, as was found by Lam et al. (Citation2011).
Table 3: Mean TIMSS mathematics scores by ex-department and matric cohort
3.2 The relationship between Grade 8 performance (TIMSS) and passing matric
Out of the original 8952 students participating in TIMSS in 2002, 1911 were found to pass matric in either 2006 or 2007. For 197 students identified in matric it is not clear whether they passed or failed, due to missing data or fewer than six subjects being taken. This means that 21.83% of those who participated in TIMSS in 2002 were found to have passed matric by 2007. Applying TIMSS sampling weights, the estimated ‘conversion rate’ from Grade 8 to a matric pass was 21.2%. However, this is a downwardly biased estimate of the true conversion rate due to imperfect identification of individuals in the matric datasets. It is possible to estimate an adjusted conversion rate by applying new weights, separately for each race group, in order to appropriately weight up those captured in matric and weight down those not identified in accordance with expected follow-through rates obtained from the GHS. Applying the re-weighting to the calculation of this rate produced a conversion rate of 32.6%. This ‘conversion rate’ is an estimate of the percentage of Grade 8 South African students that go on to pass matric without more than a one-year delay. Conversion rates (with and without the weighting adjustment) are reported by race group and by former department in .
Those who reached Grade 12 without repeating any years were more likely to pass matric (82.3% passed) than those identified in the 2007 dataset (49.1% passed). The percentage of all students identified in the matric datasets who passed in either year was 73.9%. also shows low conversion and pass rates amongst black and coloured students and amongst the historically black and historically coloured former departments. This is not surprising given the historical disadvantage and ongoing low socio-economic status of these groups.
A probit regression was estimated to investigate how the relationship between Grade 8 achievement and passing matric differed across the historically different sections of the school system. The dependent variable took a value of one if a student passed matric in either 2006 or 2007, and a value of zero if a student was observed in the matric datasets but did not pass. The explanatory variables included the TIMSS mathematics score in Grade 8, dummy variables for each of the former departments and variables interacting former department with TIMSS mathematics score. The results are reported in . The interaction variables make the coefficients hard to interpret without graphically representing the estimated probabilities of passing matric; this is therefore presented in . The kernel density distributions of TIMSS scores by former department as shown in provide a sense of how concentrated TIMSS scores were at various points on the horizontal axis.
Figure 3: Predicted probabilities of passing matric by former department (based on )
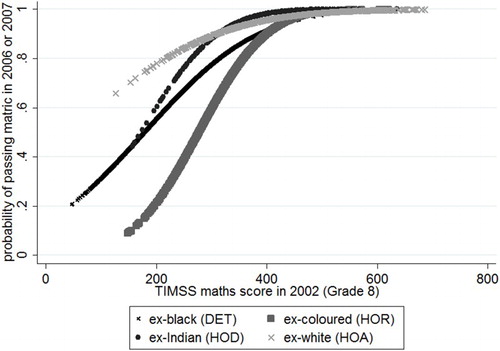
Table 4: Probit regression predicting passing matric
As expected, performance in Grade 8 mathematics was strongly predictive of passing matric. However, this relationship differed across the former education departments. This might be regarded as evidence that these different parts of the school system were not equally effective at ‘converting’ Grade 8 achievement into matric outcomes. One striking feature of , which may surprise those familiar with the South African education system, is that there seems to be better conversion within historically black schools (ex DET) than within historically coloured schools (ex HOR). At given levels of Grade 8 performance, the probability of passing matric was higher within historically black schools than in historically coloured schools.
This might be interpreted as a somewhat redemptive finding for historically black secondary schools: these schools seem better at realising matric passes than historically coloured secondary schools given the levels of proficiency inherited from primary schools. Conversely, this may reflect a negative process within historically coloured secondary schools. Just as factors noted earlier, such as gangs, may affect dropout amongst the coloured population, these factors may also impact negatively on learning in secondary schools. However, a finding that essentially the value added by the school is higher in historically black secondary schools than in historically coloured secondary schools does seem at odds with most other research and received wisdom about the relative quality of these two groups of schools. Indeed, according to the TIMSS data, most simple measures of school quality were higher in historically coloured schools than in historically black schools. For example, a lower proportion of mathematics teachers in historically black schools had a degree (27.8%) than in historically coloured schools (44.6%). Similarly, class sizes were larger amongst historically black schools (46.3 on average) than in historically coloured schools (41.8 on average).
What other possible explanations exist for why one observes an apparently better conversion of Grade 8 proficiency into matric passes within historically black schools? An alternative hypothesis is that students in historically black schools had systematically underperformed in TIMSS but were able to perform nearer to their true ability in matric. One reason why this might have occurred is because TIMSS testing was administered in English or Afrikaans. Consequently, many black students were at a language disadvantage whereas the majority of coloured students would have been tested in their first language. The TIMSS data confirm that only 7.4% of students in historically black schools always spoke the language of the test at home, whereas for students in historically coloured schools this figure was 61.9%. The extent of this language effect is likely to have diminished somewhat by matric, as black students may have become more accustomed to learning and being examined in English through the course of secondary school.
Another hypothesis for systematic underperformance of historically black students in TIMSS is that Grade 8 students in this part of the system may have been poorly coached for assessment. If students had not routinely been exposed to quality assessments accompanied by meaningful feedback, it is understandable that their performance in a test such as the TIMSS mathematics test would have underestimated their true ability.
Research has indeed shown that assessment in many of South Africa's schools is weak and provides an inaccurate signal to students. Lam et al. (Citation2011) describe grade progression within the schools attended by black students as a lottery. They find that grade progression is weakly linked to actual learning or ability in the schools typically attended by black students. Lam et al. conclude that the ability to assess learning accurately is a critical aspect of school quality that is lacking in many of the schools which black students attend.
Similarly, Van der Berg & Shepherd (Citation2010) found considerable discrepancies between school-based assessment scores, which are determined by schools independently, and matric examination results for the same students. Van der Berg and Shepherd find two main problems with school-based assessment. Firstly, in many schools, school-based assessment scores were weakly correlated with matric scores. This means that students received an unreliable signal of their performance compared with their classmates. Secondly, there is a problem of assessment leniency. In many schools, especially low-performing schools, school-based assessment scores were exorbitantly higher than scores on the standardised matric examination. Weak assessment practices are probably more common and severe at the Grade 8 level than at the Grade 12 level, where schools are focused on grooming students for the high-stakes matric examination.
These two hypotheses of underperformance in TIMSS amongst historically black schools – due to a language disadvantage and/or low exposure to good assessments such as TIMSS – are speculative. It remains unclear what was responsible for the apparent better conversion of TIMSS achievement into matric passes within the historically black part of the system.
3.3 The relationship between Grade 8 performance (TIMSS) and participation in matric mathematics
In the 2006 and 2007 matric examinations students had a choice whether to participate in mathematics at the ‘higher grade’ level (a relatively advanced curriculum with a maximum of 400 marks), at the ‘standard grade’ level (a less advanced curriculum with a maximum of 300 marks) or not to participate in mathematics at all. Just over 61% of the sample that was identified in matric took mathematics at either the standard grade or higher grade level.
presents the numbers taking mathematics at each level, by former education department. As one might expect, the proportion of students taking mathematics at the higher grade was greatest within formerly white and Indian schools. The proportion of students not participating in any mathematics, however, was similar in historically black and historically white schools, despite the fact that these two groups of schools had vastly different distributions of mathematics achievement at the Grade 8 level.
Table 5: Participation in matric mathematics by former department
To investigate these patterns further, a probit regression model was estimated, predicting the probability of taking mathematics in matric conditional upon Grade 8 performance in TIMSS. The explanatory variables included the TIMSS mathematics score in Grade 8, dummy variables for each of the former departments and variables interacting former department with TIMSS mathematics score. The results are presented in and the estimated probabilities of taking mathematics are plotted in .
Figure 4: Predicted probability of taking mathematics in matric by former department (based on )
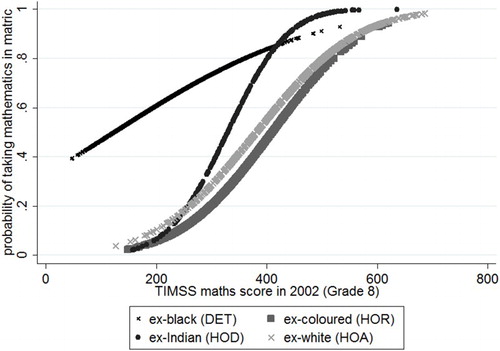
Table 6: Probit regression predicting participation in matric mathematics
shows that at given levels of Grade 8 performance, students in historically black schools had a greater probability of taking mathematics in matric than students in the rest of the school system. The difference is enormous: across most of the distribution of Grade 8 achievement the probability of taking mathematics was between 20 and 50 percentage points higher within historically black schools than within the other parts of the system.
The same explanations that were considered with respect to the differential probabilities of passing matric could apply to these differences in the probability of taking mathematics in matric. Historically black schools could have simply been more effective in producing mathematics participants. But this seems implausible given how poorly these students performed in matric mathematics. The median percentage score for students in historically black schools was 22.3% for mathematics standard grade and 26.5% for mathematics higher grade. Given that the majority of those taking matric mathematics in historically black schools failed the subject, and given that these students had dire levels of mathematical proficiency when they were in Grade 8, it can be argued that far too many students in historically black schools made a poor choice to participate in matric mathematics.
Not only would it appear that too many students in historically black schools took mathematics to matric, but the relatively flat curve for these schools in indicates that the mathematics proficiency of students in early secondary school did not strongly determine the choice to take mathematics. In contrast, the curves for the other three groups of schools were relatively steep, indicating that in these schools weak mathematics students were substantially less likely to take mathematics than strong students.
Gustafsson (Citation2011) makes a similar point through a simulation exercise showing that many students who did not pass matric in 2009 could have passed had they taken mathematical literacy rather than mathematics.Footnote9 Gustafsson's simulation also suggested that the opposite applied, although to a lesser extent: some students had the skill to pass mathematics but instead opted for the easier mathematical literacy. Clearly, what is needed is more efficient subject selection. Although increasing the number of matric mathematics passes is a strong policy imperative in South Africa, the route to achieving this is to improve mathematics learning in the earlier grades rather than through encouraging students with weak learning foundations to participate in matric mathematics.
The TIMSS-to-matric dataset demonstrates that many students in historically black schools had extremely weak mathematical proficiency in early secondary school (the point at which subject choices for matric are made) and yet made a decision to take matric mathematics, only to fail it. Other research (Van der Berg & Shepherd, Citation2010; Lam et al., Citation2011) shows alarmingly weak assessment practices in the same category of schools. For a well-informed decision as to whether to take matric mathematics there needs to be accurate information on student proficiency in mathematics. It therefore seems plausible that a lack of meaningful assessment practices may have contributed to the phenomenon of many students taking mathematics when they would have been better advised not to.
3.4 The relationship between TIMSS performance and matric mathematics and English performance
shows, using Lowess smoothing lines, the relationship between TIMSS mathematics scores and matric standard grade mathematics scores, separately for each former education department. Lowess regression does not require a linear or quadratic model specification but carries out locally weighted regressions at each data point and smoothes the result through the weighting system. This means that the shape of a Lowess line is determined by the data rather than by the imposition of a model specification.
Figure 5: Lowess regression of matric standard grade mathematics scores against TIMSS mathematics scores
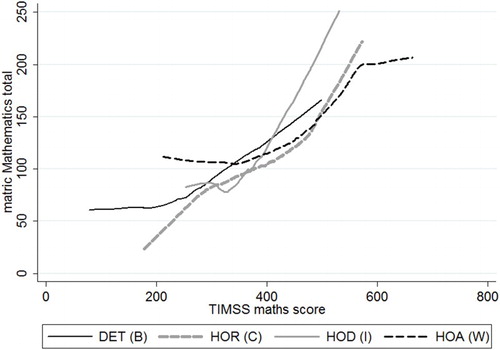
shows that in all historically different groups of schools, Grade 8 proficiency in mathematics was strongly predictive of matric achievement in standard grade mathematics. also reflects the same pattern that has consistently emerged in this paper, albeit less strikingly: students in historically black schools achieved higher matric scores than those in historically coloured schools who had achieved similar Grade 8 scores. However, as shows, the distributions of Grade 8 achievement (restricted to those who took standard grade matric mathematics) are so different across the sub-systems that there is not a lot of overlap at which to compare matric performance. It is perhaps fair to make a comparison between historically black and historically coloured schools in the range of TIMSS scores between 250 and 350.
Figure 6: Kernel density distributions of TIMSS mathematics scores by former department only amongst those taking standard grade matric mathematics
provides a further description of how predictive Grade 8 performance is for secondary school mathematics outcomes. Those who were identified in the matric datasets were divided into equal-sized quintiles according to their Grade 8 achievement. Amongst the weakest 40% of Grade 8 students, less than one in 10 achieved at least 50% in matric mathematics at either the standard grade or higher grade level, whereas one in every two of the top 20% of Grade 8 achievers did so. The numbers would be substantially lower if one derived quintiles of Grade 8 achievement using all TIMSS participants, including those not identified in matric. It is estimated that amongst the poorest-performing 40% of all TIMSS participants, only 2.5% reached matric and scored at least 50% in matric mathematics.Footnote10
Figure 7: Proportion of Grade 8 students going on to achieve at least 50% in matric mathematics
4. Conclusion
This paper confirms the wide inequalities in South African educational outcomes. Through analysis of a unique panel dataset, this paper describes how these educational inequalities develop through secondary schooling.
While inequalities at the matric level are well publicised in South Africa, enormous inequalities in educational achievement are evident by Grade 8. Achievement in Grade 8 mathematics is strongly predictive of secondary school outcomes, including survival to matric, passing matric and performance in matric mathematics. If increased social mobility is to be achieved in South Africa, interventions prior to high school are needed; at the primary school level and even during early childhood development.
Apart from disparities in the overall level of performance between the historically different parts of the school system, this paper has also highlighted interesting differences in the ability of these groups of schools to convert Grade 8 achievement into outcomes at the matric level. Amongst students who performed equally well in Grade 8, those attending historically black secondary schools performed better in matric than those in historically coloured schools. This may reflect underutilisation of human capital inherited by historically coloured secondary schools. An alternative hypothesis that cannot be conclusively demonstrated is that students in historically black schools may have systematically underperformed in TIMSS in Grade 8, due to the disadvantage of writing TIMSS in a second language or due to unfamiliarity with tests such as those administered in TIMSS. These students may have been able to perform at a level nearer to their true ability in matric, thus creating the impression of greater improvement since Grade 8.
In historically black schools the decision to participate in matric mathematics was largely unrelated to mathematical ability in prior grades. The dismal performance in both TIMSS and matric mathematics by these students would suggest that many of them made a poorly informed decision to take matric mathematics. Increasing the number of matric mathematics passes is a strong policy imperative in South Africa. Our analysis suggests that the way to achieve this is to improve mathematics learning in primary school rather than through encouraging indiscriminate mathematics participation in matric.
Disclosure statement
No potential conflict of interest was reported by the authors.
Notes
5Authors’ own calculations using the General Household Survey of 2011.
6The matching process used student name, surname, date of birth and school. After matching on all of these criteria, matches were also accepted if the name, surname and date of birth were the same even if the school had changed. This allows for those who migrated between schools to be included.
7Analysis of the 2011 GHS data indicated that roughly 44% of black 23 to 24 year olds reported having completed matric. The figure was also 44% for coloured youths.
8There were 213 students identified in both the 2006 and 2007 datasets. Amongst these, 83 students had passed in 2006 and evidently repeated in 2007 for some reason other than failure in 2006. The 2007 records for these 83 students were omitted from the analysis.
9Since 2008, there is no ‘higher grade’ or ‘standard’ and all matric candidates must participate in either mathematics or mathematical literacy.
10The re-weighting scheme was used to adjust for missingness due to an imperfect matching process.
References
- Baker, D, Goesling, B, & Letendre, G, 2002. Socioeconomic status, school quality, and national economic development: A cross-national analysis of the “Heyneman-Loxley Effect” on mathematics and science achievement. Comparative Education Review 46(3), 291–312. doi: 10.1086/341159
- Bowles, S & Gintis, H, 1976. Schooling in capitalist America. Basic Books, New York.
- Branson, N, Garlick, J, Lam, D, & Leibbrandt, M, 2012. Education and inequality: The South African case. SALDRU Working Paper (75).
- Coleman, JS, Campbell, EQ, Hobson, CJ, McPartland, J, Mood, AM, Weinfeld, FD, & York, RL, 1966. Equality of educational opportunity. US Government Printing Office, Washington, DC.
- Cunningham, A & Stanovich, K, 1997. Early reading acquisition and its relation to reading experience and ability 10 years later. Developmental Psychology 33, 934–45. doi: 10.1037/0012-1649.33.6.934
- Feinstein, L, 2003. Inequality in the early cognitive development of British children in the 1970 cohort. Economica 70, 73–97. doi: 10.1111/1468-0335.t01-1-00272
- Fleisch, B, 2008. Primary education in crisis: Why South African schoolchildren underachieve in reading and mathematics. Juta, Cape Town.
- Gustafsson, M, 2011. The when and how of leaving school: The policy implications of new evidence on secondary schooling in South Africa. Stellenbosch Economic Working Papers (09/11).
- Heckman, JJ, 2006. Skill formation and the economics of investing in disadvantaged children. Science 312, 1900–2. doi: 10.1126/science.1128898
- Heyneman, SP & Loxley, W, 1983. The effect of primary-school quality on academic achievement across twenty-nine high-and-low-income countries. The American Journal of Sociology 88, 1162–94. doi: 10.1086/227799
- Lam, D, Ardington, C, & Leibbrandt, M, 2011. Schooling as a lottery: Racial differences in school advancement in Urban South Africa. Journal of Development Economics 95, 121–36. doi: 10.1016/j.jdeveco.2010.05.005
- Lee, VE & Burkham, DT, 2002. Inequality at the starting gate: Social background differences in achievement as children begin school. Economic Policy Institute, Washington, DC.
- Reddy, V, 2006. Mathematics and science achievement at South African schools in TIMSS 2003. HSRC Press, Cape Town.
- Reddy, V, Van der Berg, S, Janse van Rensburg, D, & Taylor, S, 2012. Educational outcomes: Pathways and performance in South African high schools. South African Journal of Science 108(3/4), 1–4. doi: 10.4102/sajs.v108i3/4.620
- Sammons, P, Elliot, K, Sylva, K, Melhuish, E, Siraj-Blatchford, I, & Taggart, B, 2004. The impact of pre-school on young children's cognitive attainment at entry to reception. British Educational Research Journal 30(5), 691–712. doi: 10.1080/0141192042000234656
- Spaull, N, 2012. Poverty and privilege: Primary school inequality in South Africa. International Journal of Educational Development 33, 436–47. doi: 10.1016/j.ijedudev.2012.09.009
- Stanovich, KE, 1986. Matthew effects in reading: Some consequences of individual differences in the acquisition of literacy. Reading Research Quarterly 21, 360–407. doi: 10.1598/RRQ.21.4.1
- Taylor, S, 2011. Uncovering indicators of effective school management in South Africa using the National School Effectiveness Study. Stellenbosch Economic Working Papers No. 10/11.
- Van der Berg, S, 2008. How effective are poor schools? Poverty and educational outcomes in South Africa. Studies in Educational Evaluation 34, 145–54. doi: 10.1016/j.stueduc.2008.07.005
- Van der Berg, S & Shepherd, D, 2010. Signalling performance: Continuous assessment and matriculation examination marks in South African schools. Stellenbosch Economic Working Papers No. 28/10.