Abstract
Rural households in the Mahafaly region of south-western Madagascar have to contend with low economic development and a risky natural environment. A survey of 665 households in the region was designed to address three research questions: what is the relationship between diversification of income sources and household wealth; how does education influence access to non-farm income sources and diversification; and how does household wealth and diversification affect well-being? The results show that the overwhelming majority of households follow a diversification strategy. Household wealth is associated with larger fields, greater crop diversity and higher diversification of income source categories. Education enhances access to high-return, non-farm income sources. Self-reported well-being is positively affected by both wealth and diversification. Better education and measures to improve inhabitants’ existing strategies for compensation of yield losses in farming are crucial for securing local livelihoods in the face of decreasing precipitation due to climate change.
1. Introduction
Madagascar is among the least developed countries in sub-Saharan Africa in terms of economic performance and human well-being (UNDP, Citation2013). Much of the population is affected by poverty and risks to livelihood such as drought, illness, flooding and crop diseases (Gunther & Harttgen, Citation2009). Rural Madagascar, and especially the south-west, is typical for economically and structurally disadvantaged rural areas dominated by smallholder agriculture (Minten & Barrett, Citation2008), a setting in which the diversification of income sources is known to play a major role in securing and improving household livelihoods.
Rural households in sub-Saharan Africa typically follow a strategy of income diversification, maintaining access to different income sources of similar importance to minimise the risk of total income failure (Ellis, Citation1998). Barrett et al. (Citation2001b:1) go so far as to claim that ‘diversification is the norm’ in sub-Saharan Africa. Income sources commonly include self-employed agricultural work but also wage labour and non-farm activities. Non-farm income sources are increasingly important and are found to influence household welfare positively (Reardon, Citation1997; Barrett et al., Citation2001b). This trend seems to be facilitated by economic development and the creation of new job opportunities (Barrett et al., Citation2001a; Lay et al., Citation2009) but also by the loss of opportunities in the farming and livestock sectors, a result of population growth and climate change (Adriansen, Citation2006; Thornton et al., Citation2007; Bigsten & Tengstam, Citation2011).
How a household diversifies its income is mainly determined by household-specific factors, such as education and wealth. Studies show that relatively well-off households tend to have more diversified income sources (e.g. Bigsten & Tengstam, Citation2011). The main reason is that households often need liquid capital or investments to access alternative income-generating activities, especially lucrative non-farm income sources and cash-crop cultivation (Barrett et al., Citation2001a; Deininger & Olinto, Citation2001; Little et al., Citation2001; Lay et al., Citation2009). In contrast, poorer households rely more on income from forests and other natural resources. While the returns to labour in these activities are low, they are often the last resort for households with no access to other income sources (Babulo et al., Citation2008; Kamanga et al., Citation2009; Tesfaye et al., Citation2011). Education enhances access to non-farm income sources (Reardon, Citation1997; Abdulai & CroleRees, Citation2001), while the activities available to households with less educated members are fewer and less lucrative, such as unskilled wage labour, resulting in less diversified income portfolios (Abdulai & CroleRees, Citation2001).
Non-exclusive determinants of diversification include risk management, seasonal variability, coping behaviour, credit market imperfections, and intertemporal saving and investment strategies (Ellis, Citation2000). To secure their income stream, households spread risk, preferring activities with a low covariate risk of failure. Empirical research indicates that households with more diversified portfolios do have a greater ability to cope with shocks (Block & Webb, Citation2001; Marschke & Berkes, Citation2006). While risk management occurs ex ante – that is, before the failure of major income sources – coping behaviour deals with such shocks ex post. Households cope by using short-term strategies such as selling livestock and assets or engaging in low-return activities (Eriksen et al., Citation2005; Lay et al., Citation2009; Codjoe & Owusu, Citation2011; Cunguara et al., Citation2011). The need for savings and investments can also motivate diversification, especially among better-off households. They often diversify to invest surplus income into long-term livelihood security (e.g. in the form of livestock or higher education for household members).
Seasonal variability is another non-exclusive determinant of diversification. In Madagascar, the strong seasonality of agricultural production is only partially buffered by effective markets, and prices for the main food crops fluctuate widely (Stifel & Randrianarisoa, Citation2006) causing seasonal poverty (Dostie et al., Citation2002). Income diversification can therefore be expected to be an important concern for rural Malagasy households. However, the literature offers only few details on their income portfolios (Casse et al., Citation2004; Tucker et al., Citation2011), apart from aggregate data (Barrett et al., Citation2006).
The present study helps to close this gap by contributing a micro-level analysis of income portfolios with a focus on diversification, well-being and two influential determinants, wealth and education. Using new data from south-western Madagascar, three questions are addressed. First, what is the relationship between diversification of income sources and household wealth in this region? Second, how does education influence the access to non-farm income sources and diversification? Third, how does household wealth and diversification affect self-reported well-being? Evidence is provided by a quantitative survey of 665 households in the Mahafaly region, which is representative for the study region.
2. Study area
Madagascar is not only a ‘biodiversity hotspot' – that is, an ‘area featuring exceptional concentrations of endemic species and experiencing exceptional loss of habitat’ (Myers et al., Citation2000:853) – but also a ‘food security hotspot’ (WFP, Citation2013), ranking 151st among the 187 countries in the 2012 UNDP Human Development Index. The annual population growth rate is 2.7% (INSTAT & ICF Macro, Citation2010), and the annual gross national income per capita amounts to a purchasing power parity of international $828 (UNDP, Citation2013). Since 2008, the percentage of people living below the poverty line of less than US$2 per day has increased by 10 percentage points, now making up 92% of Madagascar's 22 million inhabitants (World Bank, Citation2013). A political crisis that began in 2009 has caused negative economic growth rates, loss of control in governance, and worsening social indicators (AEO, Citation2013). More than 80% of the Malagasy population lives in rural areas, and approximately two-thirds of the households rely on agriculture as their economic basis. Agricultural productivity is generally so low that 62% of the rural population lives below the breadline (INSTAT, Citation2010). Household income depends heavily on the size of the household's fields and the head's level of education (INSTAT, Citation2010).
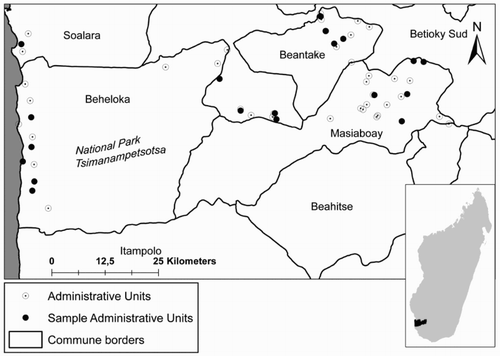
The Mahafaly Plateau geographic region is situated in the Atsimo Andrefana administrative region of south-western Madagascar (). This region is one of the most educationally disadvantaged areas of Madagascar, with over 55% of the economically active population being illiterate. More than 88% of rural households are classified as poor; that is, their income is below 468 800 Ariary (around US$200) per capita per year (INSTAT, Citation2010). Infrastructure is deficient, as the region lacks supply systems for electricity and water, and partially also telecommunication. Basic health services lack personnel, and education facilities cover only primary school. In addition, the area is hit by frequent cyclones (Andriatsimietry et al., Citation2009).
Figure 1: Coverage of the Household Baseline Survey in the Mahafaly region.
The Mahafaly Plateau region forms part of the dry spiny forest ecoregion listed as one of the 200 most important ecological regions in the world (Olson & Dinerstein, Citation2002) and includes the Tsimanampetsotsa National Park with an area of 203 400 ha (ANGAP, Citation2001). The climate is characterised as semi-arid with an annual mean temperature of approximately 24°C. Annual rainfall reaches 300 to 350 mm in the coastal zone and 400 to 600 mm on the Mahafaly Plateau to the east (UPDR, Citation2003). The climate is highly seasonal, with most rain falling between November and April (CNRE, Citation1992).
While rice is the main crop in most of Madagascar, in the extreme south and south-west it is replaced by cassava (Manihot esculenta), which tolerates infertile soils and low levels of precipitation (INSTAT, Citation2010). Maize (Zea mays) and sweet potatoes (Ipomoea batatas) can be cultivated only on new fields. Agriculture is entirely rain-fed because there are no other irrigation sources (SuLaMa, Citation2011), and recurrent drought damages both agriculture and animal husbandry (Kaufmann & Tsirahamba, Citation2006; USAID, Citation2008; Ratovonamana et al., Citation2011). Climate change has increased the variability of rainfall events, restricting agriculture even more. Food insecurity and famine are common (SuLaMa, Citation2011). Livestock is of high cultural importance for the region's agro-pastoralists, serving as currency of exchange, sacrificial offering and gift, especially at funerals (Battistini, Citation1964; Fauroux, Citation1994), and is grazed on common pastures and forest areas surrounding the villages. Local concepts of wealth refer primarily to the number of livestock owned by a household (SuLaMa, Citation2011).
3. Methodology
The Household Baseline Survey (HBS) was conducted during July and August 2011 in locations distributed over an area of approx imately 4000 km2 in the communes Beheloka, Beantake and Masiaboay, as well as in the southern parts of Betioky Sud and Soalara (). A qualitative investigation using participatory rural appraisal tools in the study region preceded and influenced the design of the HBS (SuLaMa, Citation2011).
In the HBS, a household is defined as a group of people typically related by blood or marriage who usually eat from the same cooking pot and share income, expenses and agricultural work. For our study region, this definition matches the concept of a single-budget household, which is required for the socio-economic purpose of the study (UNECE, Citation2007:181). It is also consistent with the central aspects of the household definition in national household surveys in Madagascar (INSTAT, Citation2010).
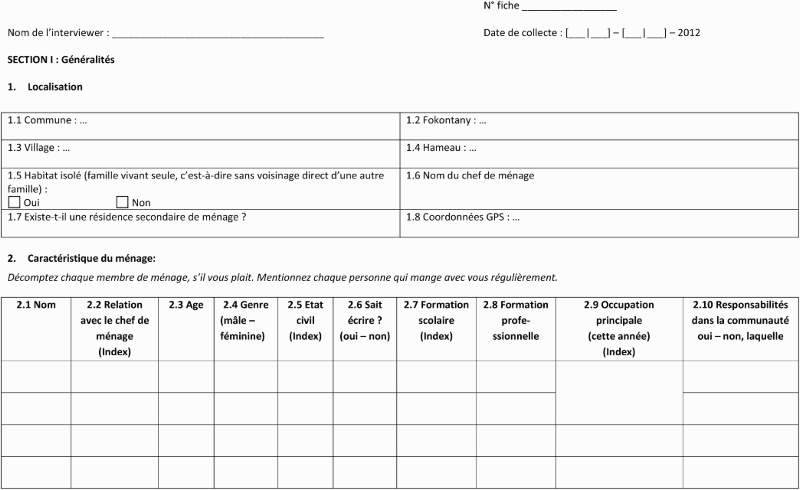
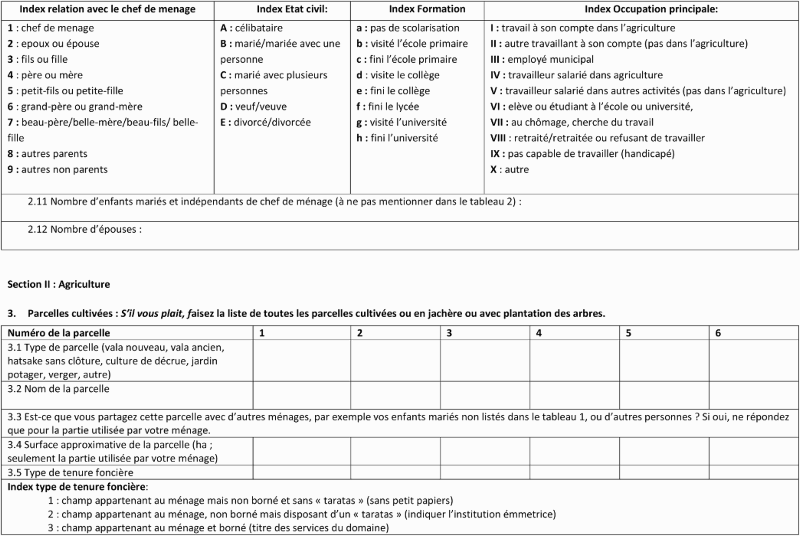
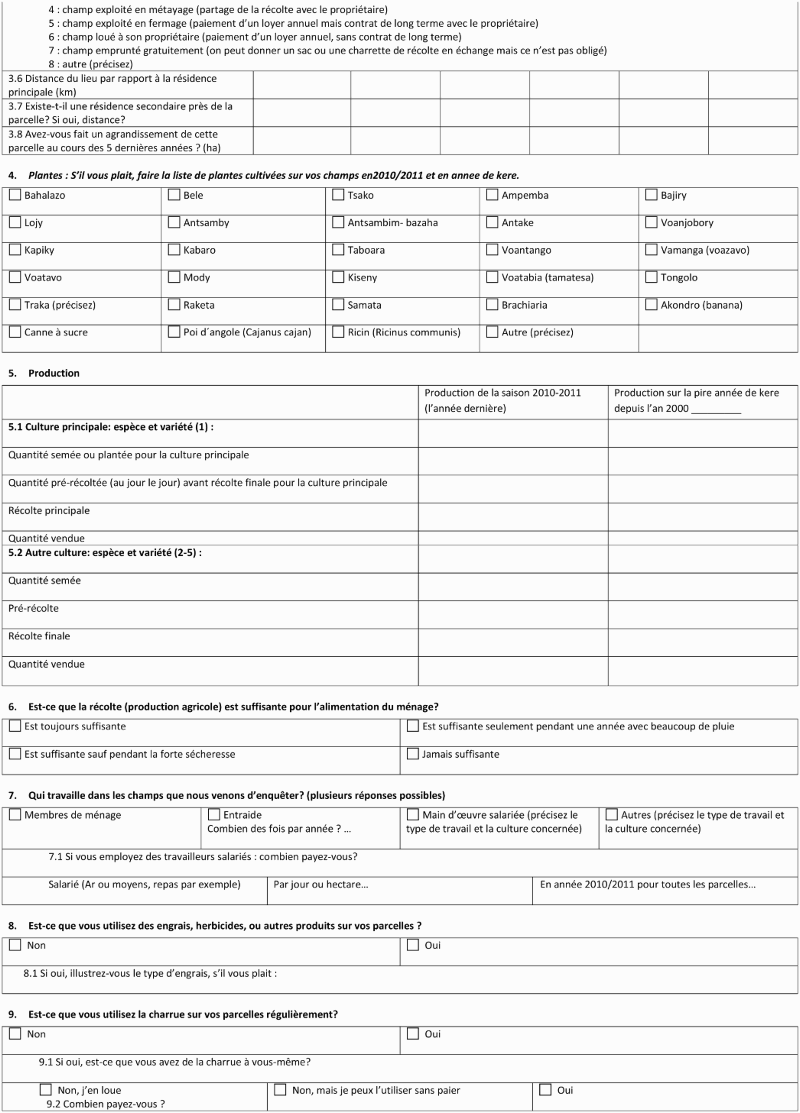
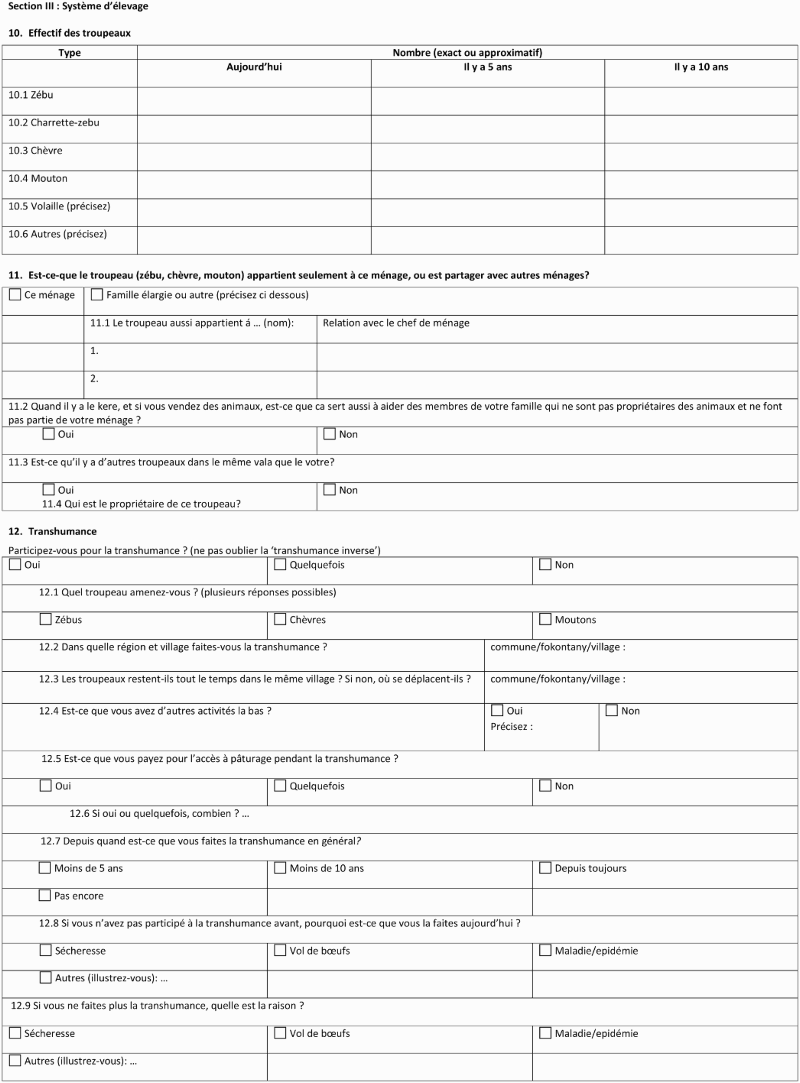
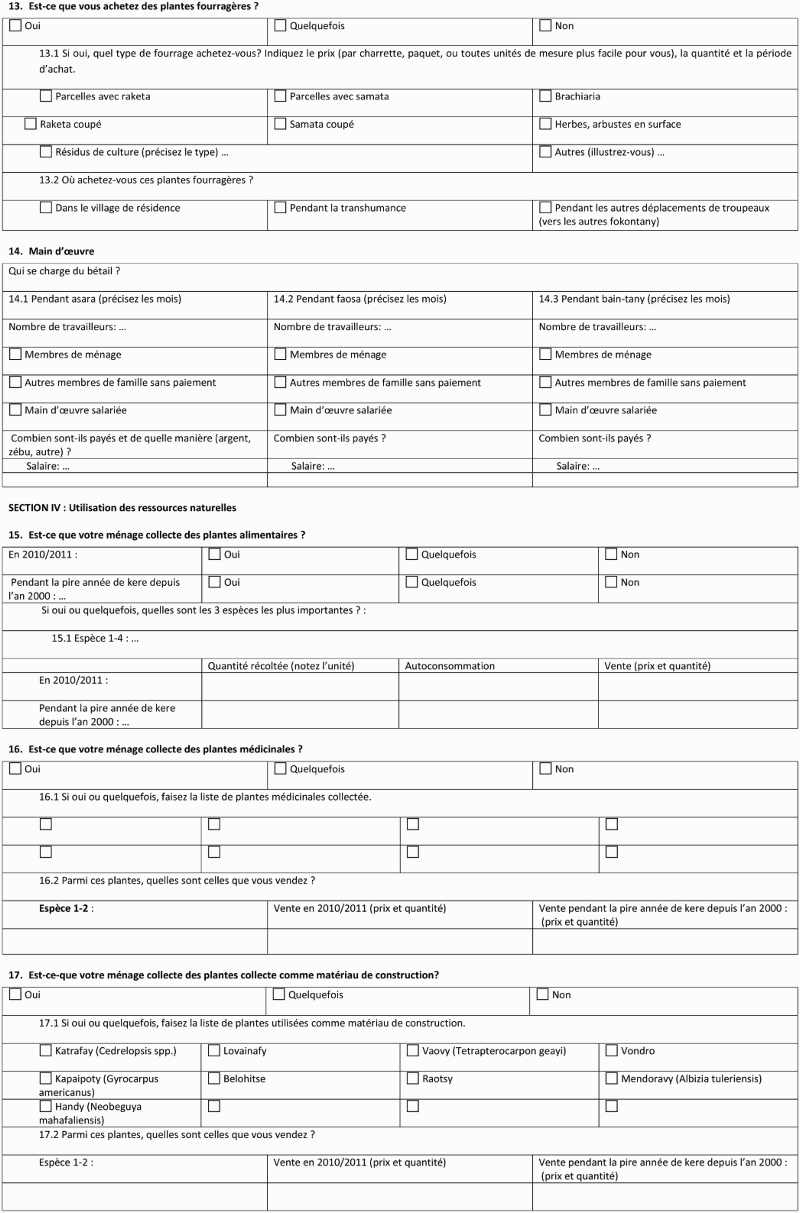
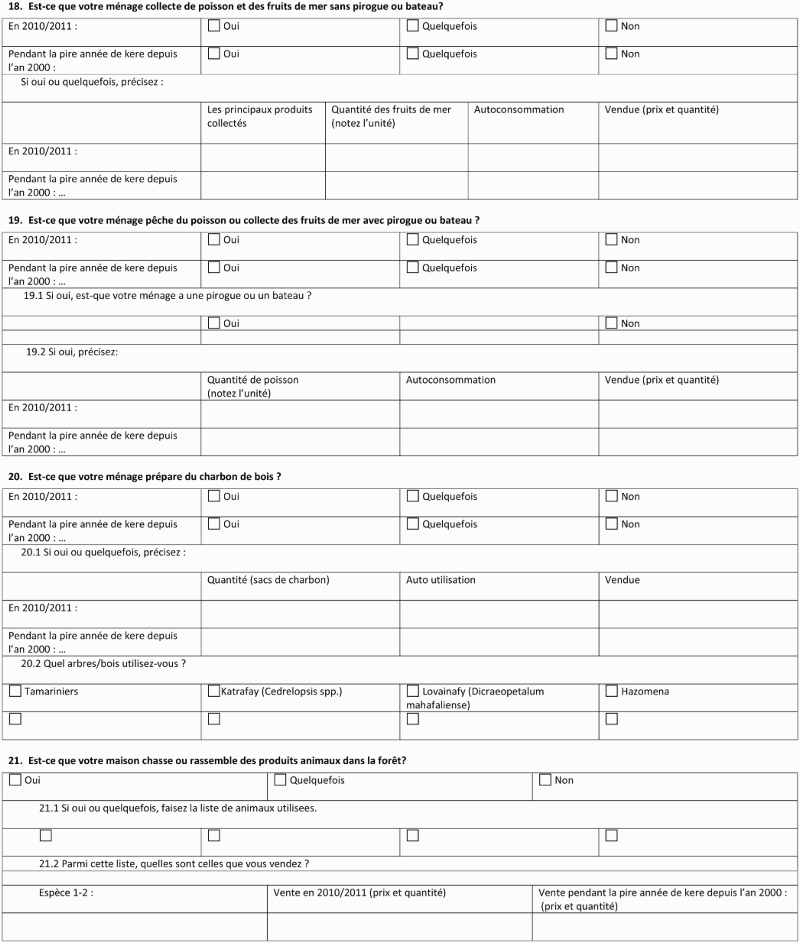
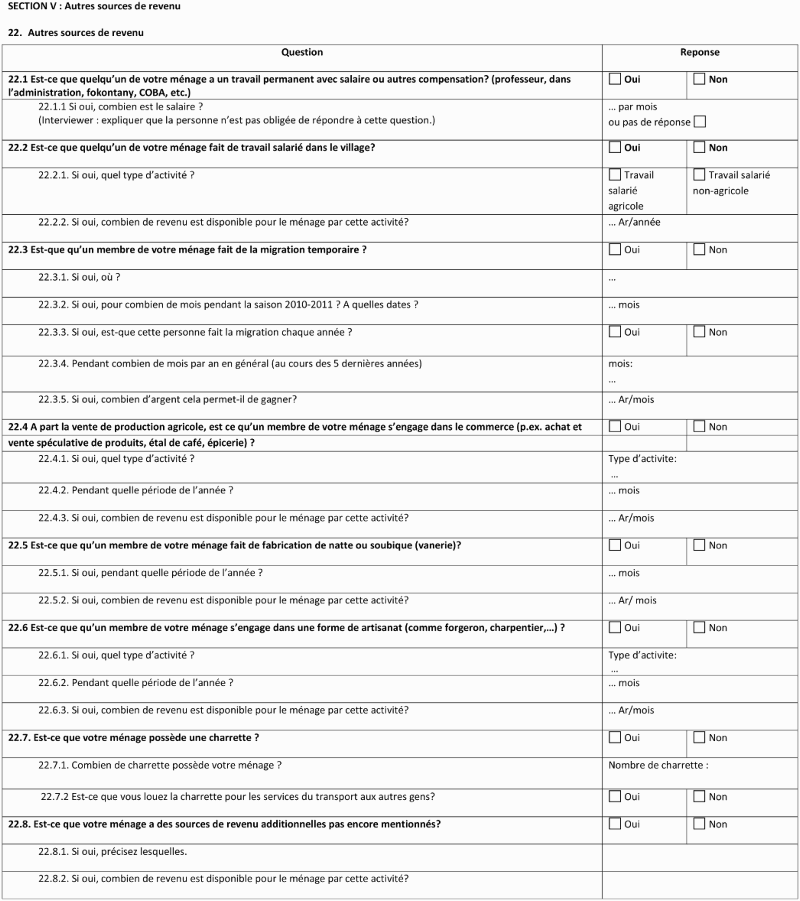
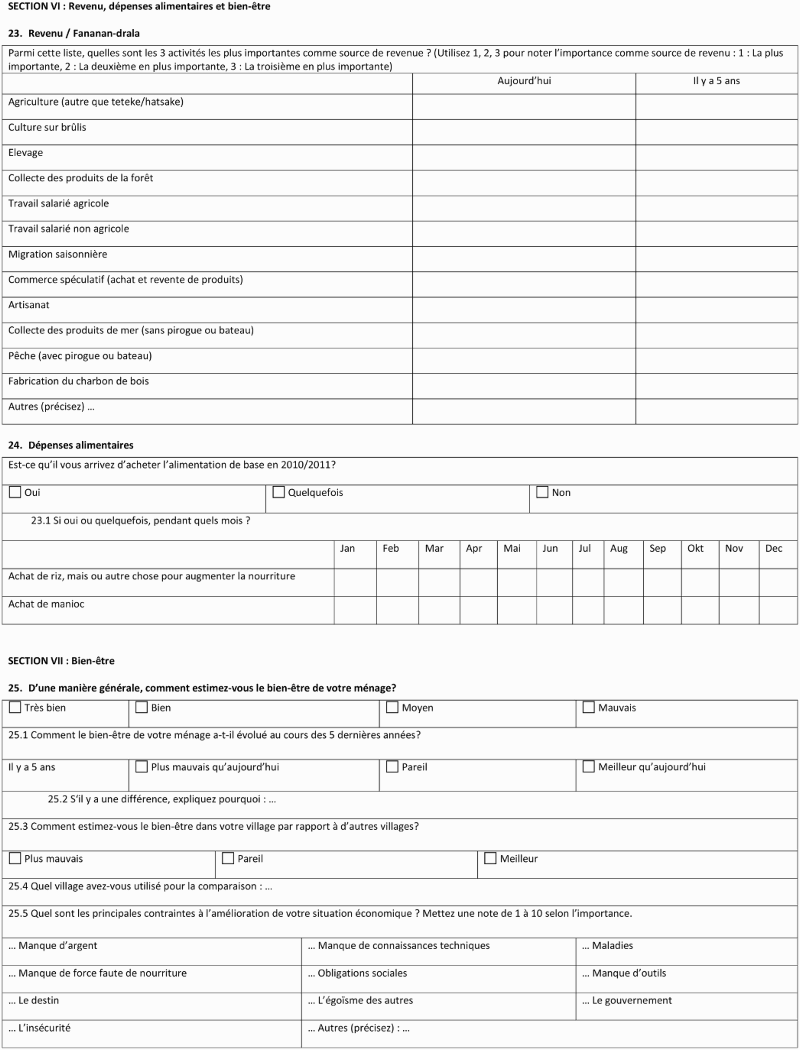
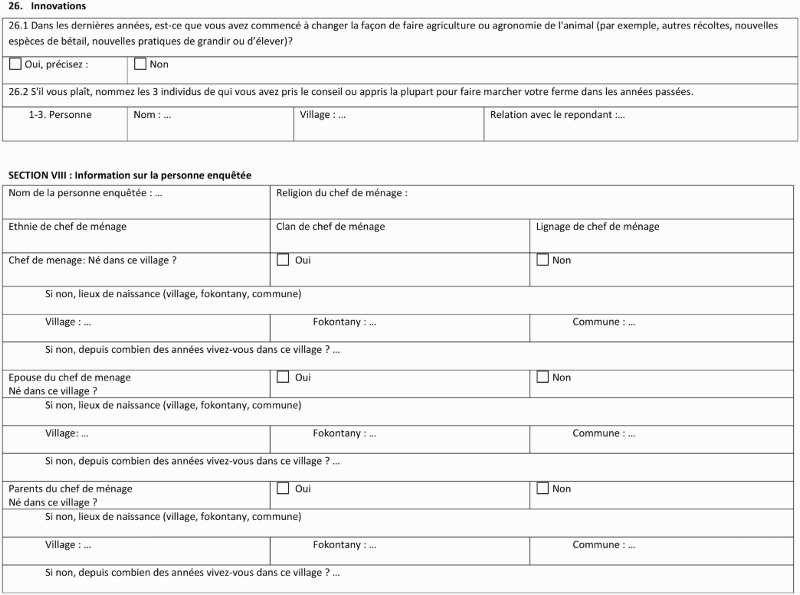
In addition to the core sections on income sources, the structured bilingual HBS questionnaire (Malagasy and French; Appendix A) contained information on the location and composition of the household as well as a self-assessment of well-being, food expenses and the relative importance of income sources. The core sections of the questionnaire report information on four categories of income sources: farming, comprising self-employed activities on arable land; livestock (goats, sheep, zebu) and poultry keeping; use of natural resources from ocean and forest areas; and non-farm activities and agricultural wage labour. These four categories are also used for the analysis since incomes from these groups have similar characteristics regarding their nature (in kind or cash) and seasonal availability. In accordance with Barrett et al. (Citation2001b:318–9), we define non-farm occupations as ‘all activities outside the agricultural sector, regardless of location or function’, which comprises all sources of income not ‘derived from the production or gathering of unprocessed crops or livestock or forest or fish products from natural resources’. We grouped agricultural wage labour in the fourth category since it is a source of ready cash income, available virtually all year round.
The HBS is based on a multistage sampling design, with the first stage targeting administrative units and the second stage targeting households. An administrative unit (fokontany) usually comprises one village, hamlets and isolated households. The sampling of administrative units draws on results of a preceding village-level survey (Brinkmann et al., Citation2014). The authors distinguished six village types, which vary according to their location in either of two sub-regions, their importance as a marketplace, the presence of fishing activities, the number of agricultural systems, the number of zebu livestock and the dominant ethnic groups. For the HBS we compiled a list of 59 administrative units, which is complete for the studied area. We excluded eight administrative units for which the predicted cluster membership in the discriminant analysis of the village cluster analysis was less than 99%. The remaining sampling list of 52 administrative units was stratified according to village-type membership. A sample of 19 administrative units was drawn by assigning them random numbers in each village-type stratum and selecting the unit with the highest number. In five administrative units of the original sample, we encountered problems that made our work unfeasible and so these were replaced with the administrative unit with the second-highest random number in the same stratum.
In the selected administrative units, the administration heads (presidents de fokontany) were asked to compile lists of households including the names of household heads and the name of their hamlet. In two administrative units where no household lists materialised the electoral list was used. The sample of households was drawn using a systematic sampling frame on the household list or electoral list, respectively (Levy & Lemeshow, Citation2008). The same method was used to select replacements for households not available for interview. The target sample size was 30% of the total household population in the selected administrative unit. This sampling rate was based on logistical and project resource constraints. Interviews were conducted with an adult member of each sampled household who felt able to answer the questions (over age 13). In the Mahafaly Plateau region, at age 14 individuals are allowed to marry and are approaching adult status in the communities.
presents an overview of the population and sample characteristics. In total, 665 households, or 10% of the total population of households in the Mahafaly Plateau region, were sampled. The replacement rate varies between 0 and 54% in the administrative units and is on average 24%. It was highest in an administrative unit where many target respondents selected from the electoral list had to be replaced mainly because they had moved away or died.
Table 1: Population totals for the study region Mahafaly Plateau and sample information for the Household Baseline Survey
For analysis, we compiled descriptive statistics using STATA (StataCorp, Citation2013a). Weighting was applied according to the inverse selection probabilities on both the administrative unit and household levels, and by taking into account the stratification of administrative units according to village types. In addition, finite population corrections were applied to both the administrative unit and household levels.
Three wealth categories were created based on livestock ownership measured in tropical ruminant livestock units (TRLU) per adult (one sheep/goat = 0.1 TRLU; one zebu = 0.7 TRLU; ILCA, Citation1993): ‘poor’ households do not own any livestock at all, ‘average’ households up to 4.3 TRLU and ‘wealthy’ households more; 4.3 TRLU is the mean size of TRLU per adult in the study region. Livestock ownership is used because the preceding information from a participatory rural appraisal (SuLaMa, Citation2011) suggests that livestock possession is the main, locally used indicator of wealth. The importance of livestock as a measure of wealth in this region was also reported by other authors (Battistini Citation1964; Kaufmann, Citation1998).
Relationships between variables were tested using chi-squared tests for categorical variables and Spearman rank-order correlations for continuous data. For chi-squared tests, instead of Pearson's chi-squared, the design-based F-value is reported, which takes the survey design into account. The non-parametric Spearman's correlations were used since the distributions of variables to be tested differed significantly from normal based on results of Shapiro–Wilk tests for normality (StataCorp, Citation2013b).
4. Results
4.1 Demographics
The average age of approximately 19 years in the sample indicates a young and growing population. Of those over 18 years old, 73% are illiterate and more than 80% did not receive formal education. Only 8% studied to high school level and beyond (). With regard to ethnicity, the population is dominated by the Tanalana and Mahafaly groups, two sub-tribes of the Mahafaly tribe (Battistini, Citation1964). The Vezo Sakalava, whose traditional occupation is fishing, live only in the coastal region west of the national park. Interethnic marriages are frequent, especially among Tanalana and Vezo Sakalava. In total, 64% and 14% of the households reported that the household head follows the traditional animist religion or Christianism, respectively. A substantial share (21%) of the household heads stated that they are non-religious.
Table 2: Characteristics of the population aged over 18 years and households surveyed in the Mahafaly region
The mean household size is approximately six persons, with an average of three persons aged over 13 years. The household size is nearly equal across all wealth categories. Only 15% of all household heads are female, with a striking difference between ‘poor’ (27%) and ‘wealthy’ households (4%). Polygyny of household heads is reported rarely at 5.4% on average.
4.2 Socio-economic situation
The studied households combine subsistence and cash income and, for the latter, engage in a wide range of income-generating activities (). Thirty-nine per cent of households were classified as ‘poor’, 46% as ‘average’ and 15% as ‘wealthy’. Appendix B reports the distribution of wealth classes per village. The average field size is 2.1 ha, and on average agriculturalists grow more than six different crops. The ‘average’ and ‘wealthy’ households tend to have larger fields and grow a larger number of crops than ‘poor’ households. This is confirmed by a Spearman's rank-order correlation between livestock possession per person with field size per person (rs = 0.275, p < 0.001) and number of crops (rs = 0.159, p = 0.002), respectively. Cassava and maize are the most frequently cultivated crops, and 84% of the farmers grow at least one kind of the six bean varieties found in the study region (Vigna unguiculata, Vigna radiata, Vigna umbellata, Lablab purpureus, Vigna subterranea and Phaseolus lunatus). Sweet potatoes, pumpkins and melons (among others Cucurbita maxima var., Cucumis melo var., Citrullus lanatus var. and Lagenaria siceraria) are also grown by the majority of farmers. About half of them grow peanuts (Arachis hypogaea), while vegetables such as tomatoes, wild cucumber and eggplant (local varieties of Solanum lycopersicum, Cucumis melo and Lagenaria siceraria) as well as other crops and fruits (sugar cane, papaya, banana) play only a minor role. Chi-squared tests indicate that using selected crops (sweet potatoes, maize, grains and pumpkins and melons) is related to the wealth categories.
Table 3: Income-generating activities of households in the Mahafaly region per wealth category
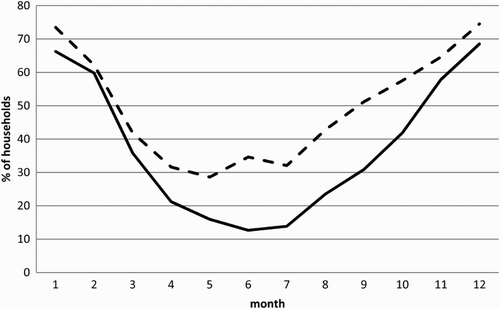
shows annual curves for staple foods purchases based on responses by the surveyed households for the agricultural year 2010/11, in which agricultural production was good. The purchase of cassava was recorded separately from that of rice, maize and other staple foods. Rice and maize were reported in qualitative pre-tests as superior substitutes to cassava and are preferred especially during festivities and times with relaxed budget constraints. Purchase of all staple foods is clearly seasonal: the purchasing rates are lowest shortly before and during the harvest season (May, June, July), while in the lean season (January, December) over 70% and 65% of the households buy rice and cassava, respectively. Only 7.3% of the all households did not report any food purchases. The purchase of staple crops by almost all households is substantiated further by the data on agricultural self-sufficiency. Only 4.5% of all farming households reported that the staple crops they grow are ‘always sufficient’ for feeding the household members. In contrast, 54% of the respondents said that their harvest is ‘never sufficient’. The remaining households reported that their crops are ‘sufficient except in times of drought’ or ‘only sufficient during years with much rain’.
Figure 2: Share of households in the Mahafaly region that purchased staple foods in 2010/11, by month (solid line: cassava; dashed line: rice, maize and others)
Besides farming, 61% of the households keep poultry (chicken, turkeys and ducks) and the same percentage keep livestock (). Approximately 48% of the households keep zebu. These are by definition the ‘average’ and ‘wealthy’ households. Poultry keeping is positively associated with the wealth categories as well. Average zebu and small ruminant herds have 17 and 25 individuals, respectively. In all parts of the study region, more households keep goats than sheep.
In addition to fields and farm animals, 97% of the households use timber and non-timber forest products from pastures and forests. The use of medicinal plants and construction material (different kinds of wood, reed and grasses) is especially common. In addition, 59% of the households collect alimentary plants to support their diet, particularly in lean times. About 23% of the households also hunt or gather forest animals. Although the endemic and endangered radiated tortoise is collected for illegal international trade in the study region (Walker & Rafeliarisoa, Citation2012), only one household mentioned this activity explicitly. Chi-squared tests indicate that using medicinal plants and construction material is related to wealth. Households in the coastal region can draw on ocean resources, but they also farm land, keep livestock and use forest resources. This applies to both the Vezo Sakalava and Tanalana ethnic groups, whereby fishing is more widespread among the Vezo Sakalava than among Tanalana.
Non-farm income and agricultural wage labour constitutes the fourth major category of income-generating activities in the study region. In total, 71% of households have at least one source of income from this category, but there are few differences regarding access to these sources based on wealth. Only 5% of households obtain income from permanent salaried work; and if so, from low-level administration jobs. Wage labour in agriculture is a more common source of income (19% of the households), occurring predominantly in the ‘poor’ and ‘average’ households. Wage labour in the non-farm sector (e.g. in construction or the tourist sector) is less important. Temporary migration occurs predominantly in ‘poor’ and ‘average’ households, the main destinations being the regional centre Tuléar and rural regions north of it, where there are opportunities for slash-and-burn agriculture during the wet season. The renting of zebu carts is a frequent occupation, especially among the ‘wealthy’ and ‘average’ households. Zebu carts are the main means of transport in the study region. In total, an average household engages in more than six income-generating activities (), or more than one activity per adult person.
The literature on income diversification suggests that households do not simply maximise the number of their income sources, but combine sources with different risk structures and seasonal characteristics. We analysed the combinations of income sources by distinguishing four categories of income-generating activities: farming (F), livestock and poultry keeping (L), natural resources use (R), and non-farm income and agricultural wage labour (O; ). While the percentage of households that depend on income from only one category is negligible, the majority of households combine income from all four categories (FLRO), and more ‘average’ and ‘wealthy’ households do so than ‘poor’ ones. The combinations FLR and FRO are also relatively common. A chi-squared test carried out on wealth classes and the number of income source categories confirmed these differences (F(1.97, 25.55) = 22.978; p < 0.001).Footnote1
Table 4: Combination of income-generating activities of households in the Mahafaly region per wealth category
Besides wealth, education may determine access to non-farm income sources. This hypothesis was tested with chi-squared tests on the education of the household head (measured in the three categories reported in ) versus the different non-farm income sources. Permanent salaried work (F(2.14, 27.83) = 21.78, p < 0.001), trade (F(1.79, 23.26) = 6.28, p = 0.008) and other income sources (F(1.76, 22.88) = 9.558, p = 0.001) were found to be positively related to education, while predominantly households from the two lowest education categories perform agricultural wage labour (F(2.27, 29.57) = 3.191, p = 0.050). However, households with educated heads are not necessarily wealthier (F(3.33, 43.35) = 0.513, p = 0.694), and do not have more diversified income portfolios (F(2.89, 37.56) = 1.694, p = 0.186).
4.3 Well-being
Interviewees were asked to self-assess the well-being of their household and to rank the constraints to improving their situation. The results are presented in and .
Table 5: Self-assessment of well-being by households in the Mahafaly region
Table 6: Relative ranking of constraints to the improvement of well-being in households of the Mahafaly region, by household wealth category
Less than 20% of all interviewees rated the well-being of their household members as ‘good’ or ‘very good’. In contrast, 48% called their situation ‘bad'; the majority in the ‘poor’ category, but only 18% of ‘wealthy’ households. A chi-squared test of independence on the results in confirmed that the self-assessed well-being is related to the wealth category (F(3.14, 40.78) = 11.53, p < 0.001). Self-reported well-being is also positively associated with diversification measured as the number of income source categories pursued by the household: fewer households assess their well-being as ‘bad’ if they combine three or four income source categories compared with those having only one or two income source categories (F(5.07, 65.89) = 3.12, p = 0.014).
In addition, 49% of the respondents said that their situation was worse than five years ago, while only 7% said their situation had improved (data not shown). The overwhelming majority (75%) of those who said their situation had worsened and named the causes of this decline attributed it to ‘lacking rain’ or ‘drought leading to hunger (kere)’. In line with this result, ‘lack of water (rain and drinking water)’, ‘lack of money' and ‘lack of strength due to lack of food’ rank highest among the constraints to well-being (). Under ‘other constraints’, most respondents mentioned problems of access to public services, insufficient agricultural production, and the lack of or low quality of agricultural land.
5. Discussion
Household surveys in developing and transition countries often face certain typical difficulties (UN, Citation2005), and ours was no exception. Developing a suitable sampling frame was challenging because information on the target population was hard to obtain and of patchy quality. Register information on households was missing, and sampling lists – where actually obtained – had to be specially compiled by representatives in the sample administrative units. Although care was taken to obtain full lists of all households in each area, the number of households on the sample lists and the commune population statistics differed in some administrative units. The source of these deviations could not be clearly identified. Thus, the survey might face a certain amount of non-coverage at the household level. The response rates are generally acceptable for a face-to-face interview approach; non-response is especially high in administrative units with low-quality sampling lists. Non-response was dealt with by replacing these households in the survey. No systematic relationship between non-response and socio-economic criteria became apparent. In addition, fluid household boundaries are a well-known problem for surveys in African countries (UNECE, Citation2007; Beaman & Dillon, Citation2009) and have to be dealt with case by case, depending on the purposes of the survey. In our study, such challenges arose especially with regard to truly polygenic families.
To create three wealth classes, livestock ownership was used as the single indicator. According to information from a participatory rural appraisal study of selected villages in the study region (SuLaMa, Citation2011), the number of wives as well as the size of fields play a role as side indicators in village-specific wealth ranking schemes. We refrained from including the latter variables for measuring household wealth since their usage and importance differs between villages (SuLaMa, Citation2011). In addition, no weighting scheme for a possible combination of variables became available. Thus, while the wealth categories are based on the most important regionally shared social wealth indicator (livestock) in the study area, it is not possible to reflect village-to-village differences in wealth definition in this study of broader scale.
The results of the survey unfold socio-economic characteristics of a rural population living in an environmentally, economically and politically disadvantaged part of a developing country. The population has low education (as indicated by low literacy levels) and insufficient access to public services (as reported in the constraints to well-being). The majority of households combine income-generating activities from different categories: farming, livestock and poultry keeping, natural resource use, and non-farm activities and agricultural wage labour. The level of specialisation is low, and the average household engages in more than one income-generating activity per person aged over 13 years. In summary, households in the Mahafaly Plateau region display a pattern of income diversification of the kind suggested in the relevant literature on sub-Saharan Africa (Ellis, Citation1998, Citation2000; Barrett et al., Citation2001b).
Virtually all households engage in subsistence farming, which, however, permanently fails to meet the nutritional needs of more than half of the households. Livestock serves as a security for times of acute food and cash shortage, but is also used to accumulate capital in the absence of banks. Zebus in particular contribute to the wealth and social status of the owner and are valued as gifts and as a means of exchange during cultural and social events (SuLaMa, Citation2011). Qualitative evidence suggests that poultry keeping, which is positively associated with the wealth indicator, serves as a low-cost starting point for the accumulation of savings in goats, sheep and zebu (SuLaMa, Citation2011).
The share of households that access non-farm income sources or agricultural wage labour is high (71%). This adds to a growing body of findings from many parts of sub-Saharan Africa highlighting the previously unappreciated importance of non-farm income sources (Reardon, Citation1997). Especially poor households are not able to draw on livestock as a security in times of food and cash shortage, which makes non-farm sources or agricultural wage labour particularly important for them. The collection of natural resources serves to fulfil the basic needs of the population. Building materials and medicinal plants, which would be difficult and expensive to substitute, are collected by more than 80% of the households. In addition, the use of natural resources contributes to risk-coping strategies; for example, with the collection of alimentary plants (SuLaMa, Citation2011). However, the evidence is not sufficient to prove that natural resources, especially alimentary plants, are used more intensively by poorer households. Instead, the collection of medicinal plants and building material were positively associated with wealth. Andriamparany et al. (Citation2014) found that yam collection (one important kind of alimentary plants) is more frequent among poorer households in the same study region, while the collection of medicinal plants is related to cultural attitudes.
For households living near the coast, fishing or the collection of sea products offers additional sources of income. Collection of sea products is widespread since it requires no investments in equipment and few special skills. Fishing requires comparably large investments in equipment, but offers a relatively secure income source without strong seasonality. Ocean products are used especially by Vezo Sakalava households, who live directly at the seashore and whose ‘traditional’ mainstay is fishing. However, they also farm arable land, raise livestock and/or pursue other non-farm income sources, which results in a diversified portfolio of income sources. For the Vezo Sakalava (in total, 24 households in the sample) other assets besides livestock may play a role in defining wealth. Thus, the wealth indicator ‘livestock’ used in this study may not fully reflect the social realities of these households. A more detailed analysis of their situation would yield further insights, but is beyond the scope of this study.
Wealth differences became apparent in several aspects of rural livelihoods: the income portfolio of wealthier households is more diversified (). By definition, wealthier households (‘average’ and ‘wealthy’ categories) have livestock – the major form of wealth storage in the study region. They also maintain larger fields and grow a greater variety of crops. While field size might explain this result, lesser need to strive for maximum staple food production in wealthier households could be another explanation. Regarding non-farm activities, ‘wealthy’ households engage more frequently in renting zebu carts which may be explained by their higher probability to own zebus and carts. Different aspects of the survey suggest that wealthier households achieve higher food security: they rank ‘lack of food’ lower among the constraints to the improvement of their well-being and gather less alimentary plants. The latter derives from a higher degree of food self-sufficiency due to larger fields and a greater ability to fill the remaining nutritional gap by the purchase of staple foods. These results are in line with findings from Madagascar as a whole (WFP & UNICEF, Citation2011).
As suggested by the literature, there is a positive relation between high-return, non-farm income sources, such as permanent salaried work or trade, and the educational level of the household head. However, the analysis shows no direct relation between wealth or diversification and education. The influence of education may be masked by lacking opportunities in the non-farm sector, which do not permit educated persons to realise the full potential of their asset.
Diversification of income sources may be of growing importance for households in the Mahafaly Plateau region as they struggle to adapt to climate change. Temperatures are predicted to increase moderately while annual precipitation (currently 300 to 600 mm) will decrease by 50 to 100 mm (Vololona et al., Citation2013), probably associated with increasing rainfall variability. These climatic changes will greatly affect agricultural productivity. Thus, in addition to adjusting farming technologies (as recommended by Vololona et al., Citation2013), improving the locals’ existing strategies for compensating yield losses in farming may help to protect the livelihoods of the people in the Mahafaly Plateau region against the effects of climate change.
6. Conclusion and policy recommendations
This analysis confirmed that most households in the Mahafaly region follow a strategy of diversification and rely on a combination of farming, livestock and poultry keeping, natural resources collection from forests and oceans, non-farm activities and agricultural wage labour for their livelihood. Although economic development is extremely poor in the study region, a high share of households was found to have at least one source from the category of non-farm income and agricultural wage labour. Background information suggests that non-farm activities, agricultural wage labour and the use of non-timber forest products, such as alimentary plants, play an important role in risk management and coping with failures in farming activities.
Regarding the first research question on the relation between wealth and diversification, the results show that wealthier households diversify their income sources to a larger extent. Wealth is also associated with larger fields and greater crop diversity.
Regarding the second question on education and non-farm income sources, households with better educated heads were found to be more likely to tap into high-return non-farm income sources, while households with less educated heads more frequently pursue agricultural wage labour. However, the analysis does not prove that higher education is directly associated with greater wealth or diversification.
Regarding the third question, the analysis showed that wealth and diversification of income sources are related to greater well-being. Among constraints to the improvement of their well-being, respondents rank the effect of instable climatic conditions on agriculture highest, but also acknowledge the lack of equipment/tools and knowledge.
These findings call for further research, especially on the determinants of diversification (e.g. on location-specific factors) which are not covered in the present paper. In addition, an historical and/or dynamic assessment of poverty and livelihood portfolios would yield a better understanding of climatic instability as a driving factor of diversification. Participatory approaches seem particularly useful in this regard.
Recognising that the economic activities of people in the Mahafaly Plateau region follow mainly a rationale of diversification implies important policy recommendations. To improve the welfare of households, development measures need to focus both on reducing the risk of agricultural production and enhancing access to non-farm income sources. Gradual improvements in infrastructure and tourism activities are likely to contribute to increased non-farm opportunities and coping capacities of households.
In addition, improvements in education would allow greater access to high-return non-farm opportunities for a broad range of households regardless of their wealth status. Given the poor equipment and condition of educational facilities in the study region, public investments in this infrastructure are necessary.
Acknowledgements
The respondents to the Household Baseline Survey on the Mahafaly plateau, logistic support from WWF and many helpful assistants made the data collection feasible. We are grateful to Joerg Ganzhorn and Frank Waetzold for valuable comments on an earlier version of the manuscript. The constructive comments of two anonymous reviewers helped to improve it further.
Disclosure statement
No potential conflict of interest was reported by the authors.
Additional information
Funding
Notes
1An anonymous reviewer asked us whether there is a relation between religion and wealth. A chi-squared test of independence rejects this hypothesis (F(2.83, 36.76) = 1.72, p = 0.182).
References
- Abdulai, A & CroleRees, A, 2001. Determinants of income diversification amongst rural households in Southern Mali. Food Policy 26(4), 437–52. doi: 10.1016/S0306-9192(01)00013-6
- Adriansen, HK, 2006. Continuity and change in pastoral livelihoods of Senegalese Fulani. Agriculture and Human Values 23(2), 215–29. doi: 10.1007/s10460-005-6108-3
- AEO (African Economic Outlook), 2013. Madagascar economic outlook. African Economic Outlook, Issy les Moulineaux.
- Andriamparany, JN, Brinkmann, K, Jeannoda, V & Buerkert, A, 2014. Effects of socio-economic household characteristics on traditional knowledge and usage of wild yams and medicinal plants in the Mahafaly region of south-western Madagascar. Journal of Ethnobiology and Ethnomedicine 10(82), 1–20.
- Andriatsimietry, R, Goodman, SM, Razafimahatratra, E, Jeglinski, JWE, Marquard, M & Ganzhorn, JU, 2009. Seasonal variation in the diet of Galidictis grandidieri Wozencraft, 1986 (Carnivora: Eupleridae) in a sub-arid zone of extreme south-western Madagascar. Journal of Zoology 279(4), 410–15. doi: 10.1111/j.1469-7998.2009.00633.x
- ANGAP (Association National de Gestion des Aires Protégées), 2001. Plan de Gestion de Conservation du Parc national de Tsimanampetsotsa. ANGAP, Toliara.
- Babulo, B, Muys, B, Nega, F, Tollens, E, Nyssen, J, Deckers, J & Mathijs, E, 2008. Household livelihood strategies and forest dependence in the highlands of Tigray, Northern Ethiopia. Agricultural Systems 98(2), 147–55. doi: 10.1016/j.agsy.2008.06.001
- Barrett, CB, Bezuneh, M & Aboud, A, 2001a. Income diversification, poverty traps and policy shocks in Cote d'Ivoire and Kenya. Food Policy 26(4), 367–84. doi: 10.1016/S0306-9192(01)00017-3
- Barrett, CB, Marenya, PP, McPeak, J, Minten, B, Murithi, F, Oluoch-Kosura, W, Place, F, Randrianarisoa, JC, Rasambainarivo, J & Wangila, J, 2006. Welfare dynamics in rural Kenya and Madagascar. Journal of Development Studies 42(2), 248–77. doi: 10.1080/00220380500405394
- Barrett, CB, Reardon, T & Webb, P, 2001b. Nonfarm income diversification and household livelihood strategies in rural Africa: Concepts, dynamics, and policy implications. Food Policy 26(4), 315–331. doi: 10.1016/S0306-9192(01)00014-8
- Battistini, R, 1964. Géographie humaine de la plaine côtière mahafaly. Éditions Cujas, Paris.
- Beaman, L & Dillon, A, 2009. Do household definitions matter in survey design? Results from a randomized survey experiment in Mali. World Bank, Washington.
- Bigsten, A & Tengstam, S, 2011. Smallholder diversification and income growth in Zambia. Journal of African Economies 20(5), 781–822. doi: 10.1093/jae/ejr017
- Block, S & Webb, P, 2001. The dynamics of livelihood diversification in post-famine Ethiopia. Food Policy 26(4), 333–50. doi: 10.1016/S0306-9192(01)00015-X
- Brinkmann, K, Fanambinantsoa, N, Ratovonamana, RY & Buerkert, A, 2014. Deforestation processes in southwestern Madagascar over the past 40 years: What can we learn from settlement characteristics? Agriculture, Ecosystem & Environment 195(2014), 231–43. doi: 10.1016/j.agee.2014.06.008
- Casse, T, Milhoj, A, Ranaivoson, S & Randriamanarivo, JR, 2004. Causes of deforestation in southwestern Madagascar: What do we know?. Forest Policy and Economics, 6(1), 33–48. doi: 10.1016/S1389-9341(02)00084-9
- CNRE (Centre National de Recherche sur l'Environnement), 1992. Développement, désertification et protection des ressources dans le sud. CNRE, Antananarivo.
- Codjoe, SNA & Owusu, G, 2011. Climate change/variability and food systems: Evidence from the Afram Plains, Ghana. Regional Environmental Change 11(4), 753–65. doi: 10.1007/s10113-011-0211-3
- Cunguara, B, Langyintuo, A & Darnhofer, I, 2011. The role of nonfarm income in coping with the effects of drought in southern Mozambique. Agricultural Economics 42(6), 701–13. doi: 10.1111/j.1574-0862.2011.00542.x
- Deininger, K & Olinto, P, 2001. Rural nonfarm employment and income diversification in Colombia. World Development 29(3), 455–65. doi: 10.1016/S0305-750X(00)00106-6
- Dostie, B, Haggblade, S & Randriamamonjy, J, 2002. Seasonal poverty in Madagascar: Magnitude and solutions. Food Policy 27(5–6), 493–518. doi: 10.1016/S0306-9192(02)00063-5
- Ellis, F, 1998. Household strategies and rural livelihood diversification. Journal of Development Studies 35(1), 1–38. doi: 10.1080/00220389808422553
- Ellis, F, 2000. The determinants of rural livelihood diversification in developing countries. Journal of Agricultural Economics 51(2), 289–302. doi: 10.1111/j.1477-9552.2000.tb01229.x
- Eriksen, SH, Brown, K & Kelly, PM, 2005. The dynamics of vulnerability: Locating coping strategies in Kenya and Tanzania. Geographical Journal 171, 287–305. doi: 10.1111/j.1475-4959.2005.00174.x
- Fauroux, E, 1994. Les échanges marchands dans les sociétés pastorales de l’ ensemble méridional de Madagascar. Cahiers des Sciences Humaines 30(1–2), 197–210.
- GADM (Database on Global Administrative Areas), 2009. Global administrative areas – Madagascar shapefile. www.gadm.org Accessed 7 February 2014.
- Gunther, I & Harttgen, K, 2009. Estimating households vulnerability to idiosyncratic and covariate shocks: A novel method applied in Madagascar. World Development 37(7), 1222–34. doi: 10.1016/j.worlddev.2008.11.006
- ILCA (International Livestock Centre for Africa), 1993. Handbook of African livestock statistics. ILCA, Addis Ababa.
- INSTAT (Institut National de la Statistique), 2010. Enquête Périodique auprès des Ménages 2010. Institut National de la Statistique, Republique de Madagascar, Antananarivo.
- INSTAT (Institut National de la Statistique) & ICF (Inner City Fund) Macro, 2010. Enquête Démographique et de Santé Madagascar 2008–2009. Institut National de la Statistique Madagascar et ICF (Inner City Fund) Macro, Antananarivo.
- Kamanga, P, Vedeld, P & Sjaastad, E, 2009. Forest incomes and rural livelihoods in Chiradzulu District, Malawi. Ecological Economics 68(3), 613–24. doi: 10.1016/j.ecolecon.2008.08.018
- Kaufmann, JC, 1998. The cactus was our kin: Pastoralism in the spiny desert of southern Madagascar. In Ginat, J & Khazanov, AM, (Eds.), Changing nomads in a changing world, 124–42. Sussex Academic Press, Brighton.
- Kaufmann, JC & Tsirahamba, S, 2006. Forests and Thorns: Conditions of change affecting mahafale pastoralists in Southwestern Madagascar. Conservation & Society 4(2), 231–261.
- Lay, J, Narloch, U & Mahmoud, TO, 2009. Shocks, structural change, and the patterns of income diversification in Burkina Faso. African Development Review–Revue Africaine de Developpement 21(1), 36–58. doi: 10.1111/j.1467-8268.2009.00202.x
- Levy, PS & Lemeshow, S, 2008. Sampling of populations – Methods and applications. Wiley, Hoboken, USA.
- Little, PD, Smith, K, Cellarius, BA, Coppock, DL & Barrett, C, 2001. Avoiding disaster: Diversification and risk management among East African Herders. Development and Change 32(3), 401–33. doi: 10.1111/1467-7660.00211
- Marschke, MJ & Berkes, F, 2006. Exploring strategies that build livelihood resilience: A case from Cambodia. Ecology and Society 11(1), 1–16.
- Minten, B & Barrett, CB, 2008. Agricultural technology, productivity, and poverty in Madagascar. World Development 36(5), 797–822. doi: 10.1016/j.worlddev.2007.05.004
- Myers, N, Mittermeier, RA, Mittermeier, CG, da Fonseca, GAB & Kent, J, 2000. Biodiversity hotspots for conservation priorities. Nature 403(6772), 853–8. doi: 10.1038/35002501
- Olson, DM & Dinerstein, E, 2002. The Global 200: Priority ecoregions for global conservation. Annals of the Missouri Botanical Garden 89(2), 199–224. doi: 10.2307/3298564
- Ratovonamana, YR, Rajeriarison, C, Edmond, R & Ganzhorn, JU, 2011. Phenology of different vegetation types in Tsimanampetsotsa National Park, south-western Madagascar. Malagasy Nature 5, 14–38.
- Reardon, T, 1997. Using evidence of household income diversification to inform study of the rural nonfarm labor market in Africa. World Development 25(5), 735–47. doi: 10.1016/S0305-750X(96)00137-4
- StataCorp, 2013a. Stata statistical software: Release 13. StataCorp LP, College Station, TX.
- StataCorp. 2013b. Stata 13 base reference manual. StataCorp LP, College Station, TX.
- Stifel, DC & Randrianarisoa, J-C, 2006. Agricultural policy in Madagascar: A seasonal multi-market model. Journal of Policy Modeling 28(9), 1023–27. doi: 10.1016/j.jpolmod.2006.06.018
- SuLaMa, 2011. Recherche participative pour appuyer la gestion durable des terres du Plateau Mahafaly dans le sud-ouest de Madagascar: Diagnostic participatif de la gestion des ressource naturelles sur le plateau Mahafaly Commune Rurale de Beheloka – Toliara. Rapport Final. Project SuLaMa, Toliara.
- Tesfaye, Y, Roos, A, Campbell, BM & Bohlin, F, 2011. Livelihood strategies and the role of forest income in participatory-managed forests of Dodola area in the bale highlands, southern Ethiopia. Forest Policy and Economics 13(4), 258–65. doi: 10.1016/j.forpol.2011.01.002
- Thornton, PK, Boone, RB, Galvin, KA, BurnSilver, SB, Waithaka, MM, Kuyiah, J, Karanja, S, Gonzalez-Estrada, E & Herrero, M, 2007. Coping strategies in livestock-dependent households in east and southern Africa: A synthesis of four case studies. Human Ecology 35(4), 461–76. doi: 10.1007/s10745-007-9118-5
- Tucker, B, Huff, A, Tsiazonera, JT, Hajasoa, P & Nagnisaha, C, 2011. When the wealthy are poor: Poverty explanations and local perspectives in Southwestern Madagascar. American Anthropologist 113(2), 291–305. doi: 10.1111/j.1548-1433.2011.01331.x
- UN (United Nations), 2005. Household sample surveys in developing and transition countries. United Nations, New York.
- UNDP (United Nations Development Programme), 2013. Human development Report 2013 – The rise of the South: Human progress in a diverse world. United Nations Development Programme, New York.
- UNECE (United Nations Economic Commission for Europe), 2007. Handbook on rural households’ livelihood and well-being: Statistics on rural development and agriculture household income. United Nations, New York and Geneva.
- UPDR (Unité de Politique pour le Développement Rural), 2003. Monographie de la Région Sud-Ouest. Ministere de l'agriculture, de l’élevage et de la pêche, Madagascar.
- USAID (US Agency for International Development), 2008. Madagascar environmental threats and opportunities assessment 2008 update. USAID, Washington, DC.
- Vololona, MR, Kyotalimye, M, Thomas, TS & Waithaka, MM, 2013. Madagascar. In Waithaka, M, Nelson, GC, Thomas, TS & Kyotalimye, M, (Eds.), East African agriculture and climate change, 213–46. International Food Policy Research Institute, Washington, DC.
- Walker, RCJ & Rafeliarisoa, TH, 2012. Distribution of radiated tortoise (Astrochelys radiata) Bush Meat poaching effort. Chelonian Conservation and Biology 11(2), 223–6. doi: 10.2744/CCB-0968.1
- WFP (World Food Programme), 2013. Global food security update: Tracking food security trends in vulnerable countries. World Food Programme, Washington, DC.
- WFP (World Food Programme) & UNICEF, 2011. Comprehensive food and nutrition security and vulnerability analysis (CFSVA+N) – Rural madagascar (Full report). World Food Programme Madagascar with UNICEF, Madgascar.
- World Bank, 2013. Madagascar: Measuring the impact of the political crisis. World Bank News, Washington, DC.
Appendix A. Questionnaire used for the Household Baseline Survey in the Mahafaly Plateau region
