
ABSTRACT
Given the broad (economic, social and environmental) objectives of a green economy, and the limitations associated with mainstream measures of economic performance (such as gross domestic product), an alternative or expanded set of indicators is required for measuring progress toward a green economy. This article develops a composite index for measuring green economic performance, based on 26 indicators across the economic, social and environmental dimensions. The index will enable comparison of a country's green economic performance both over time and relative to other countries. Furthermore, the index is constructed in such a way as to allow for disaggregation (i.e. for scores on individual components to be seen at a glance), such that areas of specific concern can be easily identified and addressed, and progress in each area monitored over time. The index was tested on data from 193 countries, and the resulting country rankings were assessed.
1. Introduction
Gross domestic product (GDP) is a measure of the market value of goods and services produced within an economy in a given period. It is therefore a reasonable indicator of the level of economic production in a region or country. However, since its inception in the 1930s, GDP has garnered a disproportionate amount of attention from both policy-makers and the general public, who have come to see it as a measure not simply of economic production, but of human well-being and social progress more broadly.
The limitations of GDP as an indicator of human well-being have been well documented (Commission of the European Communities, Citation2009; Pepper et al., Citation2009; Stiglitz et al., Citation2009; Van den Bergh, Citation2009; Fioramonti, Citation2013). Even Simon Kuznets (Citation1934), the economist who first developed GDP, cautioned against its use as a measure of human welfare. In the first place, human well-being is determined by a wide range of factors that are not captured by GDP, such as health, education, governance and political voice, social connections and relationships, social equity, environmental quality, meaningful work, leisure time, and spirituality (Sen, Citation1985; Costanza et al., Citation2007; Bartelmus, Citation2009; Moser, Citation2009; Stiglitz et al., Citation2009). While GDP does tend to correlate with some of these factors (e.g. health and education), in other cases the relationship is weak, if not negative. For example, the extensive literature on the ‘environmental Kuznets curve’ (e.g. Dasgupta et al., Citation2002; Nahman & Antrobus, Citation2005a; Carson, Citation2010) suggests that some indicators of environmental performance (e.g. carbon dioxide [CO2] emissions) tend to worsen with increased GDP. Furthermore, even where improvements in domestic environmental quality are achieved at higher income levels, these are often at the expense of the environment in other countries; such as when goods destined for consumption in developed countries are produced in developing countries (Nahman & Antrobus, Citation2005b).
GDP also fails to account for the depletion of natural capital used in the production of economic goods and services, as well as the negative impacts of economic activity on human and environmental well-being (Hamilton, Citation1994; Hamilton, Citation1998; Hanley et al., Citation1999; Arrow et al., Citation2003; Harris, Citation2007; Van den Bergh, Citation2009). Indeed, because GDP only accounts for market transactions, social and environmental costs (such as crime and pollution) tend to be counted as ‘benefits’ in the calculation of GDP.Footnote1 On the other hand, socially beneficial activities occurring outside of formal markets, such as volunteer work and care-giving, are not counted in GDP.
As a result, the relationship between GDP and subjective measures of ‘happiness’ or ‘quality of life’ is increasingly being called into question (the so-called ‘Easterlin paradox’ or ‘happiness-income paradox’) (Easterlin, Citation1974, Citation2004; Diener, Citation1993; Welsch, Citation2009; Easterlin et al., Citation2010). There is also mounting evidence that a narrow focus on GDP is at odds with the broader outcomes of sustainable development, particularly those relating to environmental well-being and social equity (Arrow et al., Citation1995; Ayres, Citation1995; Daly, Citation1996; Panayotou, Citation2000; Van den Bergh & De Mooij, Citation2002; Nahman & Antrobus, Citation2005a; Carson, Citation2010; Latouche, Citation2010; Kallis, Citation2011; Van den Bergh, Citation2011). Finally, GDP is measured on a seemingly infinite scale. In the absence of a specified maximum threshold, and of a more balanced set of indicators that are given the same prominence in policy discussions, the goal of modern societies has become to simply maximise GDP, irrespective of whether doing so actually improves well-being, and with little attention paid to the negative social and environmental consequences.
The recent global trend towards a ‘green economy’ has added renewed impetus to initiatives aimed at going ‘beyond GDP’. The United Nations Environment Program (UNEP) defines a green economy as one that results in ‘improved human well-being and social equity, while significantly reducing environmental risks and ecological scarcities’ (UNEP, Citation2011:16); that is, an economy which is ‘low carbon, resource efficient, and socially inclusive’ (Citation2011:16). Given the multiple economic, social and environmental objectives of a green economy, and the inherent limitations of GDP, an alternative (or at least expanded) set of indicators is required for measuring progress towards a green economy.
A number of attempts have been made to adjust GDP, or to develop indicators to supplement or even replace it. However, none of these indicators, on their own, are sufficiently comprehensive to reflect the multiple objectives of a green economy. For example, the Index of Sustainable and Economic Welfare, the Measure of Economic Welfare and the Genuine Progress Indicator all attempt to adjust GDP for social and environmental costs. However, while an improvement on GDP, these indicators still give primacy to economic outcomes over social and environmental outcomes. The Human Development Index (HDI) attempts to incorporate the social dimension in a more integrative way, but is based on only four indicators relating to life expectancy, education (two indicators) and income; while the environmental dimension is neglected entirely. Other indicators, such as the Ecological Footprint and the Environmental Performance Index (EPI), focus only on the environmental dimension, and are therefore useful only as complements to social and economic indicators. Finally, the System of Environmental–Economic Accounting (SEEA) provides a rigorous and standardised methodology for integrating the economic and environmental dimensions, but ignores the social dimension. Although some attempts have been made to develop more comprehensive, multi-dimensional indices, these tend to be developed within a particular country context (such as the Gross National Happiness framework in Bhutan), and are therefore not appropriate for cross-country comparisons; although they do provide useful lessons in terms of the need (and a potential methodology) to develop country-specific well-being indicator frameworks.
At the same time, it is often difficult for policy-makers to make sense of the wide variety of social, economic and environmental indicators available. These indicators tend to be measured in a range of different units, and provide seemingly contrasting signals, making it difficult for policy-makers to reconcile and interpret, and therefore act upon, the underlying trends. As such, in order to gain traction with policy-makers, alternatives to GDP should ideally take the form of a ‘dashboard’ or ‘composite index’ that summarises complex information in a relatively simple way, which can be readily understood and used by both policy-makers and the general public. In addition, the underlying data and methodologies for calculating component indicators must be transparent and readily available, so that those wishing to interrogate the data or obtain more detailed information on specific components are able to do so. Finally, such an index should ideally be measured on a fixed scale (e.g. 0 to 1 or 0 to 10), with an emphasis on achieving a balance across the social, economic and environmental dimensions, rather than simply on maximisation for its own sake. This will provide clear guidelines to policy-makers as to which areas should be targeted for improvement; and will in turn allow for policy-making that gives equal weight to all aspects of human, environmental and social well-being, rather than the current focus on maximising the production and consumption of goods and services.
Several initiatives are currently underway aimed at developing green economy indicator sets or frameworks. These include: the OECD's (Citation2011b) green growth measurement framework; UNEP's (Citation2012) work on measuring progress toward a green economy; Eurostat's (Citation2012) ‘iGrowGreen’ indicator-based assessment framework to identify country-specific challenges to promoting greener growth; the World Bank's Wealth Accounting and Valuation of Ecosystem Services global partnership, which provides technical support for countries implementing the SEEA; the Global Green Growth Institute (GGGI) indicators for green growth strategy and planning; and the Green Growth Knowledge Platform, a global partnership between the GGGI, OECD, World Bank and UNEP, which is working towards a common framework of green growth indicators (Benson & Greenfield, Citation2012).
Nevertheless, there has been little progress in developing a green economy dashboard or composite index that provides the same level of usability and simplicity offered by GDP. In addition, existing initiatives are largely based in developed economies; and as such tend to emphasise the economic and environmental dimensions of the green economy, and to neglect social and broader developmental issues of relevance to many developing countries.
Furthermore, the emphasis in existing green economy indicator frameworks tends to be on indicators of relative decoupling;Footnote2 that is, indicators of reduced resource use or environmental impact per unit GDP (e.g. CO2 emissions per $ GDP). Indicators of absolute decoupling (reduced impact of the economy as a whole) are generally missing from these frameworks. Indicators of relative decoupling, while important in terms of measuring the resource or emissions intensity of an economy, can be misleading; total emissions (for example) can still be increasing, as long as they are increasing at a lower rate than GDP. Indicators of relative decoupling therefore fail to reflect the urgency of the need for a transition toward a green economy. As such, given recent evidence suggesting that four out of the nine ‘planetary boundaries’ have already been exceeded (Steffen et al., Citation2015), and the need for urgent action on issues such as climate change, the focus should arguably be on indicators of absolute (rather than relative) decoupling; although these will necessarily have to be on a per-capita basis (to reflect the difference in population size between countries), and over a specified time period (e.g. CO2 emissions per capita per year).
This article aims to address some of these gaps by developing a composite index for measuring overall progress toward a green economy, namely the Green Economy Index (GEI). The index is based on a number of indicators reflecting green economic principles and criteria across the economic, social and environmental dimensions, of relevance to both developed and developing countries. The aim of the index is to aid comparison of a country's performance both over time and relative to other countries, in a simple and user-friendly way. In addition, the index is constructed in such a way as to allow for disaggregation (i.e. for scores on individual indicators to be seen at a glance), such that areas of specific concern can be easily identified and addressed, and progress monitored over time.
2. Approach
2.1. Development of conceptual framework
According to the OECD, indicators of a green economy need to be embedded in a conceptual framework which reflects the integrated nature of a green economy while ‘organising the indicators in a way useful to decision-makers and the public’ (Citation2011b:16). Both the OECD (Citation2011b) and UNEP (Citation2012) have developed such frameworks for green economy indicators. However, the OECD framework is silent on issues of equity, sustainability, social and human capital, and human well-being more broadly. The UNEP framework, while an improvement on that of the OECD in its emphasis on measures of well-being and poverty reduction, is weaker on issues relating to policy and to the state of specific capital stocks (e.g. natural, human, social and manufactured capital). Furthermore, neither framework explicitly represents the embeddedness of the economic and social–political systems in the natural environment, nor their foundation in the framework of governance.
Finally, the OECD framework in particular focuses on specific drivers of green growth (such as environmental taxation), and in that sense is somewhat prescriptive in terms of policy choice. During our own work in developing an alternative framework, it became apparent during both expert consultations and stakeholder workshops that the appropriate ‘drivers’ (policies etc.) of a green economy will differ between countries. Developing countries in particular have argued that there is a need for flexibility in a country's approach to the green economy, and sovereignty in choosing its own national policies; in accordance with its economic, social and environmental circumstances (African Ministers, Citation2011; Group of Citation77 and China, Citation2011). It is therefore apparent that, if a globally relevant indicator framework is to be developed, it should be based on universally applicable green economy principles, rather than specific policies and drivers. We therefore developed a generalised framework using a PCI (principles, criteria and indicators) approach (Prabhu et al., Citation1999) consisting of broad principles, which were in turn broken down into more specific criteria, for which measurable indicators were then identified.
Firstly, the principles of a green economy were identified by means of a review of key literature, and verified during focused workshops involving experts from across the economic, social and natural science disciplines, as well as stakeholders from various government departments and other institutions. In terms of the literature, we consulted published sets of green economy principles (International Chamber of Commerce, Citation2011; Green Economy Coalition, Citation2012; International Trade Union Confederation, Citation2012; New Economy Network, Citation2012; Northern Alliance for Sustainability, Citation2012; Stoddart et al., Citation2012); as well as key green economy reports (OECD, Citation2011a; UNEP, Citation2011; World Bank, Citation2012). We also took note of a similar exercise conducted by the United Nations Department of Social and Economic Affairs (UNDESA) (Allen, Citation2012), who reviewed eight published lists of green economy principles, and derived a consolidated list of 11 principles based on those occurring with greatest frequency (i.e. five or more times). However, our own research highlighted some key gaps in UNDESA's consolidated set. For example, the UNDESA list excludes green investment, green innovation, sustainable consumption and production/sustainable lifestyles, decoupling, and low carbon, all of which are key components of a green economy. In addition, it became apparent that a hierarchical framework was required, to reflect the distinction between broad principles and more specific criteria. As such, we consolidated our review with that of UNDESA (Allen, Citation2012) to develop a more comprehensive framework of 12 principles and 28 criteria, as summarised in .
Table 1. Green economy principles and criteria.
2.2. Indicator identification, assessment and selection
Having identified the principles and criteria of a green economy, the next step was to identify appropriate indicators that can be used for assessing performance with respect to each criterion at the national level. It should first be noted that some of the principles and criteria presented in are not readily amenable to measurement, at least not at the national level. Specifically, the first three principles are ‘cross-cutting’ principles which apply to the framework as a whole, and cannot be easily measured by specific indicators. For example, the principle relating to respecting planetary boundaries, ecological limits and scarcity can be operationalised through the concept of decoupling, or, more specifically, absolute decoupling. Generally speaking, as discussed in Section 1, current initiatives aimed at developing green economy indicators focus on indicators of relative decoupling. The principle of respecting planetary boundaries, ecological limits and scarcity suggests the need for a focus on indicators of absolute decoupling, rather than of relative decoupling. Thus, this principle is operationalised in the framework by ensuring that indicators of environmental performance highlight absolute (as opposed to relative) decoupling; rather than by including specific criteria and indicators associated with the principle. Similarly, the criterion relating to integrated decision-making is not amenable to measurement through a specific indicator; while the criterion relating to the reform of international governance institutions refers to change at the global level, rather than the national level.
For the remaining 26 criteria, potential indicators were identified by reviewing various indices and sets of indicators found in international literature and databases, and by consulting selected experts, government decision-makers and other stakeholders. Sources for identifying indicators included the reports and databases of international institutions such as the World Bank (e.g. the World Development Indicators and Reports), the United Nations (including the UN Statistics Division, UNEP, the Food and Agriculture Organisation, and the United Nations Development Programme's Human Development Reports), Eurostat, the OECD, and so forth. In addition, we consulted existing initiatives aimed at developing green economy indicators (OECD, Citation2011b; Eurostat, Citation2012; UNEP, Citation2012); indicators associated with initiatives such as the Millennium Development Goals (United Nations Statistics Division, Citation2008) and the International Labour Organization's (Citation2012) Decent Work initiative; and technical reports on related indices developed by other organisations, such as the Sustainable Society Index (SSI) (Van De Kerk & Manuel, Citation2010b) and the EPI (Emerson et al., Citation2012). Finally, we consulted published surveys of indicators and of composite indices (Booysen, Citation2002; Costanza et al., Citation2007; Moffat, Citation2008; Singh et al., Citation2009; Van De Kerk & Manuel, Citation2010a). In this way, over 500 potential indicators were identified.
This was followed by a more detailed assessment of each indicator according to a number of selection criteria, in consultation with selected experts and government decision-makers, in order to prioritise the most relevant and appropriate indicators to be included in the index. The criteria used for selecting indicators were as follows (adapted from OECD, Citation2011b):
Policy relevance: the indicator set should have a clear policy relevance, and in particular:
○ provide a balanced coverage of the key features of the green economy, with a focus on those that are of common interest to all countries;
○ be easy to interpret and transparent, i.e. users should be able to assess the significance of the values associated with the indicators and their changes over time;
○ provide a basis for comparisons across countries; and
○ lend itself to being adapted to different national contexts, and analysed at different levels of detail or aggregation.
Analytical soundness and validity: the indicators should be analytically sound, with universal agreement as to their validity.
Measurability: the indicators should be based on data that are available or that can be made available at a reasonable cost; and that are of known quality, measured in a standardised way, and regularly updated.
Based on the results of this assessment, a final set of 26 indicators was selected (see ). Note that one indicator (or, where necessary to reflect a more complex concept, a composite indicator or index) was defined per criterion. For the criterion relating to sustainable production (agriculture, forestry, fisheries, mining and manufacturing), only an indicator relating to agriculture (specifically organic agriculture) is defined (this criterion is therefore renamed as ‘organic agriculture’); while for the criterion relating to green infrastructure (energy, buildings, cities and transport), only an indicator relating to renewable energy is used (this criterion is therefore renamed as ‘renewable energy’). This is because the forestry, fisheries and mining sectors are highly country specific, and are not relevant to all countries; while adequate proxy indicators relating to manufacturing, buildings, cities and transport, with sufficient data at a cross-national level, could not be found. Indicators relating to the ‘greening’ of specific economic sectors generally relate to the resource and emissions intensity of these sectors. In this framework, indicators relating to resource use and emissions are captured at the national level, rather than at the sectoral level. As such, sector-specific indicators of resource and emissions intensity are not included in the framework.
Table 2. Indicators for measuring progress toward a green economy.
2.3. Data collection, normalisation and aggregation
Having selected a set of indicators from which the GEI will be constructed, the next step was to test the index by collecting data on the indicators for a large number of countries, and to assess the resultant rankings. Six out of the 26 indicators presented in are not yet fully developed or widely implemented/monitored (marked with a superscript ‘a’), and could therefore not be included in this initial assessment. However, it is proposed that these indicators remain part of the GEI framework, and that data on these indicators should be included in future assessments. Given their relevance to the green economy, there is an urgent need for national statistical offices to begin collecting data on these indicators where this is not yet the case.
Data were collected on the remaining 20 indicators for 193 countries (UN member states), from the sources listed in the last column of . Countries for which data were missing for three or more (i.e. >10%) of the 20 indicators were dropped from the sample, leaving a final sample of 144 countries. For countries where data were missing for only one or two indicators (i.e. ≤10% of the indicators), data for these indicators were imputed using mean scores; based either on averages for the entire sample, for countries in the same region, or for countries at a similar income level, depending on which was deemed most relevant for the indicator in question. For example, for social and economic indicators, it was generally deemed relevant to deal with missing data by imputing an average for countries at a similar income level; while for environmental indicators, it was deemed more relevant to use regional averages.
Once raw data had been collected (or imputed) for all countries in the sample, the raw data scores were normalised to a scale of 0 to 10, with ‘0’ indicating worst possible performance and ‘10' best possible performance. The need for normalisation arises because different indicators are measured in different units and on different scales. Furthermore, the range of scores on a particular scale will differ according to the indicator in question.Footnote3 Failure to address these differences could result in indicators with higher natural ranges implicitly being weighted more heavily in the composite index than those with lower ranges. Finally, for some indicators (e.g. the HDI) a higher score represents ‘better’ performance, while for others (e.g. CO2e emissions per capita) a higher score represents poorer performance. These differences in the direction of an indicator's effect also need to be addressed through normalisation.
Normalisation is simply the process of applying a mathematical formula to transform the raw data on the different indicators to a common scale (in this case 0 to 10) with a similar range, and with higher scores representing better performance across all indicators. Essentially, the aim is to ensure that all indicators are on an equal footing, allowing for comparison and aggregation. There are various normalisation techniques available, including ranking, standardisation, and min-max normalisation, each with their own advantages and disadvantages, and each appropriate in different circumstances (OECD, Citation2008). Ranking and standardisation (z-scores) are the simplest normalisation techniques, although both involve a significant loss of information – in the case of ranking, information on the absolute level of performance is lost; while in both cases, extremely good or extremely poor performance is not taken into account. Furthermore, in both cases, scores are not normalised to a convenient scale such as 0 to 1 or 0 to 10.
On the other hand, in min-max normalisation – which is the technique used by the HDI, the SSI and the EPI, among others – indicators are normalised to have an identical range (0 to 1 by default, but easily converted to any pre-determined scale), by applying one of the following formulae (depending on the direction of the indicator's effect) (Saisana & Philippas, Citation2012):
where higher raw values are desirable:
where lower raw values are desirable:
where xi′ is the normalised score, xi is the raw indicator score, and min(x) and max(x) are the minimum and maximum indicator values respectively. In this case, we have chosen a scale of 0 to 10; hence the normalised scores are multiplied by 10.
Importantly, the minimum and maximum values used in the calculation can either be the minimum and maximum as observed in the data itself; or they can be imposed (fixed) thresholds. If observed minima and maxima are used, the resulting scores can become distorted by the presence of extreme values or outliers (OECD, Citation2008), while comparability of scores over time is also compromised (as the observed minima and maxima will change over time, affecting the resulting scores). As such, it is generally recommended to use ‘imposed’ thresholds (Klugman et al., Citation2011; Saisana & Philippas, Citation2012).
However, the question then arises as to how these imposed thresholds will be determined. For some indicators, there are ‘natural’ thresholds (Saisana & Philippas, Citation2012) that can be used (e.g. for the Governance Index, for which the minimum and maximum possible scores are –2.5 and +2.5 respectively). In other cases, thresholds can be determined based on actual or desired targets (Emerson et al., Citation2012); as is the case with fossil fuel subsidies as a percentage of GDP, where a target of 0% can be seen as desirable. For other indicators, however, such as the proportion of marine and terrestrial protected areas, it is somewhat more difficult to identify natural thresholds or targets. In these cases, one option is to impose fixed thresholds based on historical maxima or minima (Klugman et al., Citation2011). This allows for comparability over time; however, it re-introduces the possibility of distortion by an outlier.
Choices around normalisation (including the choice of thresholds) need to take into account the main aim(s) of the index: to compare countries; for a country to compare its own performance on the different indicators to identify problem areas; and/or for a country to track its progress (either on individual indicators or on the overall index) over time. In this case, the emphasis was on the latter two aims, because these are more useful for policy-makers within a specific country.
We therefore applied min-max normalisation, using imposed thresholds based on natural or target minima and maxima wherever possible, to enable comparability over time. Where it was not possible to identify natural targets or thresholds, we adopted one of two approaches. Firstly, for indicators not subject to significant influence by outliers, we used historical maxima/minima (e.g. in the case of adjusted net savings as a percentage of gross national income, where the historical maximum was 47%). Otherwise, for indicators where outliers were evident, we determined thresholds based on the 10th or 90th percentile (for the minimum or maximum scores respectively). In this way, the influence of outliers could be reduced, relative to using the actual minima and maxima. Furthermore, we adjusted the observed percentile values to the nearest round number, which can be maintained as a fixed threshold in future assessments, thereby overcoming the issue of changes in percentile values over time. For example, in the case of energy consumption per capita, where the 90th percentile value was 222 GJ/capita/year, we imposed a fixed threshold of 200.
Finally, for each country, the overall index score was calculated as the simple arithmetic average of the normalised indicator scores. For the purposes of this assessment, we assigned an equal weighting to all indicators. This is standard practice for many composite indices (OECD, Citation2008), particularly in fields related to sustainable development and where the aim is to allow for cross-country comparison. In order for index scores to be comparable between countries, the same set of weights needs to be applied across all countries. Because of differences in cross-country circumstances and priorities, it is extremely difficult to determine a universally applicable set of differential weights. As such, all indicators were given an equal weighting for the purposes of this assessment; although the framework is flexible enough to allow for user-specified weights to be applied, as required.
3. Results and discussion
Following the approach outlined, the sample of 144 countries was scored (on a scale of 0 to 10) and ranked on the GEI, with an average score of 4.9. The best overall performer (Switzerland) achieved a score of 6.49, and the poorest performer (Turkmenistan) a score of 3.00. The average and disaggregated scores of the top 15 and bottom 15 performers are summarised in and respectively.
Table 3. Top 15 performers on the 2013 Green Economy Index.
Table 4. Bottom 15 performers on the 2013 Green Economy Index.
For the most part, the results of the ranking exercise conform with intuitive expectations, with the top performers mainly being European countries, who are viewed among the front-runners in the transition toward a green economy, and the bottom performers being dominated by countries which rely heavily on the extraction of significant energy and mineral resources, and/or those with high carbon footprints. These results therefore suggest that the GEI has some merit as a valid indicator of the green economy.
At the same time, however, it could be argued that the environmental impacts associated with developed countries’ consumption patterns tend to be ‘shifted’ to developing countries, where resource-intensive and ‘dirty’ industries tend to be located, even though the final products are ultimately consumed in developed countries (Nahman & Antrobus, Citation2005b). Aside from the ecological footprint, which focuses on environmental impacts embodied in consumption, most of the environmental indicators in the framework reflect environmental impacts associated with production. This results in developing countries scoring lower on environmental performance than would be the case if the source of demand is taken into account, rather than the location of production. In other words, the negative environmental impacts embodied in the goods consumed in developed countries are attributed to developing countries instead. Related to this is the issue that the developed countries at the top of the list of green economy performers would have gone through periods in the past where their development was not green, which is where today's developing countries now find themselves, such that a simple snapshot of current performance is not a fair comparison. These are limitations of the GEI that should be addressed in future research.
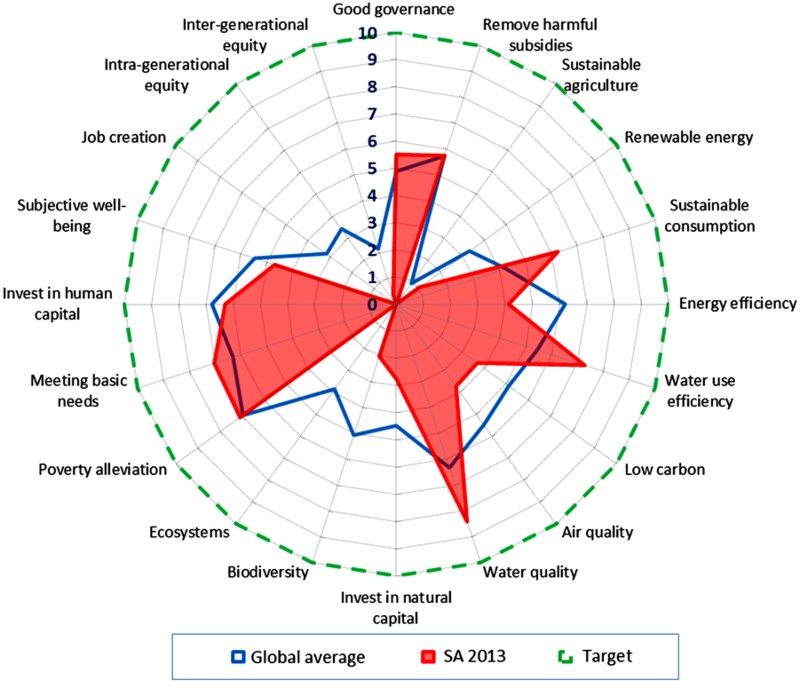
However, it should be borne in mind that the country rankings on the aggregated index presented in and are less important for a particular country as compared to the individual indicator scores, as well as changes in scores over time. Firstly, the index is constructed in such a way as to allow scores on individual indicators to be disaggregated and seen at a glance. This enables a country to identify areas of weakness and establish policy priorities, by comparing its score for each indicator with the target score of ‘10’ or with the regional or global average. For example, shows the disaggregated indicator scores for South Africa (shaded area), as well as the global averages (solid line). Scores closest to the centre of the diagram indicate poor performance (minimum score = ‘0’), while scores closest to the outer ring represent good performance (maximum or ‘target’ score = ‘10’, represented by the dashed line). The figure indicates that South Africa is doing relatively well in terms of water quality and water use efficiency, where it is above the global average, but poorly in terms of most other indicators. In this way, areas of specific concern can be easily identified, such that policy priorities can be established.
Figure 1. The 2013 Green Economy Index scores for South Africa
More importantly, the index is constructed in such a way as to allow for progress to be monitored over time, both for the overall index score and for scores on individual indicators. For example, an improvement in South Africa's overall score over time would indicate that the country is moving closer towards a green economy, while a decrease would indicate the opposite. Similarly, performance on the component indicators can be monitored over time, allowing for progress on specific aspects of the green economy to be assessed, and policy priorities to be refocused as necessary. This would be far more useful than looking at scores at only one point in time. However, given that data on many of the indicators are not updated on a regular basis, it was not possible to conduct a time-series analysis in the current study. This is something that should be addressed in future work, as more updated data become available.
4. Limitations and conclusions
The GEI described in this article provides a far more balanced and integrated picture of overall development and well-being in a particular country as compared to GDP. Unlike many of the existing alternatives to GDP, the GEI incorporates a broad range of social, economic and environmental indicators, and has been designed to be equally relevant to both developed and developing countries. Furthermore, unlike GDP, the GEI is measured on a fixed scale (0 to 10), with all indicators contributing equally to the overall score. This provides clear guidelines for policy-makers as to which areas should be targeted for improvement. In turn, this will allow for policy-making that gives equal weight to all aspects of human, environmental and social well-being, rather than the current focus on maximising the production and consumption of goods and services.
At the same time, however, the GEI is clearly a work in progress. In particular, data deficiencies imply that certain important indicators could not be included in this preliminary assessment. A clear need therefore exists for data to be collected on those indicators where this is not currently being done. In addition, some indicators are only updated infrequently (every 10 years in some cases), making it difficult to monitor progress over time. More frequent data collection is therefore required in these cases. This would in turn allow for GEI scores to be measured and compared over time, which as already mentioned would be far more useful than looking at scores for only one time period. This is therefore something that can be addressed in future work, as more updated data become available.
However, it should also be borne in mind that statistical offices in many countries have limited capacity for additional data collection, which tends to be a costly exercise. This explains why previous efforts at developing alternative indicators have failed to gain traction, and why data on existing indicators tend to be updated only infrequently, if at all.
In addition, the selection of indicators, as well as other methodological choices, could be revised in future iterations of the GEI, in response to feedback received. For example, it could be argued that organic agriculture is not necessarily sustainable or ‘green'; and likewise that some forms of extensive rangeland agriculture do not result in ecosystem degradation and should therefore be excluded from the indicator of transformed land area (a proxy for damage to ecosystems). These types of issues will be addressed in subsequent iterations of the framework.
Furthermore, the current framework was not able to address issues related to the globalised nature of economic production, which implies that environmental impacts tend to reflected in the country where goods are produced, rather than consumed. This could be seen as ‘punishing’ those countries where production facilities are located; even though the goods produced are ultimately intended for consumption in other countries, who should ultimately bear responsibility for the associated impacts. A related issue is the inherent unfairness in ‘comparing’ countries at different stages of development on the basis of a snapshot of current ‘green’ economic performance. Today's developed countries may have been able to achieve environmental improvements over time (in some cases as a result of shifting production to developing countries, as discussed), but they too would have undergone periods of high environmental impact in the earlier stages of development. Again, these issues will be addressed in subsequent iterations of the framework.
Finally, it could be argued that attempting to ‘rank’ countries in terms of well-being, whether by means of GDP or any other index, is not only implausible and misleading, but unnecessary. The vastly different circumstances and priorities of different countries implies that the determinants (and therefore indicators) of well-being, and in particular the weighting of these determinants, will differ markedly between countries. Policy choices in a particular country should therefore be guided by an indicator framework based on the specific determinants of well-being within that particular country, rather than by indices designed with an entirely different purpose and context in mind. It is therefore imperative for (particularly developing) countries to follow the example of Bhutan (Dorji, Citation2013) in identifying the determinants of well-being in their particular context, developing an indicator framework based on those determinants, and mainstreaming that framework within policy and development decision-making processes.
Acknowledgements
Useful inputs and comments were received from Council for Scientific and Industrial Research (CSIR) and external experts in various disciplines, including Michelle Audouin, Douglas Trotter, William Stafford, Kristy Faccer, Patrick O'Farrell, Odirilwe Selomane, Karen Nortjé and Amanda Driver; from stakeholders at various workshops; as well as from two anonymous reviewers.
Disclosure statement
No potential conflict of interest was reported by the authors.
Additional information
Funding
Notes
1In many cases, the negative impacts of social ‘bads’ such as crime and pollution are not incorporated into market prices, and are therefore not accounted for in GDP. At the same time, expenditures incurred as a result of these ‘bads’ (e.g. pollution treatment or ‘clean-up’ costs) are counted in GDP. As such, the net effect of crime and pollution on GDP is positive; such that they are treated as ‘goods’ from the perspective of GDP.
2‘Decoupling’ refers to reducing the environmental impact (in terms of both resource use and the generation of pollution and wastes) associated with economic activity.
3For example, depending on the indicator in question, actual scores on a percentage scale could range from 0 to 30% (in the case of organic farming area as a percentage of total farming area, for example); or from 30 to 80% (in the case of the employment to working-age population ratio).
Related Research Data
References
- African Ministers, 2011. African Consensus Statement to Rio+20 following the Africa Regional Preparatory Conference for the United Nations Conference on Sustainable Development (Rio+20), Addis Ababa, Ethiopia, October 2011.
- Allen, C, 2012. A guidebook to the green economy. Issue 2: Exploring green economy principles. United Nations Department of Economic and Social Affairs (UNDESA): United Nations Division for Sustainable Development, New York.
- Arrow, K, Bolin, B, Costanza, R, Dasgupta, P, Folke, C, Holling, CS, Jansson, BO, Levin, S, Maler, KG, Perrings, C & Pimentel, D, 1995. Economic growth, carrying capacity, and the environment. Ecological Economics 15, 91–5. doi: 10.1016/0921-8009(95)00059-3
- Arrow, KJ, Dasgupta, P & Maler, KG, 2003. Evaluating projects and assessing sustainable development in imperfect economies. Environmental and Resource Economics 26, 647–85. doi: 10.1023/B:EARE.0000007353.78828.98
- Ayres, RU, 1995. Economic growth: Politically necessary but not environmentally friendly. Ecological Economics 15, 97–9. doi: 10.1016/0921-8009(95)00073-9
- Bartelmus, P, 2009. The cost of natural capital consumption: Accounting for a sustainable world economy. Ecological Economics 68, 1850–7. doi: 10.1016/j.ecolecon.2008.12.011
- Benson, E & Greenfield, O, 2012. Surveying the ‘green economy’ and ‘green growth’ landscape. Draft for consultation. Green Economy Coalition.
- Booysen, F, 2002. An overview and evaluation of composite indices of development. Social Indicators Research 59, 115–51. doi: 10.1023/A:1016275505152
- Carson, RT, 2010. The environmental Kuznets curve: Seeking empirical regularity and theoretical structure. Review of Environmental Economics and Policy 4, 3–23. doi: 10.1093/reep/rep021
- Commission of the European Communities, 2009. GDP and beyond: Measuring progress in a changing world. Commission of the European Communities, Brussels.
- Costanza, R, Fisher, B, Ali, S, Beer, C, Bond, L, Boumans, R, Danigelis, NL, Dickinson, J, Elliott, C, Farley, J, Gayer, DE, Glenn, LM, Hudspeth, T, Mahoney, D, Mccahill, D, Mcintosh, B, Reed, B, Rizzo, DM, Simpatico, T & Snapp, R, 2007. Quality of life: An approach integrating opportunities, human needs, and subjective well-being. Ecological Economics 61, 267–76. doi: 10.1016/j.ecolecon.2006.02.023
- Daly, H, 1996. Beyond growth: The economics of sustainable development. Beacon Press, Boston.
- Dasgupta, S, Laplante, B, Wang, H and Wheeler, D, 2002. Confronting the environmental Kuznets curve. Journal of Economic Perspectives 16(1), 147–68. doi: 10.1257/0895330027157
- Diener, E, 1993. Assessing subjective well-being: Progress and opportunities. Social Indicators Research 31, 103–57. doi: 10.1007/BF01207052
- Dorji, L, 2013. Operationalizing GNH indicators into Development. Moving Beyond GDP: Alternative Indicators to Measure Social Wellbeing. Adding an African Perspective to a Global Debate. 20–22 November 2013, Cape Town, South Africa.
- Easterlin, RA, 1974. Does economic growth improve the human lot? Some empirical evidence. In David, PA & Reder, MW (Eds.), Nations and households in economic growth: Essays in honor of Moses Abramovitz. Academic Press, Inc, New York.
- Easterlin, RA, 2004. The economics of happiness. Daedalus 133, 26–33. doi: 10.1162/001152604323049361
- Easterlin, RA, Angelscu Mcvey, L, Switek, M, Sawangfa, O & Smith Zweig, J, 2010. The happiness-income paradox revisited. Proceedings of the National Academy of Sciences 107, 22463–8. doi: 10.1073/pnas.1015962107
- Emerson, JW, Hsu, A, Levy, MA, De Sherbinin, A, Mara, V, Esty, DC & Jaiteh, M, 2012. environmental performance index and pilot trend environmental performance index. Yale Center for Environmental Law and Policy, New Haven.
- Eurostat, 2012. iGrowGreen: Setting up an indicator-based assessment framework to identify country-specific challenges to promote greener growth. Draft. European Commission, Brussels.
- Fioramonti, L, 2013. Gross domestic problem. Zed Books Ltd, London.
- Green Economy Coalition, 2012. The principles of a green economy: Initial results of a global consultation. Green Economy Coalition, London.
- Group of 77 and China, 2011. Statement on behalf of the Group of 77 and China by Eliana Saissac, Second Secretary, Mission of Argentina to the United Nations, at the Interactive Discussion of the Second Preparatory Committee Meeting of the UN Conference on Sustainable Development: “Green Economy In The Context Of Sustainable Development And Poverty Eradication”, New York, 7 March 2011.
- Hamilton, K, 1994. Green adjustments to GDP. Resources Policy 20, 155–68. doi: 10.1016/0301-4207(94)90048-5
- Hamilton, C, 1998. Measuring changes in economic welfare: The genuine progress indicator for Australia. In Eckersley, R (Eds.), Measuring progress: Is life getting better? CSIRO Publishing, Clayton.
- Hanley, N, Moffatt, I, Faichney, R & Wilson, M, 1999. Measuring sustainability: A time series of alternative indicators for Scotland. Ecological Economics 28, 55–73. doi: 10.1016/S0921-8009(98)00027-5
- Harris, M, 2007. Towards genuine progress on the genuine progress indicator. University of Sydney, Sydney.
- International Chamber of Commerce, 2011. Ten conditions for a transition toward a “green economy”. International Chamber of Commerce, Paris.
- International Labour Organization, 2012. Decent work indicators: Concepts and definitions. International Labour Organization, ILO Manual Geneva, Switzerland.
- International Trade Union Confederation, 2012. Workers and trade unions’ consolidated contribution to the United Nations Conference on Sustainable Development. International Trade Union Confederation, Brussels.
- Kallis, G, 2011. In defence of degrowth. Ecological Economics 70, 873–80. doi: 10.1016/j.ecolecon.2010.12.007
- Klugman, J, Rodríguez, F & Choi, H-J, 2011. The HDI 2010: New controversies, old critiques. United Nations Development Programme, New York.
- Kuznets, S, 1934. National Income, 1929–1932. 73rd US Congress, 2nd session, Senate document no. 124. United States Congress, Washington, DC.
- Latouche, S, 2010. Degrowth. Journal of Cleaner Production 18, 519–22. doi: 10.1016/j.jclepro.2010.02.003
- Moffat, I, 2008. A preliminary analysis of composite indicators of sustainable development. International Journal of Sustainable Development and World Ecology 15, 81–7. doi: 10.1080/13504500809469772
- Moser, G, 2009. Quality of life and sustainability: Toward person–environment congruity. Journal of Environmental Psychology 29, 351–57. doi: 10.1016/j.jenvp.2009.02.002
- Nahman, A & Antrobus, G, 2005a. The environmental Kuznets curve: A literature survey. South African Journal of Economics 73(1), 105–20. doi: 10.1111/j.1813-6982.2005.00008.x
- Nahman, A & Antrobus, G, 2005b. Trade and the environmental Kuznets curve: Is Southern Africa a pollution haven? South African Journal of Economics 73(4), 803–14. doi: 10.1111/j.1813-6982.2005.00055.x
- New Economy Network, 2012. Principles for a New Economy 2012. New Economy Network, New York.
- Northen Alliance for Sustainability, 2012. The seven principles for a fair and green economy. Northen Alliance for Sustainability, Brussels.
- OECD (Organisation for Economic Cooperation and Development), 2008. Handbook on constructing composite indicators: Methodology and user guides. Organisation for Economic Cooperation and Development, Paris.
- OECD (Organisation for Economic Cooperation and Development), 2011a. Towards green growth. http://www.oecd.org/document/10/0,3746,en_2649_37465_44076170_1_1_1_37465,00.html
- OECD (Organisation for Economic Cooperation and Development), 2011b. Towards green growth: Monitoring progress. OECD indicators. Organisation for Economic Cooperation and Development, Paris.
- Panayotou, T, 2000. Economic growth and the environment. Amsterdam: CID Working Paper No. 56, forthcoming. In Mäler, KG & Vincent, J (Eds.), Handbook of environmental economics. North-Holland.
- Pepper, M, Jackson, T & Uzzell, D, 2009. An examination of the values that motivate socially conscious and frugal consumer behaviours. International Journal of Consumer Studies 33, 126–36. doi: 10.1111/j.1470-6431.2009.00753.x
- Prabhu, R, Colfer, C & Dudley, RG, 1999. Guidelines for developing, testing and selecting criteria and indicators for sustainable forest management. CIFOR special publication. Center for International Forestry Research (CIFOR), Jakarta, Indonesia.
- Saisana, M & Philippas, D, 2012. Sustainable Society Index (SSI): Taking societies’ pulse along social, environmental and economic issues: The Joint Research Centre audit on the SSI. Publications Office of the European Union, Luxembourg.
- Sen, AK, 1985. Commodities and capabilities. North Holland Publishing Company, Amsterdam.
- Singh, RK, Murty, HR, Gupta, SK & Dikshit, AK, 2009. An overview of sustainability assessment methodologies. Ecological Indicators 9, 189–212. doi: 10.1016/j.ecolind.2008.05.011
- Steffen, W, Richardson, K, Rockström, J, Cornell, SE, Fetzer, I, Bennett, EM, Biggs, R, Carpenter, SR, de Vries, W, de Wit, CA, Folke, C, Gerten, D, Heinke, J, Mace, GM, Persson, LM, Ramanathan, V, Reyers, B and Sörlin, S, 2015. Planetary boundaries: Guiding human development on a changing planet. Science 347(6223), 736–47. doi: 10.1126/science.1259855
- Stiglitz, JE, Sen, A & Fitoussi, J-P, 2009. Report by the Commission on the Measurement of Economic Performance and Social Progress. Commission on the Measurement of Economic Performance and Social Progress.
- Stoddart, H, Riddlestone, S & Vilela, M, 2012. Earth summit 2012: Principles for the green economy. A collection of principles for the green economy in the context of sustainable development and poverty eradication. Stakeholder Forum, BioRegional and The Earth Charter Initiative, London.
- UNEP (United Nations Environment Program), 2011. Towards a green economy: Pathways to sustainable development and poverty eradication. United Nations Environment Program, Geneva.
- UNEP (United Nations Environment Program), 2012. Green economy indicators: Briefing paper. United Nations Environment Program, Geneva.
- United Nations Statistics Division, 2008. Official list of MDG indicators. http://mdgs.un.org/unsd/mdg/host.aspx?Content=indicators/officiallist.htm Accessed 4 December 2012.
- Van De Kerk, G & Manuel, A, 2010a. Short survey of relevant indexes and sets of indicators concerning development towards sustainability. Northern Alliance for Sustainability, Brussels.
- Van De Kerk, G & Manuel, A, 2010b. Sustainable Society Index 2010: SSI – The compass to sustainability. Netherlands Sustainable Society Foundation, The Hague.
- Van Den Bergh, JCJM, 2009. The GDP paradox. Journal of Economic Psychology 30, 117–35. doi: 10.1016/j.joep.2008.12.001
- Van Den Bergh, JCJM, 2011. Environment versus growth — A criticism of “degrowth” and a plea for “a-growth”. Ecological Economics 70, 881–90. doi: 10.1016/j.ecolecon.2010.09.035
- Van Den Bergh, JCJM & De Mooij, RA, 2002. An assessment of the growth debate. In Van Den Bergh, JCJM (Eds.), Handbook of environmental and resource economics. Edward Elgar, Cheltenham, UK.
- Welsch, H, 2009. Implications of happiness research for environmental economics. Ecological Economics 68, 2735–42. doi: 10.1016/j.ecolecon.2009.06.003
- World Bank, 2012. Inclusive green growth: The pathway to sustainable development. The World Bank, Washington, DC.