
ABSTRACT
This study investigates the changes in the South African labour market in the post-apartheid period. While unemployment increased over the 1995–2015 period, employment also increased. Nonetheless, the extent of employment increase is not rapid enough to absorb all net entrants into the labour force, resulting in increasing unemployment, or an employment absorption rate of 65.3%. Unemployment is concentrated in specific demographically and geographically defined groups, most notably Africans, the lowly educated and those aged below 30 years, residing in rural areas in Gauteng. Finally, four worrying findings are observed: youth jobseekers aged below 30 years struggle to find their first job; chronic unemployment is more serious for the relatively older jobseekers (aged 45 years or above) with past work experience; employees working for small, medium and micro enterprises still stagnate at approximately 3.5 million; and jobseekers from the older age cohorts are less likely to actively seek work by enquiring at workplaces and answering job advertisements.
JEL CLASSIFICATION:
1. Introduction
In the pre-democratic regime, the South African labour market was segmented along racial lines, to the disadvantage of non-whites: the implementation of the Bantu Education Act of 1953 led to non-whites receiving relatively inferior quality of education. The Group Areas Act of 1950 and the Black Labour Act of 1964 established segregated areas of residence in urban areas and strict limitations on the type and conditions of employment available to Africans, respectively. The Industrial Conciliation Act of 1924 allowed the establishment of Industrial Councils, but did not recognise African trade unions or allow African employees to take part in collective bargaining. Also, the Mines and Works Act Number 12 of 1911 was the first in a series of laws which reserved certain highly-paid and highly-skilled jobs for whites.
During the post-apartheid period, there have been radical changes in the labour market legislation: the Basic Conditions of Employment Act of 1997 stipulates the minimum wages for certain sectors and specifies minimum working conditions for and rights of workers; the Labour Relations Act of 1995 outlines processes on collective bargaining and the resolution of labour disputes; and the Employment Equity Act of 1998 encourages Affirmative Action, which fulfils the need for employing more non-white workers in order to reduce societal inequalities.
Despite the new policies implemented to promote the previously disadvantaged groups since the advent of democracy, the labour market currently still suffers from persistent unemployment problems, stemming from various issues including the low level of education and poor quality of education of the previously disadvantaged groups. Recent surveys have shown that South African students on average are among the worst-performing groups when compared with their peers globally; the 2011 Trends in Mathematics and Science Study found that South Africa was the second worst-performing country in mathematics and the worst-performing country in science (HSRC, Citation2012; Martin et al., Citation2012; Mullis et al., Citation2012). Hence, the South African education system produces a continued stream of insufficiently educated new workseekers, leading to the supply of labour force (LF) participants who may remain unemployable. Moreover, there has been an emergence of large numbers of unemployed youth. This is attributed to, amongst others, their lack of experience and too high expectations on how they would fare in the labour market.
The labour legislation introduced post 1994, while affording worker’s rights, also served to limit the ability of employers to adjust their demand for labour. This inhibits the ability of the labour market to function efficiently and thereby increases unemployment. Verick (Citation2012) finds that the loss of employment during the 2008–09 recession and the consequent increase in employment in the ensuing recovery period occurred more quickly in the informal sector than the formal sector. This difference is attributed to the increased cost of hiring and firing of labour in the formal sector. Moreover, wage rigidity due to legislated minimum wages in some sectors of the labour market (agriculture, fishing, forestry and security sectors) contributes to increased levels of unemployment, as per Kingdon & Knight (Citation1999) and Bhorat et al. (Citation2012).
Some labour market participants have unrealistically high reservation wages, stemming from familial support as a result of social grants (Banerjee et al., Citation2008). Both Rankin & Roberts (Citation2011) and Zoch (Citation2013) acknowledge the negative relationship between employment likelihood and reservation wages, but people seem to have adjusted their reservation wage over time, thereby reducing its negative effect on employment. Furthermore, skills mismatch is a serious factor contributing to unemployment – and graduate unemployment is an example; the graduates produced by the education system are either not demanded by the labour market or are abundant in supply, based on their area of study. In particular, Bhorat (Citation2004:961) argues that ‘institutions of higher education are ostensibly not matching their curriculum design effectively enough with the labour demand needs of employers’. Pauw et al. (Citation2006) attribute graduate unemployment to a skills deficit issue. Similarly, Oosthuizen & Van der Westhuizen (Citation2008:56) state that ‘the graduate unemployment problem in itself is not substantial in absolute terms, it remains a concern as it is an unexpected outcome given skills shortages’. They go on to say that it is indicative of a problem in the training and education system. Lastly, Van der Berg & Van Broekhuizen (Citation2012) note that since there is no oversupply of graduates in the South African labour market, graduate unemployment trends must be indicative of skills mismatch issues.
Another serious problem facing the labour market is that the informal sector is small in relation to the formal sector, in terms of the number of employed (hovering at around 2.0 to 2.5 million). Banerjee et al. (Citation2008:717) state that, ‘unlike other African countries, the informal sector has grown very little as participation and unemployment rates have risen’. Secondly, there are barriers of entry to the informal sector, thereby making it difficult for those retrenched or unable to find work in the formal sector to obtain employment in the informal sector. This point is illustrated by Verick (Citation2012), when it is noted that inflows into the informal sector (employment) fell by 14% from 2008Q1 before the recession to 2009Q3 during the financial crisis. Thus, there must be barriers of entry to the informal sector, because one would expect during this recession period that more labour market participants would be willing to accept employment in the informal sector for survival, if entry to this sector is uninhibited. Burger & Woolard (Citation2005) specifically detail that the barriers include a lack of infrastructure and inadequate access to credit markets. Heintz & Posel (Citation2008) also point out that the existence of earnings differentials within the informal sector, depending on the type of informal-sector employment, is indicative of both barriers and mobility in this sector.
Oosthuizen (Citation2006:12) argues that ‘economic growth has been unable to provide the necessary employment opportunities required by population growth and rising labour force participation rates, resulting in a rapidly rising rate of unemployment’. The general findings of the studies conducted in the first decade after democracy are that employment growth was not sufficient to absorb all new entrants into the labour market (e.g. Kingdon & Knight, Citation2004, Citation2007; Oosthuizen, Citation2006; Yu, Citation2008; Hodge, Citation2009). Economic growth and subsequent employment growth were also not rapid enough to reduce unemployment (Burger & Woolard, Citation2005; Oosthuizen, Citation2006). The most disadvantaged segments of the population – Africans with low levels of education – were most likely to be unemployed (Yu, Citation2008).
Since 2005 the South African labour market and associated legislation has again changed, with the objective of addressing many of the issues that are now visible from labour market data. Policies such as the revised Basic Conditions of Employment Act were introduced, with the aim of reducing the labour market rigidities while still providing certain basic rights to the workers. In addition, 2006 saw the implementation of the Accelerated and Shared Growth Initiative South Africa (ASGISA) which outlined South Africa’s developmental framework and identified key areas and requirements for economic growth. One of ASGISA’s main goals was to reduce the unemployment rate under the narrow definition to 15% by 2014. This plan was replaced by the New Growth Path in 2010 which, among other things, readjusted the timeline for growth targets outlined in ASGISA to be achieved. The New Growth Path also set a new target to reduce the unemployment rate to 15%, to be achieved by 2020. More recently, the National Development Plan was introduced in 2012, with the reduction of unemployment to 6% by 2030 being the labour market objective. The Employment Tax Incentives Bill (ETIB) was implemented on 1 January 2014, with the hope of providing an incentive for employers to hire more youth workers, providing them with the essential experience and skills. With these recent changes, the need for an updated study is justified.
The main objective of this study is to add to the previous works and identify changes which have taken place in labour market trends from 1995 to 2015. Secondly, the study will identify which problems still persist and afflict the labour market. This study is essential in informing policy-makers as to the progress of the current South African economic policies.
2. Data and methodology
The data used come from the following three sources conducted by Statistics South Africa (Stats SA): the 1995 October Household Survey (OHS), the 2005 September Labour Force Survey (LFS) and the 2015 Quarterly Labour Force Survey (QLFS) in the third quarter. The 1995 and 2005 data are weighted with Census 2001 weights while the 2015 QLFS data are weighted with Census 2011 weights.Footnote1
In addition to the weighting method, the sampling techniques, the questionnaire design as well as the methodology to derive the labour market status of the working-age population have changed throughout the years, and are already well documented in recent studies (Yu, Citation2007, Citation2009, Citation2013; Branson, Citation2009). Nonetheless, the main differences across the three aforementioned surveys are highlighted in this section.
First, a rotating panel sampling technique has been adopted since LFS 2000 September, as the selected dwelling units remain in the sample for four to five consecutive surveys, with 20 to 25% of these units rotating out at each subsequent round of the survey (Yu, Citation2009:4). The advantage of this technique is that it provides the basis to monitor changes in the work situation of members of the same households over time, whilst retaining the larger picture of the overall employment situation of the country. Hence, the comparability of surveys (which are cross-sectional, strictly speaking) improves over time (Stats SA, Citation2004).
Secondly, employment could be under-estimated in the 1995–99 OHSs, in particular low-paid, informal and self-employment, because the questionnaire does not indicate how many hours the respondent must work before they are defined as employed. It is only since the adoption of the LFS in 2000 that those who worked for at least one hour in the past seven days are immediately classified as employed (Yu, Citation2007:47).
Thirdly, it is only possible to distinguish informal-sector from formal-sector workers since OHS 1997 because the employees were not asked to declare the sector status in 1995–96; the methodology to distinguish the workers from the two sectors have been revised with the introduction of the QLFS in 2008 (Yu, Citation2009:16–7). Also, the labour market aggregates under the broad definition in OHS 1995 to LFS 2007 and QLFSs are not comparable, due to various changes in the labour market status derivation methodology, particularly in the way the discouraged workseekers were distinguished. In fact, a more stringent approach is adopted in the QLFSs to classify the discouraged workseekers and subsequently the unemployed under the broad definition (Yu, Citation2009:14), because the respondents’ answers to the question on the reason(s) for not finding work or starting a business in the last four weeks are considered. Hence, the number of discouraged workseekers and broadly defined unemployed are much lower in the QLFSs.Footnote2
For the remainder of the study, labour market aggregates defined under the narrow definition would be examined, as the labour market status derivation methodology under this definition is highly similar across the surveys (Yu, Citation2007, Citation2009, Citation2013). The summative discussion may suggest that OHS 1995 data are relatively ‘weaker’ compared with the other labour surveys, but since this study primarily investigates the labour market trends in the first 20 years since the advent of democracy, the 1995 data would still be considered as the base-year data for the forthcoming analysis, just like various recent studies (Burger & Woolard, Citation2005; Burger & Jafta, Citation2006, Citation2010; Oosthuizen, Citation2006; Kingdon & Knight, Citation2007; Bhorat, Citation2009). That is, this study would not adopt sophisticated methods such as a cross-entropy re-weighting approach or a consistent labour market status derivation methodology across all surveys to re-estimate the labour market aggregates like recent studies (Yu, Citation2013; Wittenberg, Citation2014), because this is not the primary focus of this study.
Using the aforementioned 1995, 2005 and 2015 data, LF participation, employment and unemployment would be analysed. Econometric analysis would also be conducted to investigate who remains significantly more likely to find employment over the years. Finally, other issues such as chronic unemployment, youth unemployment and employment in small, medium and micro enterprises would be examined.
3. The South African labour market: Snapshots between 1995, 2005 and 2015
3.1. Employment and unemployment during the whole 20-year period
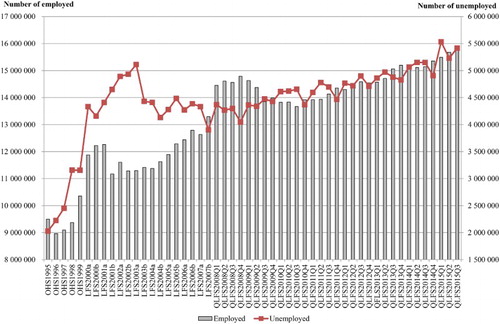
Before focusing specifically on the three surveys, shows the employment number for all 1995–2015 surveys. As the 1995–2007 employment aggregates were derived using Census 2001 weights but the 2008–15 aggregates were derived using Census 2011 weights, the weighted employment increased abruptly by 1.1 million during the changeover between LFS and QLFS (had the 2001 weights been used in both LFS 2007 September and QLFS 2008Q1, the number of employed would have only increased by 0.3 million). The number of unemployed displays a rapid upward trend between 1995 and 2003, before dropping to 3.9 million in LFS 2007 September. From 2008, unemployment increased again, reaching an all-time highest level of 5.5 million in the first quarter of 2015.
Figure 1. Number of employed and unemployed, 1995–2015. Note: OHS = October Household Survey; LFS = Labour Force Survey; QLFS = Quarterly Labour Force Survey.Source: Authors’ own calculations using OHS 1995–99, LFS 2000–07 and QLFS 2008Q1–2015Q3 data.
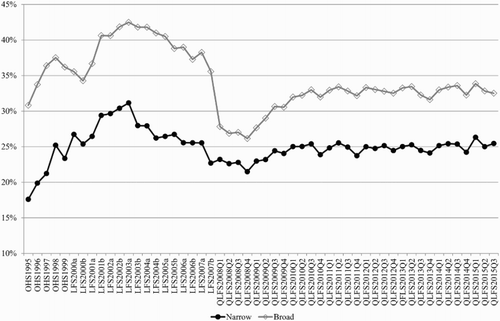
shows that the narrow unemployment rate peaked at 31.1% in September 2003, before a strong downward trend took place and this rate dropped to as low as 21.5% in the last quarter of 2008, thereby giving some hope that the ASGISA goal of reducing this rate to 15% at the end of 2014 could be achieved. Unfortunately, this rate went up after the global financial crisis, and has been stagnating at around 25% since 2010.
Figure 2. Unemployment rates, 1995–2015. Note: OHS = October Household Survey; LFS = Labour Force Survey; QLFS = Quarterly Labour Force Survey.Source: Authors’ own calculations using OHS 1995–99, LFS 2000–07 and QLFS 2008Q1–2015Q3 data.
3.2. Labour force participation
shows that in 2015 the LF number was more than 21 million, which reflects a cumulative growth of nearly 10 million individuals since 1995. The African racial group has consistently dominated the LF, accounting for 67.9% in 1995, 74.0% in 2005 and rising to 77.3% in 2015. When considering the increase in the size of the LF, the Africans accounted for a share in excess of 85% in all three surveys. The male population accounted for the larger proportion of the LF in all surveys, while the gender share of the increase in LF was almost equitably split between the two groups. The 24 to 34 years and 35 to 44 years cohorts accounted for the greatest increase of LF during the period under study.
Table 1. Labour force under the narrow definition: OHS 1995, LFS 2005 and QLFS 2015.
The Western Cape and Gauteng provinces collectively account for 46.8% of the share of the LF in 2015, rising from 40.7% in 1995. The LF size more than doubled in urban areas, rising from 7.5 million individuals in 1995 to 16.0 million in 2015. In contrast, the share of the LF in rural areas has decreased by roughly 9 percentage points. There was a decline in the share of LF members with no schooling and incomplete primary levels, expressed by a cumulative fall of 15.0 percentage points during the 20-year period. This implies that more years are spent on acquiring an educational qualification, which positively impacts upon the LF share where participants with incomplete secondary schooling and Matric account for 62.6%, 69.4% and 72.6%, respectively for the periods concerned. The share of LF with post-Matric qualifications was unchanged at 12% in 1995 and 2005 but rose to 17.0% in 2015.
In summary, LF growth since the transition could be largely attributed to the Africans, urban individuals residing in Gauteng, those aged 25 to 44 years and having attained at least some secondary schooling.
shows that the labour force participation rate (LFPR) of whites and coloureds has consistently exceeded 60%, recording levels of 63.2% and 67.9% respectively in 2015. As far as gender is concerned, in 2015 the LFPR gap between males and females has slowly been bridged, with males still accounting for the highest rate of 65.2% versus 52.0% for females. Also, an excess of 70% of LFPR was recorded in 2015 for the three age cohorts ranging between 25 and 54 years.
Gauteng and the Western Cape have garnered the highest LFPR levels, rising from about 62% in 1995 to 72.9% and 67.6% respectively in 2015. The LFPR has always been higher for the urban dwellers. Finally, the significance of education in securing and retaining employment is noted because the working-age population with no schooling recorded the lowest LFPR in all surveys, with only slightly improved levels for participants with incomplete primary and secondary schooling at just below 47% and 49% respectively in 2015. The LFPR was the highest for the degree and post-Matric certificate/diploma holders (exceeding 80%).
3.3. Employment
shows that employment increased by 6.3 million between 1995 and 2015. The bulk of the increase (5.6 million) took place amongst the Africans. In 2015 the share of Africans in employment was 73.9%. The increase in African employment can be attributed to the increase of educational attainment of the African workseekers, which not only encouraged Africans to participate in the labour market but also increased their employment likelihood.
Table 2. Employment: OHS 1995, LFS 2005 and QLFS 2015.
Although employment increased in both genders, the female share of employment increased from 39.1% in 1995 to 43.7% in 2015. This is consistent with the increase in the female LF participation. The bulk of increase in employment took place in the 25 to 34 years and 35 to 44 years cohorts. Those aged 15 to 24 years only experienced a net increase of about 250 000 jobs between 1995 and 2015 and a decline in the share of employment from 11.8% to 8.7%. The two age cohorts above the age of 45 years had a combined share of employment from 23.6% in 1995 to 29.1% in 2015, while the age group of 18 to 29 years experienced a decline in the share of employment from 27.7% in 1995 to 23.2% in 2015, despite the fact that the number of youth employment increased from 2.6 million to 3.7 million.Footnote3 The extent of increase of employment for this youth age cohort is slow compared with the middle-age cohorts, and hence validates the rationale of the government intervention through the ETIB.
Gauteng, KwaZulu-Natal, Western Cape and Eastern Cape held the highest share of total employment, with Gauteng accounting for the largest share of employment expansion of more than 2 million between 1995 and 2015, or 37.5%. Interestingly, Mpumalanga and Limpopo, the two relatively less developed provinces, accounted for 9.5% and 12.2% of the share of increase of employment between 1995 and 2015. The share of employed with no education declined. This is a reflection of the increasing demand for skilled labour by the employers. Those with Matric recorded the highest increase in the share of employment (more than 40%). The structural shift towards the hiring of more skilled labour is further consolidated by the increase in the proportion of employed accounted for by those with post-Matric qualifications (from 14.1% in 1995 to 20.2% in 2015).
Merely comparing employment growth between two periods might not provide a clear picture of employment performance of the labour market (Oosthuizen Citation2006:17). Hence, also presents the target growth rates (TGRs), actual growth rates (AGRs) and employment absorption rates (EARs).Footnote4 Focusing on the 1995–2015 period, for all the net entrants into the LF to find jobs, employment would need to grow by 102.7% between 1995 and 2015. However, the actual employment growth rate was only 67.0%, resulting in an EAR of 65.3% (i.e. out of the 100 net entrants to the LF, only 65 of them were able to find employment). also shows these rates by the demographic characteristics: the TGR was the highest for Africans (140.6%), followed by coloureds (66.3%), while this rate was the lowest for whites (10.2%). AGR was the highest for Africans (91.1%), followed by coloureds (43.0%) and this rate was the lowest for whites (7.6%).
If one only interprets the AGR, one may incorrectly deduce that Affirmative Action is highly successful because the AGR was the highest for the previously most disadvantaged group. However, as the AGR (91.1%) was lower than the TGR (140.6%) for Africans, employment growth was not rapid enough to fully absorb the net LF entrants. In fact, the EAR for Africans (64.7%) was 10 percentage points below that of whites (74.4%). Given the fact that the majority of the LF consists of Africans (), it is important for the government to implement the necessary measures to boost the AGR and EAR of this group further. The three rates were higher for the females between 1995 and 2015. Also, all three rates were higher across the older age cohorts, with the EAR rising from 22.9% for 15 to 24 year olds to 120.1% for 55 to 65 year olds. For those aged 18 to 29 years, only 41.2% of the net entrants to the labour market could successfully find employment.
The TGR was in excess of 100% in three provinces (Gauteng, Mpumalanga and Limpopo). These three provinces also recorded the highest AGR. The EAR was the highest in Limpopo (82.3%), followed by KwaZulu-Natal (80.1%) and Western Cape (71.5%). The positive finding in Limpopo could reflect the government’s efforts to promote the development in the poorer provinces. All three rates were highest for the degree holders. In particular, the EAR was 91.9%, which means that more than nine net entrants to the labour market with a bachelor degree could successfully find employment, but such likelihood was only as low as 56.0% for those with incomplete secondary education.
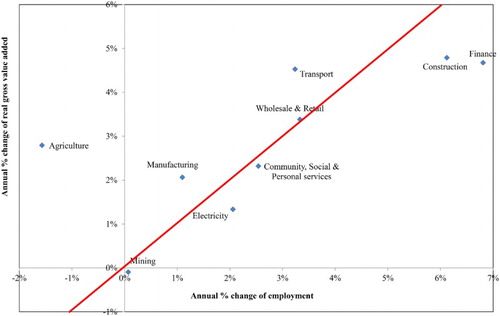
compares the annual average growth of real gross value added (GVA) and employment by each broad industry category between 1995 and 2015. The GVA figures, released by the South African Reserve Bank, are shown in constant 2010 prices, and stand for the real contributions of different kinds of economic activities (Mohr, Citation2011:24). Finance and construction industries outperformed other industry categories with an annual employment growth rate of more than 6% and a real GVA growth rate of approximately 5%. The agriculture industry experienced a decline in employment growth. This is evidence for the structural shift of the labour market towards an increased demand for highly-skilled workers. Mining was the only industry with negative real GVA growth (albeit only −0.1%). This could be attributed not only to structural change of the economy, but to other problems such as minimum wages, continuous strike activities and stagnant productivity (Bhorat, Citation2004; Burger & Woolard, Citation2005; Oosthuizen, Citation2006).
Figure 3. Annual percentage growth of employment versus annual percentage growth of real gross value added (2010 prices) by industry, 1995–2015. Note: OHS = October Household Survey; LFS = Labour Force Survey; QLFS = Quarterly Labour Force Survey.Source: Authors’ own calculations using OHS 1995, QLFS 2015Q3 and South African Reserve Bank Quarterly Bulletin data.
presents the ‘simple elasticity’ estimates that describe the relationship between output and employment, calculated as: average annual percentage change of employment/average annual percentage change of real gross domestic product (GDP).Footnote5 The GDP figures, in constant 2010 prices, are also released by the South African Reserve Bank. The simple real GDP ‘elasticity’ of total employment was 0.84 when looking at the whole 20-year period, but it increased from 0.74 in 1995–2005 to 1.04 in 2005–15. These aggregates suggest that jobless growth (positive economic growth but negative employment growth) did not take place, and employment growth was more rapid than (or more elastic) economic growth in 2005–15, as the ‘elasticity’ estimate of 1.04 indicates that employment grew by 1.04% due to 1% growth of real GDP. Nonetheless, as employment could be under-estimated in OHS 1995 (see Section 2), the 1995–2005 estimate of 0.74 may also be under-estimated.
Table 3. Employment elasticity to economic growth.
To conclude the section on employment trends, Heckprobit regressions were run on employment likelihood of the LF, conditional on LF participation. The explanatory variables included are gender, race, age, area type, province and educational attainment, as well as the number of children, adult male, adult female and elderly members in the household. The latter four variables are derived at household level and only included for the LF participation probit regressions. The results are presented in . First, lambda is statistically significant for all regressions, thereby implying the presence of sampling selection bias and the need to run the employment regressions as two-step Heckprobit models to control for LF participation likelihood. After controlling for other covariates, females are significantly more likely than males to be employed in all three survey periods. The explanation for this trend is somewhat logical, as an increased focus on gender equity has made it more attractive for females to enter the LF.
Table 4. Heckprobit regression on employment likelihood, conditional on labour force participation.
Whites remain the group with the greatest likelihood of being employed, followed by Indians and coloureds. The important inference that must be drawn from this point is that despite the Affirmative Action and Black Economic Empowerment initiatives, LF trends still show persistent disparities between Africans and other races. This confirms the finding of Burger & Jafta (Citation2006, Citation2010) that Affirmative Action policies have not been successful to redress the disadvantages in employment experienced by designated groups.
Compared with the 15 to 24 years reference age category, those aged 45 to 54 years are only significantly more likely to be employed in 2015, while those aged 55 to 65 years are most likely to be employed across all three surveys. This may be due to a lack of experience prevalent amongst younger members of the LF, making older workers much more valuable to their respective fields, or because older workers are less likely to resign as they are closer to their retirement age and stand to lose more financially.
also shows that the jobseekers in the urban areas are significantly less likely to be employed, after controlling for other covariates. In the case of provincial variables (with Eastern Cape being the reference category), the results were somewhat mixed. For instance, those from Western Cape are significantly more likely to be employed in 1995 and 2005, but the opposite take place in 2015. Those staying in Free State are more likely to be employed in 1995, but the reverse finding is observed in the other two years. The LF from KwaZulu-Natal, North West and Limpopo are more likely to find employment in all three surveys, but the results are not statistically significant in all surveys.
Regarding the education splines, the post-Matric certificate/diploma and degree splines both show statistically significant and positive marginal effects in all three surveys; those having a bachelor degree are 8 to 10% more likely to find employment in 2005 and 2015, compared with those with only post-Matric certificate/diploma. This finding suggests that the demand for more highly educated workers with degrees or above has been stronger in the last decade.
To conclude, the presented results suggest that there has clearly been a structural change in the South African labour market, as indicated by the more rapid increase of employment in tertiary-sector industries such as finance and transport, for those with post-Matric qualifications.
3.4. Unemployment
shows that the number of unemployed increased from 2.0 to 5.4 million between 1995 and 2015. Africans not only accounted for the highest share of unemployed in all three surveys (around 85%), but also the unemployed (nearly 90% between 1995 and 2015). The number of male unemployed was lower than the number of female unemployed in 1995 and 2005, but this no longer occurred in 2015. At the provincial level, Gauteng accounted for the highest share of unemployment (37.2% in 2015). In conjunction, the share of unemployment in urban areas increased to 74.5% in 2015.
Table 5. Unemployment under the narrow definition.
Individuals with incomplete secondary schooling have consistently recorded the highest share of unemployment levels (averaging 50%) in each of the periods in question. By contrast, the share of unemployed individuals with little or no primary schooling decreased from 25.4% in 1995 to 7.4% in 2015. The benefits that education affords are evident in the lower share of 7.5% that the unemployed with post-Matric qualifications hold in 2015, despite nearly doubling from the 3.1% recorded in 1995.
Approximately 2.1 million unemployed individuals were aged between 25 and 34 years in 2015, accounting for the largest share of growth over the two decades (39.4%). For individuals aged 15 to 24 years, the share of unemployed initially increased then decreased from 33.4% (in 2005) to 25.4% (in 2015), coinciding with delayed entry into the labour market due to further studies. The combined share of those aged between 45 and 65 years account for just above 14% of unemployment growth between 1995 and 2015. The severity of youth unemployment among 18 to 29 year olds is evidenced by its share of total unemployed in excess of 47% in all surveys. These findings once again justify the introduction of the ETIB. In summary, the unemployed were more likely to be African males aged below 30 years, residing in urban areas in Gauteng, with incomplete secondary schooling.
also presents the unemployment rates. The national unemployment rate increased by 8.9 percentage points between 1995 and 2005, before declining slightly to 25.4% in 2015. These trends are repeated when considering the racial profiles of Africans and Indians, while the unemployment rates for coloureds and whites increased continuously across the surveys. Nonetheless, the unemployment rate remained the lowest for whites in all surveys. Females recorded higher unemployment rates in all three surveys, but the gap between the female and male rates narrowed from 9.1 to 4.4 percentage points. Unemployment rates declined across older age cohorts in all surveys. Focusing on the 18 to 29 year olds, the unemployment rate increased from 29.1% in 1995 to 41.2% in 2015.
The highest unemployment rates were recorded in three different provinces in each survey (Eastern Cape, KwaZulu-Natal and Northern Cape in 1995, 2005 and 2015 respectively). The Western Cape is consistently cited among the lowest recorded rates of unemployment, reflecting levels ranging from approximately 14% to 21% between 1995 and 2015. Limpopo (one of the poorest provinces) experienced the lowest unemployment rate of 18.7% in 2015, declining from 30.1% in 2005. However, this result is not that surprising when referring to , which shows that Limpopo had the highest EAR between 1995 and 2015.
In 2015, individuals with incomplete secondary schooling and Matric experienced the highest recorded unemployment rates at levels ranging between 27 and 32%, despite declining over the last decade. In conjunction with the declined unemployment levels, those having no and incomplete primary schooling each account for unemployment rates of about 18% in 2015, while individuals with post-Matric qualifications recorded the lowest levels of 6.6% (degree holders) and 15.8% (post-Matric certificate/diploma). Nonetheless, the latter two rates increased continuously over the years, despite an increase of employment during the same period (see ). This anomaly (graduate unemployment) can be explained by, firstly, the ‘skills mismatch’ issue briefly mentioned in Section 1. To this end, Oosthuizen & Van Der Westhuizen (Citation2008:56) poignantly state that ‘graduates either do not possess the right qualifications or their qualifications are not of a standard that is required by employers’. Thus, while the demand for employees with post-Matric qualifications has increased from 2005 to 2015, the qualifications themselves (for some graduates) may not be suitable for what the labour market requires.
3.5. Other findings
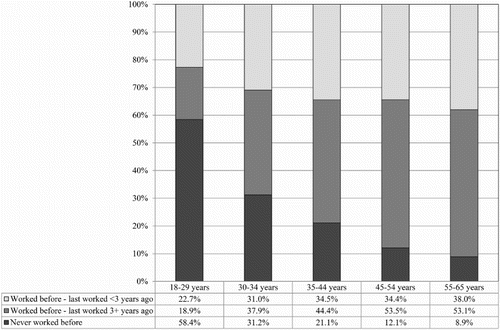
Over the years, 35 to 40% of the unemployed claimed that they never worked before. shows that this proportion declined across the older age cohorts in 2015. In contrast, the share of unemployed with previous work experience but who last worked more than three years ago increased from 18.9% in the 18 to 29 years cohort to just above 53% in the 45 to 54 years and 55 to 65 years cohorts. Hence, there is a need for government support in terms of various active labour market policies to assist each group (e.g. ETIB for the youth to find their first job; Expanded Public Works Program to improve the skills and employment likelihood of the middle-aged, long-term unemployed with some past work experience).
Figure 4. Previous work experience of the unemployed, QLFS 2015Q3. Note: OHS = October Household Survey; LFS = Labour Force Survey; QLFS = Quarterly Labour Force Survey.Source: Authors’ own calculations using QLFS 2015Q3 data.
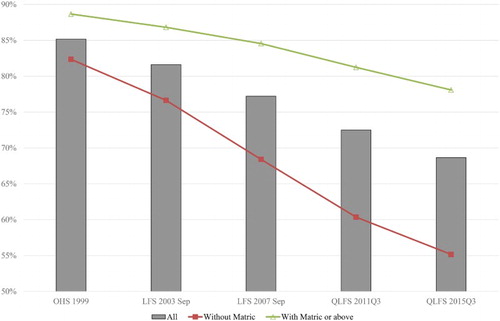
Two alarming findings could be observed from and . First, the number of employees working for enterprises with fewer than 10 workers has been hovering around the 3.0 to 3.5 million ranges, despite the government’s continuous efforts to improve the development and growth of the small, medium and micro enterprises over the years (South African Government, Citation2006; McMillan et al., Citation2013). Secondly, the proportion of formal-sector employees employed permanently has been declining continuously over the years. These two findings may be mainly attributed to the serious wage and employment rigidities in the labour market.
Figure 5. Total number of workers at the firms where the employees worked, selected surveys. Note: The question on firm size has only been asked since LFS 2000 September. OHS = October Household Survey; LFS = Labour Force Survey; QLFS = Quarterly Labour Force Survey.Source: Authors’ own calculations using LFS 2000, 2003 and 2006 September as well as QLFS 2009, 2012 and 2015 Q3 data.
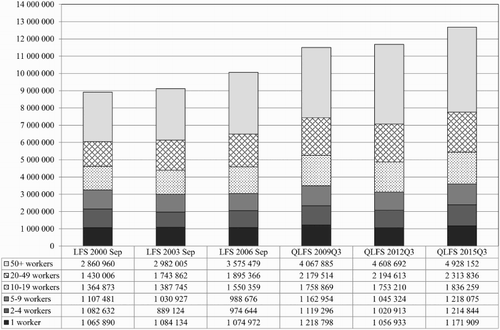
Figure 6. Proportion of formal-sector employees employed permanently, selected surveys. Note: The question on type of employment contract has only been asked since OHS 1999. OHS = October Household Survey; LFS = Labour Force Survey; QLFS = Quarterly Labour Force Survey.Source: Authors’ own calculations using OHS 1999, LFS 2003 and 2007 September, and QLFS 2011 and 2015 Q3 data.
Finally, shows that the commonly adopted method of the unemployed to seek work in 2015 was enquiring at workplaces, followed by seeking assistance from relatives/friends. The former finding, coupled with Bhorat’s (Citation2012:8–9) finding that the poor spend a higher proportion of their income on transport, may strengthen the argument that the government could consider implementing transport subsidy. Upon looking at the results of this table more thoroughly, the proportion of unemployed placing/answering advertisement and searching through job advertisement/Internet decreased across the older age cohorts, but the opposite finding was observed when it comes to seeking assistance from relatives/friends. This suggests that the older unemployed adopt a relatively more passive approach to seek work, or some may not even be familiar with searching for work via the Internet.
Table 6. Proportion of unemployed involved in each job-seeking action by age cohort, 2015.
4. Conclusion
This study looked at the labour market trends during 1995–2015. Both the LF and the LFPR increased since the end of apartheid. Moreover, the TGR far exceeded the AGR for most demographic categories, which suggests that the extent of employment growth was not rapid enough to absorb the net entrants into the LF. This contributed at least in part to the persistent and high levels of unemployment still seen today. Other factors which may possibly have led to the levels of unemployment exhibited include the ‘skills mismatch’ problem, as the study showed that unemployment rates are higher among matriculants than those with incomplete secondary or primary education. This anomaly shows that the education and skills of those in the workforce may not aligned with the demand for labour, with reference to the education and skills required. Similarly, the increased levels of graduate unemployment in recent years again allude to the possible skills mismatch issue, because one would expect relatively more educated LF participants to have a higher likelihood of being employed. Furthermore, labour market rigidity may have contributed to the persistently high unemployment levels, as the presence of labour brokers and the high levels of unionisation in some sectors could significantly influence the efficiency and equilibrium within the labour market by hindering the ‘market mechanisms’ from adjusting freely. It should be noted that the skills mismatch and employment rigidity issues mentioned are not clearly illustrated in the trends this study found. These factors are instead used as possible explanations for the high levels of unemployment shown in the results of the study.
In terms of the significance of the factors contributing to unemployment, race, age and the province in which LF participants reside are the most significant factors in determining the likelihood of being unemployed. However, the level of educational attainment also plays a role. The results of this multivariate analysis allow us to draw both positive and negative conclusions. In terms of the latter, race still plays a significant role in employment likelihood. Urban areas are increasingly not able to provide sufficient employment opportunities to their inhabitants. On this point, provincial data confirm that employment creation is a significant problem even in the more developed provinces. Experienced older work-seekers are still more likely to be employed. This has a two-fold implication for South Africa: in the short term, younger generations will have to deal with poverty; while in the long term, problems surrounding generating economic growth may cause widespread social unrest.
In terms of the positive trends found, the LF has over time become more educated on the back of employment for secondary and tertiary-educated LF participants growing significantly. Given that studies have shown an inverse correlation between the level of education and social issues within a country, an increasing demand for relatively more educated labour market participants may prove beneficial in the long term. Moreover, gender equality legislation in the workplace seems to have had an impact on the likelihood of the female LF being employed. Since developmental economic theory advocates that women are vital to improving the general standard of living in society, this trend should be fostered.
In conclusion, with regard to current South African economic policy, the labour market issues highlighted mean that both the New Growth Path goal of reducing unemployment to 15% by the year 2020 and the National Development Plan goal of reducing unemployment to 6% by the year 2030 are in jeopardy of not being achieved. The ETIB and other policies aimed at addressing both the quality and cost of education in South Africa must become the focal point for any strategy aimed at alleviating the persistent unemployment problem. The need for these educational reforms can be shown empirically as recent global studies have shown South African students to be of relatively poor quality in relation to their peers. Furthermore, reform in South Africa’s education system may provide the only long-term sustainable solution to the labour market problems seen in South Africa. Furthermore, new policies such as subsidies for the poor who are unemployed relating to job search and transport need to receive serious consideration from the government as possible complementary short-term to medium-term solutions to address labour market issues holistically and effectively.
Further to the necessary policy changes mentioned, policies such as Affirmative Action, Black Economic Empowerment and Broad Based Black Economic Empowerment need to be revisited, since, as the data show, Africans are still least likely to participate in the LF. However, given South Africa’s history and the need for reparations, this outcome is unlikely. In addition, Bhorat (Citation2012) associates highly regulated labour markets with relatively low-income countries. Similarly, Yu (Citation2013) points to collective bargaining as exacerbating rather than alleviating the unemployment problem in South Africa. Thus, a shift toward a less regulated labour market environment may bring long-term employment benefits at the cost of short-term earnings. However, given the relative power of unions and labour market entities in South Africa, this outcome may be less than likely. Thus, when revising the economic policies at hand, it is necessary to consider many factors, not just economic ones, and such a discussion would be beyond the scope of this article. What we can infer from the data, however, is that a comprehensive approach is required to solve South Africa’s labour market problems, because these problems stem from various factors.
Disclosure statement
No potential conflict of interest was reported by the authors.
Notes
1 OHS 1995 to QLFS 2013 third-quarter data were initially weighted with Census 2001 weights, while Census 2011 weights were adopted to weigh the QLFS data from the fourth quarter of 2013. However, when the latter data were released by Stats SA, the QLFS data from 2008 first quarter to 2013 third quarter were also re-weighted with Census 2011 weights. Hence, this would lead to abrupt changes in labour market aggregates during the changeover from LFS to QLFS between 2007 and 2008, to be discussed later.
2 Yu (Citation2013) attempted to apply a consistent QLFS labour market status derivation methodology to derive the discouraged workseekers and broadly defined unemployed in the LFSs, and finds that the labour market aggregates remain incomparable between LFSs and QLFSs.
3 Ranchhod & Finn (Citation2014, Citation2015) do not find a significantly positive impact on youth employment in 2014, after the implementation of the ETIB. Nonetheless, they argue it may be too soon to estimate its impact.
4 For detailed explanation on the three variables, refer to Oosthuizen (Citation2006:17–8).
5 Formal modelling is needed to control for different variables that could impact on the relationship between output and employment (Oosthuizen, Citation2006:8). Hence, the data presented in are, strictly speaking, not output–employment elasticities.
References
- Banerjee, A, Galiani, S, Levinsohn, J, McLaren, Z & Woolard, I, 2008. Why has unemployment risen in the new South Africa? Economics of Transition 16(4), 715–40. doi: 10.1111/j.1468-0351.2008.00340.x
- Bhorat, H, 2004. Labour market challenges in the post-apartheid South Africa. South African Journal of Economics 72(5), 940–77. doi: 10.1111/j.1813-6982.2004.tb00140.x
- Bhorat, H, 2009. Unemployment in South Africa: Descriptors and determinants. Proceedings of the IZA (Institute for the Study of Labor)/World Bank Conference on Employment and Development, 4-5 May, Bonn.
- Bhorat, H, 2012. A nation in search of jobs: Six possible policy suggestions for employment creation in South Africa. DPRU Working Paper 12/150. Development Policy Research Unit, Cape Town.
- Bhorat, H, Kanbur, R & Mayet, N, 2012. The impact of sectoral minimum wage laws on employment, wages and hours of work in South Africa. DPRU Working Paper 12/155. Development Policy Research Unit, Cape Town.
- Branson, N, 2009. Re-weighting the OHS and LFS national household survey data to create a consistent series over time: a cross entropy estimation approach. SALDRU Working Paper Number 38. Southern Africa Labour and Development Research Unit, Cape Town.
- Burger, R & Jafta, R, 2006. Returns to race: Labour market discrimination in post-apartheid South Africa. Stellenbosch University Working Paper 4/2006. Stellenbosch University, Stellenbosch.
- Burger, R & Jafta, R, 2010. Affirmative action in South Africa: an empirical assessment of the impact on labour market outcomes. CRISE Working Paper No 76. Centre for Research on Inequality, Human Security and Ethnicity, Oxford.
- Burger, R & Woolard, I, 2005. The state of the labour market in South Africa after the first decade of democracy. Journal of Vocational Education and Training 57(4), 453–76. doi: 10.1080/13636820500200297
- Heintz, J & Posel, D, 2008. Revisiting informal employment and segmentation in the South African labour market. The South African Journal of Economics 76(1), 26–44. doi: 10.1111/j.1813-6982.2008.00153.x
- Hodge, D, 2009. Growth, employment and unemployment in South Africa. South African Journal of Economics 77(4), 488–504. doi: 10.1111/j.1813-6982.2009.01226.x
- HSRC (Human Sciences Research Council), 2012. Highlights from TIMSS 2011: The South African perspective. Human Sciences Research Council, Pretoria.
- Kingdon, GG & Knight, J, 1999. Unemployment and wages in South Africa: A spatial approach. Centre for the Study of African Economies. Institute of Economics and Statistics, Oxford.
- Kingdon, GG & Knight, J, 2004. Unemployment in South Africa: The nature of the beast. World Development 32(3), 391–408. doi: 10.1016/j.worlddev.2003.10.005
- Kingdon, GG & Knight, J, 2007. Unemployment in South Africa, 1995–2003: Causes, problems and policies. Journal of African Economies 16(5), 813–48. doi: 10.1093/jae/ejm016
- Martin, MO, Mullis, IVS, Foy, P & Stanco, GM, 2012. TIMSS 2011 international results in science. TIMSS & PIRLS International Study Center, Chestnut Hill.
- McMillan, L, Hlatshwayo, A & Amra, R, 2013. SMME employment in South Africa. Proceedings of the Economic Society of South Africa Conference, 25-27 September, Bloemfontein.
- Mohr, P, 2011. Economic indicators. 4th edn. UNISA Press, Pretoria.
- Mullis, IVS, Martin, MO, Foy, P & Aror, A, 2012. TIMSS 2011 international results in mathematics. TIMSS & PIRLS International Study Center, Chestnut Hill.
- Oosthuizen, M, 2006. The post-apartheid labour market: 1995–2004. DPRU Working Paper 06/103. Development Policy Research Unit, Cape Town.
- Oosthuizen, M & Van der Westhuizen, C, 2008. Graduate unemployment in the face of skills shortages: A labour market paradox. The South African Journal of Economics 76(1), 45–57. doi: 10.1111/j.1813-6982.2008.00152.x
- Pauw, K, Bhorat, H, Goga, S, Ncube, L & Van der Westhuizen, C, 2006. Graduate unemployment in the context of skills shortages, education and training: Findings from a firm survey. DPRU Working Paper 06/115. Development Policy Research Unit, Cape Town.
- Ranchhod, V & Finn, A, 2014. Estimating the short run effects of South Africa’s employment tax incentive on youth employment probabilities using a difference-in-differences approach. SALDRU Working Paper No. 134. Southern Africa Labour and Development Research Unit, Cape Town.
- Ranchhod, V & Finn, A, 2015. Estimating the effects of South Africa’s employment tax incentive: An update. SALDRU Working Paper No. 152. Southern Africa Labour and Development Research Unit, Cape Town.
- Rankin, NA & Roberts, G, 2011. Youth unemployment, firm size and reservation wages in South Africa. South African Journal of Economics 79(2), 128–45. doi: 10.1111/j.1813-6982.2011.01272.x
- South African Government, 2006. Accelerated and shared growth initiative-South Africa: A summary. [Online]. www.info.gov.za/asgisa Accessed 11 January 2016.
- Stats SA (Statistics South Africa), 2004. Labour force survey 2004 March: Metadata. Statistics South Africa, Pretoria.
- Van der Berg, S & Van Broekhuizen, H, 2012. Graduate unemployment in South Africa: A much exaggerated problem. Stellenbosch Economic Working Papers: 22/12. Stellenbosch University, Stellenbosch.
- Verick, S, 2012. Giving up job search during a recession: The impact of the global financial crisis on the South African labour market. Journal of African Economies 21(3), 373–408. doi: 10.1093/jae/ejr047
- Wittenberg, M, 2014. Analysis of employment, real wage, and productivity trends in South Africa since 1994. Conditions of Work and Employment Series No 45. International Labour Office, Geneva.
- Yu, D, 2007. The comparability of the Statistics South Africa October Household Surveys and Labour Force Surveys. Stellenbosch Economic Working Papers 17/07. Stellenbosch University, Stellenbosch.
- Yu, D, 2008. The South African labour market 1995–2006. Stellenbosch Economic Working Paper 05/2008. Stellenbosch University, Stellenbosch.
- Yu, D, 2009. The comparability of Labour Force Survey (LFS) and Quarterly Labour Force Survey (QLFS). Stellenbosch Economic Working Paper 08/2009. Stellenbosch University, Stellenbosch.
- Yu, D, 2013. Revisiting unemployment levels and trends in South Africa since the transition. Development Southern Africa 30(6), 701–23. doi: 10.1080/0376835X.2013.830242
- Zoch, A, 2013. Understanding the underlying dynamics of the reservation wage for South African youth. Proceedings of the ESSA (Economic Society of South Africa) Conference, 25-27 September, Bloemfontein.