
ABSTRACT
This article examines the structural transformation trajectory in Zambia since independence. Drawing from sectoral analysis of the structure of output and the composition of labour over the last five decades, the article illustrates that although there have been shifts in the composition of output and labour in the economy, especially since 2000, these shifts have not contributed to positive structural transformation. Instead the economy has been experiencing widening productivity gaps between sectors, signalling perverse economic structural transformation. Although there have been some slight improvements in the overall productivity since 2000, productivity in the agriculture and informal sectors, where almost 85% of the labour works, has remained stagnantly low. This is compounded by the economy experiencing a net movement of labour from high to low-productivity employment, mainly the informal urban sector.
1. Introduction
Zambia became independent from British colonial rule on 24 October 1964, ending a 40-year period of formal colonial rule.Footnote1 While colonial rule ended five decades ago, its legacy, particularly the enclave feature of the economy, is still conspicuous. Since the establishment of colonial rule, the Zambian economy has largely centred on the extraction of minerals, particularly copper, cobalt and related by-products. At the time of independence in 1964, the mining sector accounted for over 90% of export revenue, over 95% of export by volume, 65% of public revenue, 48% of gross domestic product (GDP) and over half of formal wage employment (see Faber & Potter, Citation1971). Agriculture constituted just 11.5%, manufacturing 6%, construction 4.3%, water and electricity 1.1% and services about 29% of GDP (Faber & Potter, Citation1971: 9). This reflects an absolute dominance of mining (particularly the copper–cobalt segment) sector (Bhagavan, Citation1978).
This article examines structural transformation trajectories in Zambia over the past five decades. Data presented in the article suggest that although the economic structure has undergone some structural shifts in the composition of output and labour over the years, the economy still displays features of dualism and lack of positive economic structural transformation. The overall result of this economic structure has been increasing poverty and inequality even during a time when the economy has recorded decent growth (Resnick & Thurlow, Citation2014; Chitonge, Citation2015).
2. An overview of Zambia’s economic structure at 50
Analysis of the structure of the Zambian economy over the last five decades suggests that some noticeable structural shifts in the economy have occurred. One of the most obvious shifts is the declining share of the mining sector in GDP and formal employment, especially between 1990 to about 2005, after which the mining share in GDP started to rise again. For instance, while the mining and quarrying sub-sector accounted for about half of total output in 1965, its share in total output was reported at 7.1% in 2002 before increasing to 9.2% in 2010 (Dihn, Citation2014:18) and 14% in 2012 (ICMM, Citation2014).Footnote2 Similarly, the formal employment share of the mining and quarrying sector declined from about 20% in 1964 to just 1.3% in 2010. Further, the share of the industrial sector in total employment fell from about 26% in 1975 to 9% in 2012, while the share of the services sector increased from 15% to about 27% over the same period (see later). However, these shifts have not resulted in a positively transformed economic structure marked by a narrowing of productivity gaps between sectors. Copper remains Zambia’s major export and source of foreign currency, accounting for over 84% of the country’s total export volume and over 76% of export earnings in 2012 (World Bank, Citation2013). Although there has been noticeable growth in the export of non-traditional export goodsFootnote3 (see Republic of Zambia, Citation2012; Dihn, Citation2014), copper export still remains overwhelmingly dominant, reflecting not just the enduring legacies of the colonial economy but also the vulnerability to commodity price shocks, as the current situation in the country highlights (York, Citation2015).
3. What is structural transformation?
If understood as the shift in the composition of labour force and output in an economy over time, structural transformation is an ongoing process, because of the mere fact that these aspects of the economy are constantly changing. Structural transformation in the literature is often equated to the ‘movement of labour out of less productive semi-subsistence agriculture … into the more productive sectors of manufacturing or services’ (AfDB (African Development Bank)/ OECD (Organisation for Economic Cooperation and Development)/ UNDP (United Nationa Development Programm)/ ECA (Economic Commission for Africa), Citation2013:14). For instance, it has been argued that the process of economic structural transformation in developed countries has been characterised by the ‘shifts of capital and labour away from the production of primary goods towards manufacturing and services’ (Timmer et al., Citation2014:2). Regrettably, this view of structural transformation, which is still influential today, has sometimes led to disastrous policy advice. For example, in a book that analyses economic growth in Africa from the 1960s to 2000s, it is argued that a ‘contraction of agriculture share of the labour force is one of the most durable features of the structural transformation that takes place in the course of development’ (Ndulu & O’Connell, Citation2008:23). Similarly, a recent report by the World Bank has defined structural transformation as ‘a reallocation of resources from low productivity activities such as agriculture into the modern, high productivity sector’ (World Bank, Citation2014:32).
Drawing from these views, it has been suggested, for instance, that high-income countries in Africa should target to reduce agriculture share in total output to 3.3%, and for lower-middle and low-income countries the aim should be to reduce the agriculture-to-GDP ratio to 15.5%. On the other hand, African countries should target increasing the manufacturing share in GDP to a minimum of 28% for high and middle-income countries, and 24% for low-income countries (ECA, Citation2012:72).
This conception of structural transformation, however, ignores the inherently broader dimensions of genuine structural transformation, and a whole range of social and institutional change which accompanies it. Thus, economic structural transformation should not be conceptualised and measured in a very restricted sense, such as looking at agriculture’s share in GDP. Conceived broadly, structural transformation can be seen as a process of ‘spreading economic opportunities in a balanced way across all segments of the population and regions of the country … ’ (Dihn, Citation2014:19). This understanding of structural transformation highlights three fundamental features: (a) the process has to be broad based; (b) the geographical spread of economic activities (spatial de-concentration of economic activities; and (c) the creation of economic opportunities. As shown in this article, labour can move out of subsistence agriculture without producing any positive effects of structural transformation. Available evidence on structural transformation suggests that productivity growth in the agricultural sector has been the foundation of structural transformation (see Lewis, Citation1954; Pingali, Citation1997; ACET, Citation2014).
4. Models of structural transformation
Several models of structural transformation have been proposed in the literature on economic development. In the following, two of the models relevant to this discussion are briefly outlined.
4.1. The two-sector model
One of the most popular models of structural transformation, proposed by Arthur Lewis during the 1950s, is the two-sector or dual economy model.Footnote4 In this model, structural change (which is used synonymous with economic development) is formulated in terms of the sectoral dynamics between the capitalist (modern/urban) and subsistence or traditional sector. Lewis’ (Citation1954) focus in formulating this model, was on the long-term relationship between what he referred to as the ‘capitalist sector’ and the ‘non-capitalist’ sector. The key to understanding the model is the distinction made between the two sectors, which is that the former uses ‘reproducible capital’ while the latter does not. In other words, the capitalist sector is characterised by continuous capital accumulation while the subsistence sector is not.
According to this model, the resultant capital endowment differential between the two sectors inevitably leads to differences in factor proportions (capital–labour ratio) and, subsequently, productivity between the two sectors. It is important to note that in this model, capital is the key determinant of productivity; technology and skills are considered exogenous to the model. According to Lewis (Citation1954), because the subsistence sector is characterised by low productivity, with a marginal productivity of labour assumed to be zero or near zero, labour can be transferred from the subsistence sector to the capitalist sector without affecting production levels in the former. In fact, structural transformation, in this model, is understood to be initiated by the process of relocating surplus labour from the subsistence to the capitalist sector. In other words, the existence of a subsistence sector is a manifestation of the factor misallocation and inefficiency in the economy, which should be resolved if economic progress is to be sustained. According to Lewis, as ‘capital becomes available more workers can be drawn into the capitalist from the subsistence sector, and their output per head rises as they move from one sector to the other’ (Citation1954:408).
The force that initiates and sustains the pull of labour from the subsistence sector to the modern capitalist sector is the wage difference between the two sectors: ‘Earnings in the subsistence sector set a floor to wages in the capitalist sector, and there is usually a gap of 30 percent or more between capitalist wages and subsistence earnings’ (Lewis, Citation1954:410). So long as wages in the subsistence sector are lower than those in the capitalist sector, labour from the subsistence sector will be attracted to move to the capitalist sector until there is an equalisation in the wages between the two sectors (the turning point), at which point the two sectors merge into one, and surplus labour is eliminated. Of fundamental importance to the model is the idea that the rate of capital accumulation determines the rate of transfer of labour from subsistence to the capitalist sector.
Although the two-sector model is sometimes used to justify policies which have led to the neglect of the agriculture sector, the model itself recognises a central role for agriculture, especially in the initial stages of economic transformation. This is evident in the statement that ‘industrial and agrarian revolution always go together’ and that ‘economies in which agriculture is stagnant do not show industrial development’ (Lewis, Citation1954:433).Footnote5 In countries with large proportions of the labour force in agriculture (as is the case in Zambia) it is quite clear that there can be no industrialisation without significant growth of productivity in the agriculture sector (see Johnston & Mellor, Citation1961).
Historical evidence from different countries supports the view that industrialising economies in their early stages rely on an effective agrarian transformation. For instance, in East Asia, agrarian transformation formed the foundation on which industrialisation was built (Pingali, Citation1997). Rapid productivity growth in the agriculture sector led to increased income, and ‘Increased incomes for farmers created buoyant demand in rural areas for farm inputs, for processing and marketing services as well as for consumer goods and services’ (ECA, Citation2012:120). There is now wide recognition ‘that growth in the agriculture sector … has been the precondition for transforming economies that are now industrialised or undergoing industrialisation’ (NEPAD, Citation2014:15). In the African context, it has been argued that economic structural transformation has lagged behind precisely because most countries have not experienced significant productivity growth in agriculture (ECA, Citation2012; NEPAD, Citation2014).
4.2. The import substitution industrialisation (Prebisch–Singer) model
The other model of structural transformation which was popular among developing countries in Africa and Latin America during the 1960s is import substitution industrialisation (ISI). The ISI model, as a strategy for economic structural transformation, was popularised by Raul Prebisch and Hans Singer. The Prebisch–Singer model postulated that underdeveloped countries’ reliance on export of primary commodities and import of manufactured products from industrialised countries undermines the former’s prospect for economic growth and structural transformation, mainly because of the unfavourable terms of trade against primary commodities. Therefore, in order to lessen and eventually reverse the negative impact of this structural constraint, the model proposed establishing local manufacturing industries to produce most of the imported products locally.
The rationale behind ISI is that producing most of the imported goods locally ‘would counteract the tendency towards the deterioration of the terms of trade by avoiding the allocation of additional productive resources to primary export activities and diverting them instead to industrial production’ (Prebisch, Citation1984:179). In this model, establishing local manufacturing industries could be achieved through various strategies including targeted allocation of foreign currency for acquisition of capital goods and industrial inputs, special subsidy and the protection of infant industries (Singer, Citation1950).
4.3. Influence of the transformation models
The ISI model became an attractive model for diversifying the post-colonial economies in most newly independent African countries, including Zambia during the 1960s and 1970s. This strategy envisioned a rapid growth of industrial activities, starting with light manufacturing such as processing of agriculture products including textiles, rubber, sisal, tobacco and cocoa, and subsequently moving into intermediate and finally heavy-duty manufacturing (see Bates, Citation1981). Some analysts have argued that in most African countries ‘import-substitution industrialisation was the only possible strategy, because initially the domestic market was the only market which could be secured, by state intervention for industrialisation to occur’ (Sender & Smith, Citation1986:72).
These two models of structural transformation have influenced the debates and policy of structural transformation in Zambia, and Africa broadly. The ISI model emphasised the idea that the process of structural transformation is not a ‘natural’ one; it is an outcome of a deliberate, well-planned and executed strategy, with very clear goals outlined from the beginning. Thus, the ISI strategy envisions an effective state as a vital component of economic structural transformation. The two-sector model, which has been revived in current debates on structural transformation, emphasises an endogenous process of relocating labour primarily from the lower to the higher productive sectors, with the share of agriculture in total employment and output seen as a sole indicator of a country’s transformation performance.
5. Structural transformation in Zambia
Since independence, the successive Zambian governments have identified diversification of the economy as one of the strategic policy priorities in the country. From the Transitional Development Plan, which was formulated in 1965, to the current Sixth National Development Plan (Republic of Zambia, Citation2011), economic diversification has consistently featured as one of the key objectives of the country’s development plan. While there is ample evidence of a strong awareness of the need to diversify the economy, there has been little to show that these strategies have been successfully implemented to bring about positive transformation of the economic structure.
This disjuncture between policy statements and actions on the ground has been noted by some scholars from the early days of independence. During the 1960s and 1970s, analysts noted the discrepancy between the political utterances such as ‘the future of the economy is on the land’ (Kaunda, Citation1969) and the actual resources allocated to the agriculture sector. The ILO report, for example, observed during the 1970s that despite the numerous declarations by the government about the importance of agriculture in the economy, ‘one is struck by the neglect of agriculture, by the low priority given in the allocation of economic resources and skilled manpower’ (cited in Woldring, Citation1984:99). The neglect of the agriculture sector is also evident in the fact that by ‘1975 Zambia had to import 99 percent of wheat, 95 percent of rice, over 80 percent of its dairy products and vegetable oils, two-thirds of its cotton and around half of its potato and beef requirements’ (cited in Woldring, Citation1984:99). Agricultural imports of this magnitude in a country that is richly endowed with plenty of arable land, water resources, labour, and rich and diverse agro-ecological conditions suitable for producing a wide variety of crops raises doubts about the commitment to the sector, and broadly to diversification and economic structural transformation.
Overall, Zambia has made little progress in broadening the production and export base in the economy despite the repeated call for economic diversification. During the 1960s and 1970s, the strategy to diversify the economy was informed by the ISI model, built around strong state involvement through the creation of parastatal entities in all sectors of the economy. By the 1980s Zambia had established a relatively diversified production base with a wide range of light industries such as manufacturing of bicycles, batteries, textiles and clothing, metal products, a wide range of food products, copper and leather products including shoes, wood and related goods, and the assembling of tractors and light vehicles (Bates, Citation1981). This diversification strategy was carried out by establishing holding companies in strategic subsectors of the economy such as mining, manufacturing, finance, air, road and rail transport, and food processing and marketing. Some of the holding companies created during the 1970s and 1980s include the Zambia Industrial and Mining Corporation (ZIMCO), the Mining and Development Corporation (MINDECO), the National Milling Corporation (NAMCO), the Financial Development Corporation (FINDECO) and the National Agriculture Marketing (NAMBOARD).
However, the outcome of the diversification drive over the years has been mixed, with significant success recorded between 1960 and 1980, and slow de-industrialisation from the mid-1980s to the present. Despite the earlier successes recorded, Zambia has largely remained dependent on copper for export earnings and state revenue. There are several factors which account for this. First, these strategies were not geared towards diversifying the export base and foreign exchange revenue; the main focus was to produce consumer goods to meet the growing urban population. Thus, the
… policy of import substitution merely shifted a range of manufactured goods to Zambia from overseas while maintaining Zambian dependence on imports required for previous stages of production such as machinery and maintenance. Import substitution has particularly catered for the consumption habits of Zambian middle class … (Tangari, Citation1984:117)
The second major factor, characteristic of most ISI models, is that these industries found it difficult to break into the fiercely competitive export markets because most of the enterprises had no competitive advantage in the goods they were producing. Most of them were sustained by state subsidy and were heavily protected through the infant industry schemes (Tangari, Citation1984).
The third major factor is that because these enterprises relied on a small domestic market, their potential for growth was always limited so long as there was no growth in the other sectors such as agriculture where majority of the people worked. Because they were not competitive, they could not break into international markets. In addition to all these challenges, most of these ventures were not efficiently run; they were characterised by massive abuse of state resources (see Bates, Citation1981).
With the onset of structural adjustment programmes during the mid-1980s, these enterprises became the obvious target as the cause of poor economic performance. Although Zambia resisted the implementation of a wholesale privatisation of state-owned enterprises until after 1991, the historic privatisation carried out by the Movement for Multi-Party Democracy (MMD) which came to power in 1991 marked a turning point. The effects of privatisation are perhaps more prominently reflected in the dramatic decline of formal employment from 26% in 1980 to 12% in 1995 and eventually to 7% in 2000 (Kitenge & Kingombe, Citation2004). While formal employment has shown some degree of recovery since 2008, the levels (16% in 2012) are agonisingly low. Consequently, even if the country has experienced sustained economic growth of over 5% per annum over the last 15 years, it has been observed that
All the indicators of diversification deteriorated between 2000 and 2010. The share of manufacturing in GDP fell from 11.0% to 9.6%; the share of the top five products in merchandise exports rose from 75% to 85%, and the share of manufacturing and services in export plunged from 23% to 12%. (ACET, Citation2014:207)
6. Structural transformation profile
One of the key indicators of structural transformation in an economy is the sectoral composition of output and the productivity of labour. The presence of large productivity gaps between sectors is a manifestation of adverse structural transformation, and is ‘indicative of the allocative inefficiencies that reduce overall labour productivity’ (McMillan & Rodrik, Citation2011:1). If we look at the labour productivity in Zambia between 1975 and 2012, it has been declining in all sectors, except in manufacturing, which also experienced productivity decline between 2005 and 2012 (see ).
Table 1: Productivity per worker (in 2005 US$) 1975–2012
The agriculture sector experienced a sharp decline in productivity between 1980 and 1990, and since then productivity has stagnated. For the economy as a whole, labour productivity declined sharply between 1975 and 1995, but has been recovering slowly since the mid-1990s. However, current economy-wide productivity is only two-thirds of the level reported in 1975. The main explanation for this is that an increasingly higher proportion of workers in Zambia have been engaging in low-productivity activities, mainly in the informal, non-wage agriculture and self-employed urban ventures, such as street vending (Resnick & Thurlow, Citation2014). This is evident in the second part of where an average worker in the agriculture sector, which has consistently been the largest employer since independence, produces only one-tenth of what an average worker in the other sectors produces, and this gap has significantly grown since 2000.
In terms of structural transformation, the challenge becomes evident from the fact that the sectors with highest average productivity per worker – which are mining (US$24 155), followed by utilities and construction (just over US$20 000) and Finance and business services (US$15 559) – account for less than 2% of the labour force: mining with 1.1%, utilities and financial and business services both at 0.2% (CSO, Citation2014b). Sectors with the largest share of the labour force (agriculture at US$468 per worker), trade, wholesale and retail services (US$780) and transport (US$3 500) have the lowest productivity. Such large ‘inter-sectoral productivity gaps are clearly a feature of underdevelopment’ (McMillan & Rodrik, Citation2011).
While some people involved in subsistence agriculture would be happy and willing to move to capitalist sectors (as is evident from the people migrating to urban areas, mainly Lusaka, in search of jobs), the challenge is that the capitalist sectors are not creating enough jobs to absorb those who are looking for employment (World Bank, Citation2013). The problem is therefore not that people engaged in subsistence agriculture are held back by cultural or other factors as Collier (Citation2008) suggests; the challenge is that the modern sectors are not restructuring well enough to generate sufficient jobs.
In terms of output structure, it is important to note that since the 1960s sectoral output composition has been shifting in different directions, with the share of industry declining between 1990 and 2000, but remaining stagnated for the later part of the 2000s. On the contrary, the share of agriculture in total output increased from the 1990s up to 2000, but declined sharply thereafter (). Thus there seem to be two turning points in the output composition story: from 1965 to about 1985, there is little change; while significant changes in output composition appear in the 1990s (decline of industrial and services share, rise of agriculture share) and the 2000s (recovery of industrial and services share, decline of agriculture share).
Table 2: Sectoral composition of GDP in Zambia (%), 1965–2013
In terms of sectoral output dynamics, the manufacturing sector seems to have grown steadily from 1965 until recently, when it declined (). However, although the share of the manufacturing sector has grown steadily from just 4% in 1965 to more than 10% by 1990, this share has been low compared with countries where positive structural transformation has occurred. Countries which have seen sustained economic transformation have reported much higher share of manufacturing in total output (Dihn, Citation2014:4), of above 30% of GDP (ACET, Citation2014). This is three times higher than the highest reported manufacturing-to-GDP ratio in Zambia over the past 50 years.
The slow growth of the manufacturing sector and the stagnation of the industrial sector have been identified in the Republic of Zambia (Citation2012) Strategic Paper on Industrialisation and Job Creation as a major challenge for the economy, and has affected the diversification, employment creation and poverty reduction performance. What is worrying is that the share of manufacturing in total output has been declining since 2009 (ACET, Citation2014).
If we look at the average decadal value-added trends by sector, the manufacturing sector has experienced steady decline since the 1980s (see ).
Table 3: Average value-added composition by sector (%), 1965–2013.
The industrial and services sectors reported the largest growth in value added in the 2000–09 period, boosted by the robust growth in the mining sub-sector on the back of high commodity prices and the growth of financial and business, and mobile communication services. The agriculture sector has had the lowest growth in value added since 2000. A positively transforming economy should be characterised by a sustained growth in value added across the economy, but particularly in manufacturing. Although there are indications that value-added trends are recovering from the slump in the 1990s, manufacturing growth rates are still low to induce positive structural transformation.
If we look at the long-term trends of the sectoral composition of the labour force in Zambia, it is evident that there is a marked decline in formal employment from 1970 to about 2000 and a steady recovery since 2000 (see ). Just like productivity and output trends, the 1990s was a period when all aspects of structural transformation deteriorated (see ).
Table 4: Employment trends by type, 1970–2012
Although there has been an upward trend in terms of formal employment since 2000, the levels of formal employment have remained extremely low, as already noted. The Zambian government has acknowledged this as a challenge: ‘A major area of concern is that formal sector employment levels have remained almost stagnant since 1998, and that most employment growth has been recorded in the informal sector of the economy’ (Republic of Zambia, Citation2012:2). This dualistic nature of the labour force is another indication of the lack of positive structural transformation (McMillan & Rodrik, Citation2011).
Existing data show that for the agriculture, industry and services sectors, the majority of workers are in informal employment (see ).Footnote6 While some of the changes between 2005 and 2012 seem too large to be true, what seems evident is the sharp growth of informal-sector employment vis-à-vis the formal sector since the 1970s. The huge increase in formal employment reported between 2005 and 2012 in the agriculture and services sectors could be a result of underestimating formal employment in the 2005 survey, because there has been no logical justification for such sharp increases.
Table 5: Employment composition by sector (%), 1975–2012
If the figures from the Labour Force Survey are correct, it is apparent that the agriculture sector has had the largest share of the labour force since the 1970s, although this has been declining since 2005 (see ). Formal employment in agriculture and manufacturing sectors has constituted a small share for the last 40 years, remaining consistently below 5%. The sectoral share of formal employment in total employment has been small across sectors, although there are signs of improvement in the last decade.
Table 6: Poverty headcount dynamics using different poverty lines (%), 2006 and 2010
Low levels of formal employment are confirmed by data on vulnerable employment, which has remained consistently high since the 1980s (see ). Vulnerability of employment is a feature strongly associated with the informal sector (ILO, Citation2012).
Figure 1: Share of vulnerable employment in total employment in Zambia, 1980–2012 (%). .
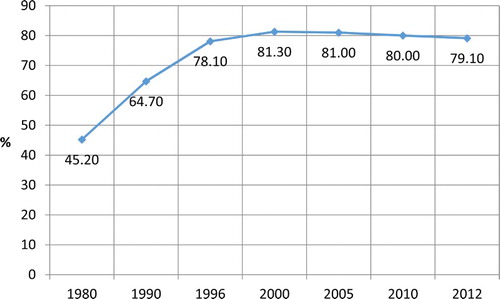
With a large proportion of the labour force concentrated in agriculture and the informal urban sector, it is not surprising that levels of vulnerable employment have remained consistently high even during the time when the economy has recorded robust growth. This is partly the reason why poverty has been rising during the time of a sustained growth episode (see ). Similarly, inequality levels have increased between 2006 and 2010 (World Bank, Citation2012; Chitonge, Citation2015).
The negative aspect of the current economic structure is evident in the fact that high-productivity sectors such as mining and industries have actually been shedding jobs, and most of the retrenched workers end up in the urban informal sectors. For instance, according to data from the 2005 and 2012 Labour Force Surveys, formal jobs in the mining sector dropped from 154 515 in 2005 to less than half (74 542) in 2012. Similarly, in the transport and storage subsector, formal employment dropped from 158 422 in 2005 to less than half (just over 70 000) in 2012 (CSO, Citation2005, Citation2014b). On the other hand, we see a massive increase in informal-sector employment between 2005 and 2012, especially in the trade, wholesale and retail subsectors. As a result of these shifts,
economic growth has not translated into significant reduction in poverty and improved general living conditions for the majority of the Zambian people. The failure for the strong macroeconomic position to translate into reduction in poverty and inequality reflects important macroeconomic and policy constraints. (Republic of Zambia, Citation2012:2)
7. Persisting challenges of structural transformation in Zambia
One of the major challenges of economic development in Zambia which has persisted since independence has been economic diversification. The agriculture and agro-processing sectors, where export commodities such as sugar, cut flowers, vegetables, cotton and other goods have grown quite significantly and shown greater potential in recent years, have always received ephemeral attention. Public policy attention to the agricultural and agro-processing sectors came under the spotlight only in the ‘face of a rapidly declining mining sector and the heavy sustained loss of jobs in manufacturing’ (World Bank, Citation2003:63). The two-sector model's view that agriculture is a declining sector in a transforming economy has probably had more influence than is often imagined.
The other major challenge in Zambia’s structural transformation story is the lack of coordination. For example, until 2009 it was reported that the country had no industrial policy and strategy to provide guidance and coordination of the various industrial activities by the state and the private sector (Dihn, Citation2014). It was only in 2012 that the government set up a committee to develop an industrialisation and job creation strategy (see Republic of Zambia, Citation2012:3). While strategies aimed at promoting diversification begun to be articulated around 2000 with the establishment of the National Economic Diversification Task Force (NEDTF), such initiatives have achieved little due to lack of implementation of the plans (Republic of Zambia, Citation2014). Similarly, the passing of the Export Processing Zone Act of 2001 and the creation of the Zambia Export Processing Zone Authority (ZEPZA) have not produced any tangible results (Dihn, Citation2014:33).
However, the creation of the Zambia Development Agency (ZDA), in 2006, has helped in promoting, coordinating and implementing the economic diversification strategy. One example of this is the ZDA strategy of advertising and marketing the potentials of various sectors in Zambia to local and foreign investors. For instance, the Agriculture, Livestock and Fisheries Sector Profile developed in Citation2011 provides information about the investment opportunities available in the country. The profile highlights the various crops and livestock products that can be produced in the country, and the large market that Zambia has access to through the Common Market for Eastern and Southern Africa (COMESA) and the Southern African Development Community (SADC) (see ZDA, Citation2011). However, there are still many challenges in the way ZDA operates, including inadequate funding.
The other structural transformation challenge often ignored in the debates is the spatial spread of economic activities. Diversification in the context of structural transformation implies geographical spread of economic activities in addition to broadening the range of activities and products in the economy. In the Zambian case, the concentration of economic activities in Lusaka and Copperbelt provinces has been recognised as one of the enduring challenges of diversification. For instance, Lusaka and Copperbelt account for over two-thirds (67%) of manufacturing establishments in the country (Republic of Zambia, Citation2007:100).
Another key challenge of structural transformation in Zambia revolves around widening of the production and export bases. The range of products in a particular industry such as manufacturing is a good measure of how diversified the sector is. The manufacturing sector has a relatively narrow range of products recommended by the International Standard of Industrial Classification as the standard for lower-middle-income countries like Zambia (Republic of Zambia, Citation2007).
It is evident from that the manufacturing industry in Zambia is characterised by low technology, with a conspicuous absence of the high-tech manufacturing such as electronics, automobile and pharmaceutical products. Manufacturing is dominated by the food and beverage subsectors (see ). The dominance of the food and beverages subsector is reflected by the fact that the sector constitutes about 70% of total manufacturing output (Resnick & Thurlow, Citation2014:9).
Table 7: Manufacturing value added and subsector growth rates, 2005–10
8. Transformation potential
The various manufacturing sub-sectors in are, by nature, labour intensive and as such have great potential to contribute immensely to the diversification of the economy if they are sufficiently supported and coordinated. With the growing domestic market for the light manufacturing products including fabricated metals and construction materials (Dihn, Citation2014), these sub-sectors have the potential to generate more jobs through linkages with other sectors and contribute to positive structural transformation. In fact, formal employment in the manufacturing sector has been growing at an average rate of about 9% per annum between 2001 and 2010 (see ).
Table 8: Manufacturing sectoral and formal employment trends, 2001–10
The potential for generating medium to high-productivity jobs in the manufacturing sector is huge, especially if proper linkages with other sectors, particularly the agriculture sector, are enhanced.
9. Conclusion
This article has examined the trajectory of structural transformation in Zambia over the last five decades. Structural transformation, understood broadly as the process of spreading economic growth dividends across different sections of society, has remained a challenge in Zambia. The general trend that emerges from the analysis presented is that the steady but slow progress in structurally transforming the economy recorded in the 1960s and 1970s was largely reversed during the 1980s and 1990s. This has been followed by slow recovery since 2000. Although there are signs of structural shifts taking place during the last 15 years, these shifts are not contributing to positive change in the structure of the economy.
The main challenge in this regard is the creation of employment opportunities in high-productivity sectors to enable the larger sections of the population to participate in, contribute to and share in the transforming economy. Unfortunately, employment trends over the years show the opposite of this, with labour moving from high to low-productivity sectors mainly in urban retail and informal trading. For instance, there has been a marked decline of the formal employment share in the mining sector from 3.3% of total employment in 1990 to just 1.3% in 2010, with the manufacturing sector employment share declining from 5.1% to 3% over the same period. The overall trend reported in the Labour Force Surveys attest to the shrinking of formal employment from 26% during the 1970s and early 1980s to just 10% in 1990 before marginally recovering to 16% in 2012.
The main challenge for the Zambian economy is thus to raise productivity in the agriculture sector as the bedrock for structural transformation. Although the successive Zambian post-colonial governments have recognised this fact, there has been little commitment to implementing and realising this vision.
Disclosure statement
No potential conflict of interest was reported by the authors.
Notes
1 Zambia formally became a British colony in 1924; from 1889 to 1924, the then Northern Rhodesia was ruled as a British Protectorate administered by the British South African Company (BSA) (see Bruce & Dorner, Citation1982).
2 There is confusion on what the exact share of mining in total output is in Zambia; some sources suggest that it was about 3% in 2012, but other estimates give a much higher figure (see ICCM, Citation2014).
3 Non-traditional exports are defined as anything other than copper and related products; the main ones being maize, maize seed, cement, wheat, burley tobacco, electrical cables, cotton lint, cane sugar and chemical (Republic of Zambia, Citation2012:1).
4 Some analysts have referred to this model as ‘a special case of the “general transformation model”’ (see Johnston & Mellor, Citation1961:568); ‘special’ in the sense that the model is applicable only under conditions where there is unlimited supply of (surplus) labour.
5 More directly, Lewis further asserts that ‘it is agriculture which finances industrialisation’ by taxing the farmers as well as by keeping their real wages low (Citation1954:434).
6 There was a huge increase in the number of workers in informal employment in the services and manufacturing sectors between 2005 and 2012, and this could be attributed to the discrepancy in the measurement.
References
- ACET (African Centre for Economic Transformation), 2014. Zambia transformation profile. http://www.acetforafrica.org Accessed 03 September 2014.
- AfDB (African Development Bank)/ OECD (Organisation for Economic Cooperation and Development)/ UNDP (United Nationa Development Programm)/ ECA (Economic Commission for Africa), 2013. African economic outlook 2013: Structural transformation and natural resources (Special Thematic Edition). http://www.oecd-ilibrary.org/docserver/download/4113021e.pdf? Accessed 18 November 2014.
- Bates, R, 1981. Markets and states in tropical Africa: The political basis of agricultural policies. University of California Press, Berkeley.
- Bhagavan, M, 1978. Zambia: Impact of industrial strategy on regional imbalance and social inequality. Scandinavian Institute of African Studies, Uppsala, Research Report No.44.
- Bruce, JW & Dorner, P, 1982. Agricultural land tenure in Zambia: Perspectives, problems, and opportunities. Land Tenure Center, University of Wisconsin-Madison.
- Chitonge, H, 2015. The Matthew effect of growth in Africa: The case of rising inequality in the midst of sustained growth in Zambia. African Journal of Social Sciences 5(3), 1–20.
- CSO (Central Statistics Office), 2005. 2005 Labour force survey. CSO, Lusaka.
- CSO (Central Statistics Office), 2006. Living conditions monitoring survey data. Government of Zambia, Lusaka (on DVD).
- CSO (Central Statistics Office), 2014a. Living conditions monitoring survey data. Government of Zambia, Lusaka (on DVD).
- CSO (Central Statistical Office), 2014b. Preliminary results of the 2012 labour force survey. CSO, Lusaka.
- Collier, Paul, 2008. The politics of hunger: How illusion and greed fan the food crisis. Foreign Affairs 87(6), pp. 67–79.
- Dihn, H, 2014. Light manufacturing in Zambia: Job creation and prosperity in a resource-based economy. The World Bank, New York.
- ECA (Economic Commission for Africa), 2012. Economic report on Africa: Unleashing Africa’s potential as a pole of global growth. ECA, Addis Ababa.
- Faber, M & Potter, J, 1971. Towards economic independence: Papers on the nationalisation of the Copper Industry in Zambia. Cambridge University Press, Cambridge.
- ICMM (International Council on Mining and Mentals), 2014. Press information sheet, supplementary to news release. http://www.icmm.com/document/6290 Accessed 02 September 2014.
- ILO (International Labour Organisation), 2012. Decent work country profile: Zambia. ILO, Geneva.
- Johnston, B & Mellor, J, 1961. The role of agriculture in economic development. The American Economic Review 51(4), pp. 566–93.
- Kaunda, K, 1969. Towards complete independence. Zambia Information Services, Lusaka.
- Kitenge, C & Kingombe, M, 2004. Current practices in labour market information systems in Zambia. Centre for Poverty Reduction and Development, Working Paper No.1. Imperial College, University of London.
- Lewis, A, 1954. Economic development with unlimited supplies of labour. Manchester School 22, 400–449. doi: 10.1111/j.1467-9957.1954.tb00021.x
- McMillan, M & Rodrik, D, 2011. Globalisation, structural change and productivity growth. National Bureau of Economic Research (NBER) Working Paper No. 17143.
- Ndulu, B & O’Connell, S, 2008. Policy plus: African growth performance, 1960–2000. In Ndulu, B, O’Connell, S, Bates, R, Collier, P & Soludo, C (Eds.), The political economy of economic growth in Africa 1960–2000. Cambridge University Press, Cambridge, pp. 1–75.
- NEPAD (New Partnership for African Development), 2014. Agriculture in Africa: Transformation and outlook. NEPAD, Johannesburg.
- Pingali, P, 1997. From subsistence to commercial production systems: The transformation of Asian agriculture. American Journal of Agricultural Economics 79(2), 628–34. doi:10.2307/1244162.
- Prebisch, Raul, 1984. Five stages in my thinking on development. In Meier, GM (ed.), Pioneers in development. Oxford University Press, New York/London, pp. 175–204.
- Republic of Zambia, 2007. Manufacturing sector survey (MSS) 2000–2001, Final Report. Ministry of Commerce, Trade and Industry, Lusaka.
- Republic of Zambia, 2011. Sixth national development plan 2011–2015. Ministry of Finance and National Planning, Lusaka.
- Republic of Zambia, 2012. Strategy Paper on Industrialisation and Job Creation (SPIJC). Technical Committee on Industrialisation and Job Creation, Ministry of Commerce, Trade and Industry, Lusaka.
- Republic of Zambia, 2014. The 2011–2012 manufacturing sector study (MSS) Report. Ministry of Commerce, Trade and Industry, Lusaka.
- Resnick, D & Thurlow, J, 2014. The political economy of Zambia’s recovery: Structural change without transformation. International Food Policy Research Institute (IFPRI) Discussion Paper 01320.
- Sender, J & Smith, A, 1986. The development of capitalism in Africa. London/New York: Methuen.
- Singer, W. Hans 1950. The Distribution of gains between investing and borrowing countries. American Economic Review 2(40), 473–485.
- Tangari, R, 1984. The parastatal and industry—Loss! Public enterprise and industrial development: The Industrial Development Corporation of Zambia (INDECO). In Woldring, K, (Ed.), Beyond political independence: Zambia development predicament in the 1980s. Mouton, Berlin, pp. 113–128.
- Timmer, M, de Vries, G & de Vries, K, 2014. Patterns of structural change in developing countries. Groningen Growth and Development Centre (GGDC) Working Paper No. 149.
- Woldring, K, 1984. The rural malaise in Zambia: Reflections on the Rene Dumont report and the state farms project. In Woldring, K. (Ed.), Beyond political independence: Zambia development predicament in the 1980s. Mouton, Berlin, pp. 95–112.
- World Bank, 2003. Zambia: The Challenge of Competitiveness and Diversification. Report No. 25388-Za. The World Bank, Washington, DC.
- World Bank, 2012. An update to the World Bank’s estimates of consumption poverty in the developing world. The World Bank, Washington, D.C. http://siteresources.worldbank.org/INTPOVCALNET/Resources/Global_Poverty_Update_2012_02-29-12.pdf Accessed 13 May 2013.
- World Bank, 2013. Zambia’s jobs challenge: Realities on the ground. Zambia Economic Brief, Issue 2. The World Bank, Washington, D.C.
- World Bank, 2014. Africa’s pulse: An analysis of issues shaping Africa’s economic future. Vol. 9 (April, 2014). 1–49.
- York, G, 2015. Declining copper prices a large factor in Zambia’s economic tumble. The Global Mail, Monday 26 October, 2015.
- ZDA (Zambia Development Agency), 2011. Agriculture, livestock and fisheries sector profile. ZDA, Lusaka.