
ABSTRACT
The use of value-added tax (VAT) zero-rating has become widely accepted internationally to mitigate the regressivity of the tax. From an economic perspective, it remains contestable whether VAT zero-rating is the most cost-effective way of targeting the poor. This article addresses some topical issues on VAT zero-rating in South Africa. We first ask whether (conceptually) zero-rating should be a consideration within the context of tax theory literature, and then quantify the impact on the poor if zero-rating was to be removed, as well as the tax revenue implications thereof. We compare the cost of VAT zero-rating with the benefit, using data sourced from the Income and Expenditure Survey 2010/11 and the Estimates of National Expenditure. Our findings show that VAT zero-rating (compared with existing social transfer programmes) is not cost-effective when targeting the poor.
1. Introduction
On 30 September 1991 South Africa replaced its general sales tax, levied at 12%, with a broad-base value-added tax (VAT) at 10%. Because of its broad-basedness, the replacement was deemed to be more or less revenue-neutral to the fiscus. The structure of VAT reflected the widely held view (at the time) that allocative efficiency and tax revenue goals were best served by a broad-based tax, while the regressive impact of VAT (as an indirect tax) is best countered by targeted relief to vulnerable groups in society via the expenditure side of the government budget. Retrospectively, this approach matched the thinking about redistribution in South Africa in the Growth, Employment and Redistribution policy document of the post-apartheid government (Republic of South Africa, Citation1996:10):
International experience confirms that it is on the expenditure side that the fiscus is most effectively able to contribute to redistribution. It is nonetheless important that the incidence of taxation should remain progressive,Footnote1 while at the same time impacting across a broad base so as to avoid excessive rates.
Soon after the introduction of VAT, it became clear that a higher rate was required to replace the revenue yielded by the general sales tax. In addition, the regressiveness of VAT was continually challenged and its acceptability was at high risk, arguably also because of the lag with which targeted expenditure programmes would become effective. Consequently, the rate was increased to 14% while at the same time several items which were deemed essential items consumed by lower income groups were zero-rated. This occurred notwithstanding the fact that more well-to-do households were, on aggregate, spending more on the same goods in absolute terms and some of these goods were intermediate inputs in the production of goods and services in the economy.Footnote2 The government zero-rated the following items: mealiemeal, brown bread, mealie rice, samp, dried maize, dried beans, lentils, tinned sardines, milk powder and dairy powder blends (Republic of South Africa, Citation1993:64). In 1993 nine additional items were added: rice, vegetables, fruit, vegetable oil, milk, cultured milk, brown wheat flour, eggs, and edible legumes and legume seeds (Republic of South Africa, Citation1993:64). At the time, it was stated that the primary reason for zero-rating these items was to provide further relief to the poor, and they were chosen after consulting with various interested organisations and groups (Republic of South Africa, Citation1993:64). In 2001 illuminating paraffin was added to the list with the explicit intent to provide low-income groups with lower energy costs, because it constituted a big proportion of their expenditure (Republic of South Africa, Citation2001:82). These additions confirmed that zero-rated items were chosen with the consumption patterns of the poor in mind.
Since then (i.e. for more than 20 years) the basic VAT structure has not changed. Because many other policies and government programmes have been implemented in the meantime, an assessment of the VAT structure in the context of South Africa’s experience and progress with poverty reduction and income redistribution is justified. Hence, the primary purpose of this article is to assess the cost-effectiveness of VAT zero-rating in providing benefits to the poor.
We contextualise our assessment of VAT zero-rating as a redistributive tool by first outlining the extent of poverty and inequality in South Africa. This is followed by some international and local experience on redistributive fiscal instruments. Our attention then turns to a theoretical perspective on the redistributive role of VAT. A quantitative analysis follows which assesses the impact on the poor if zero-rating was to be removed, the tax revenue implications thereof, as well as the cost-effectiveness of VAT zero-rating compared with existing social transfer programmes. Finally, we briefly discuss the possibility of a luxury VAT, before concluding with some policy implications.
2. Poverty and inequality in South Africa – A rationale for redistributive measures
South Africa’s political transition to a democracy in 1994 brought about a period of political stability and accompanying economic growth as the economy opened to global markets. The question of whether the improved economic performance reduced poverty and inequality since then has produced several local studies investigating levels and trends in poverty and inequality (see for example Leibbrandt et al., Citation2006; Van der Berg et al., Citation2008; Bhorat & Van der Westhuizen, Citation2012). One such study by Duclos & Verdier-Chouchane (Citation2011:130) showed that from 1995 to 2005 the national poverty headcount ratio remained unchanged at 41% with the poverty line set at US$3 per day. According to Yu (Citation2016:145), trends in money-metric poverty studies in South Africa have generally shown a downward trend since 2000, even though poverty levels were found to be different across various studies. He ascribes this phenomenon to a variety of factors such as the use of different poverty lines, and differences in how income and expenditure were captured between datasets.
Income inequality, on the other hand, has deteriorated over time. Duclos & Verdier-Chouchane (Citation2011:135) reported Gini coefficients for the population for the years 1995 and 2005, respectively. The analysis revealed that inequality had deteriorated over this period. The World Bank (Citation2014:2) reported the Gini coefficient on disposable income to have risen from 0.67 in 1993 to 0.69 in 2011.Footnote3 These statistics revealed that South Africa remains one of the most unequal societies in the world. Also, according to Chitiga et al. (Citation2014:1), South Africa’s Gini index placed it in the third highest position amongst countries of the Southern African Development Community.
3. Local and international experience on redistributive fiscal measures
The traditional role for fiscal policy is to maintain macroeconomic stability, but its redistributive effects have long been recognised (International Monetary Fund, Citation2014:5). Both spending and taxation policies can impact on inequality; for example, education spending can alter market incomes whereas income taxes can mitigate the inequality of disposable income (International Monetary Fund, Citation2014:4). Social spending includes public spending on education and health, as well as direct transfers such as child support and old age pension transfers (Lustig, Citation2015:10).
In advanced economies, social spending has contributed significantly to a reduction in income inequality (International Monetary Fund, Citation2014:15). However, taking into account lifetime income, the redistributive effect is somewhat smaller. By contrast, because developing countries have much lower tax-to-Gross Domestic Product (GDP) ratios, they subsequently also have lower social spending and allocate a smaller proportion to social transfers (International Monetary Fund, Citation2014:18). In an analysis of seven middle-income countries, Lustig (Citation2015:11) reported reasonably high social spending (as a proportion of GDP) for Brazil and South Africa. These two countries devoted more than 3.5% of GDP to direct transfers (including pensions and family assistance).
Alternative views on the redistributive role of taxation include relying on the tax system to reduce income inequality, or using taxation as a revenue-generating device, with redistribution occurring on the expenditure side of the fiscus (Bird & Zolt, Citation2005:5). Lustig (Citation2015:25) calculated the marginal contributionFootnote4 of particular fiscal interventions such as taxes or transfers for seven middle-income countries and found that direct taxes had a relatively smaller effect on reducing inequality compared with direct transfers in South Africa, Brazil, Chile Columbia and Indonesia, while the reverse was true for Mexico and Peru.
The efficacy of total fiscal redistribution takes account of the combined effect of all social spending and redistributive taxation. In South Africa, the net fiscal impact has succeeded in reducing inequality substantially. Using data for 2000 and 2006, Van der Berg (Citation2009:19) compared the primary Gini coefficient (reflecting the skewness of the income distribution as the outcome of market forces) and the adjusted (secondary) Gini coefficient (which measures the primary or market income plus the net fiscal transfer; i.e. primary income minus direct and indirect taxes plus social spending benefits). Net fiscal transfers made a huge contribution to reducing income inequalities and the fiscal redistribution effect strengthened between 2000 (with the Gini coefficient adjusted from 0.71 to 0.53) and 2006 (with the Gini coefficient adjusted from 0.69 to 0.47). This highlights the fact that a much better assessment of redistribution efforts is obtained when considering the composite picture (i.e. the combined outcome of many fiscal efforts) and that the contribution and usefulness of any individual redistributive effort should thus be contextualised. In this regard, Van der Berg (Citation2009:18–19) has shown that fiscal expenditure caused a reduction of 17 points (from 0.69 to 0.52) in the primary Gini coefficient, which was much more than the reduction of five points caused by tax measures. Recent research under the auspices of Lustig (Citation2014), commissioned by the South African National Treasury (see Inchauste et al., Citation2015:36), confirmed South Africa’s extensive fiscal redistribution, but made the alarming finding that the Gini coefficient after fiscal redistribution in South Africa is still worse than the primary (market) Gini in countries such as Brazil or Mexico.
On the taxation side, South Africa collects about 80% of its taxes from personal income tax, corporate income tax and VAT (National Treasury & South African Revenue Services, Citation2015:6). The country has a progressive personal income tax system, with the highest marginal tax rate currently set at 41%. There is less reliance on indirect taxes as a source of revenue (unlike other developing countries). Specific excise taxes on commodities such as cigarettes have been instrumental in the government’s attempts to alter consumer behaviour.Footnote5 As discussed earlier, VAT zero-rating is employed to mitigate the regressive nature of the VAT. Apart from this, there are also certain exempt supplies (i.e. where a supplier does not levy VAT on sales but does not claim refunds in respect of VAT already collected at earlier stages of production), such as educational services (Black et al., Citation2015:324).
4. Some perspectives on the redistributive role of VAT
4.1. Conceptualising the zero-rating of VAT
The economic literature provides some guidance on the design of indirect taxes such as VAT. From the standpoint of allocative efficiency, the Ramsey rule suggests that the deadweight loss is minimised (if not eliminated) when the rate of tax is inversely proportional to the price elasticity of demand for a good or service, given that all goods and services are subjected to the tax (Rosen & Gayer, Citation2014). This guideline emphasises the broad-basedness of the tax. It also implies that all goods with different price elasticities of demand should be taxed differently. This compromises the administrative efficiency of the tax, puts compliance at risk and makes enforcement potentially costly. That is why a single (universal) rate has been preferred as a second-best, pragmatic approach, thus reflecting a trade-off between allocative and technical or administrative efficiency. Keen (Citation2009:161) states as follows about the single rate issue:
the few empirical studies that have addressed the question firmly reject the weak separability condition of A. B. Atkinson and Joseph E. Stiglitz (Citation1976) under which rate differentiation is unnecessary when – perhaps a reasonable first approximation for developed countries, though evidently not for developing – an optimal nonlinear wage tax can be deployed.
Bird & Gendron (Citation2007), as reported in Keen (Citation2009:160–161), enhance the credibility of this view inter alia because they are non-International Monetary Fund scholars of stature.Footnote6 Their view about VAT design is:
The tax should avoid zero-rating other than for exports, and have minimal exemptions, a single positive rate, a fairly high threshold (perhaps in the order of $100,000 per annum for many low income countries), rely on self-assessment (meaning that taxpayers declare and pay tax due, subject to audit and penalty) and structure the tax administration along functional or taxpayer-segment lines to accommodate the requirements of the VAT.
In a sense the single-rate idea, while perhaps deviating from optimal tax rate design, does go some way towards addressing another complication with VAT, namely its equity implications. This arises from the fact that lower income people (households) spend a large part, if not all, of their income on basic foodstuffs and other necessities with the result that they pay a greater proportion of their income or consumption in tax compared with people in higher income or expenditure categories. VAT is therefore a regressive tax: the tax burden falls with rising income. In this sense, when viewed in isolation, VAT adds to income inequality, but arguably less so than if Ramsey rule rates were to apply. Nonetheless, it is still perceived as a regressive and anti-poor tax.
4.2. Approaches to imposing VAT
One of three approaches (or a combination) is indicated in an assessment of VAT from an efficiency, equity and poverty alleviation point of view, as described in the following.
The regressiveness of a specific indirect tax such as VAT is softened, if not fully neutralised, by way of multiple tax rates, which could take the form of a standard rate and a lower rate for goods and services consumed relatively more intensively by lower income groups. A feature of a second rate below the standard rate is, in a sense, its implied paternalistic nature: the government deliberately or by implication decides which goods that are consumed by lower income households should not be taxed or should be taxed less. This multi-rate approach is sometimes also accompanied by a third rate above the standard rate, namely on luxury goods. This addresses equity but does not contribute to poverty relief. A ‘luxury’ VAT rate not only adds further complexity to tax administration and compliance, but also encounters the difficulty of definition: for example, durable consumer goods such as mobile phones and television sets are heavily used (and bought) by low-income households as well.
A somewhat broader approach is to consider the regressiveness of all indirect taxes, of which VAT is only one type. In this regard excise taxes are looked upon as a tax to compensate for the regressiveness of VAT, which enhances the scope of designing VAT as a broad-based, single-rate tax with the associated efficiency gains. By levying an excise tax on luxury items typically consumed by the rich, a clear redistribution signal is given. Moreover, if the to-be-taxed products are carefully chosen, such a tax would arguably be applied to imported rather than domestic production – this is tantamount to an import tax, which will then have a small impact, if any, on local producers. This approach suffers from the same definitional problems as the first approach and because of the relatively high price elasticities of demand typically associated with these types of products, the distributional and revenue gains from such taxes are not likely to be very significant.
An even wider approach focuses on the combination of tax and government expenditure. In other words, the total or net fiscal impact on households is at issue (empirical studies following this approach were discussed earlier). In general, the consensus on VAT design in the international literature is to adopt a single tax rate and undertake fiscal redistribution via the expenditure side of the budget (see Keen, Citation2012:8; OECD, Citation2012:71–72). However, the international literature still recognises exceptions, thus validating reliance on the first two approaches already discussed, in cases where reduced rates may be a consideration. Bird & Gendron (Citation2006:295), for example, point out that universal rates may be problematic in developing countries where the poor do not benefit from redistribution efforts via the income tax system since they are not part of it, or from transfer payment systems that are not well developed. Bird & Gendron (Citation2007), as reported in Keen (Citation2009:165), emphasise this: looking at the impact of any single tax, ignoring offsetting changes in other taxes and/or public spending, gives a false picture of overall distributional impacts, which is what really matters.
4.3. Assessing the efficacy of VAT as a redistributive measure
Whether or not VAT zero-rating has the appropriate distributional impact can be assessed using various methods. One possibility is to apply incidence analysis (i.e. determining the tax burden, or how tax relief alters the tax burden), using micro-level data such as household surveys. This allows for an analysis of the welfare effects in a static manner with no consideration of behavioural responses (Bastagli, Citation2015:8). Some of the earlier studies cited (see Inchauste et al., Citation2015:9; Lustig, Citation2015:12) have applied such an approach. Another approach is to use computable general equilibrium models to analyse the welfare implications of tax reform (Bastagli, Citation2015:8). These models make assumptions about the optimisation behaviour of economic agents, together with an analysis of equilibrium conditions, and evaluate and compare outcomes in the economy with and without the reform options (Mabugu et al., Citation2015:ii78). Muñoz & Cho (Citation2003:5) evaluated VAT incidence in Ethiopia (as a replacement for sales taxes). Their findings revealed that VAT is progressive but to a lesser extent than the sales taxes. VAT also caused a greater tax burden for the poor in particular, and exempt goods and services were disproportionately consumed by higher income groups; hence it did not contribute to making VAT more equitable.
Mabugu et al. (Citation2015) investigated the distributional implications of tax reform options locally, using a computable general equilibrium model combined with microsimulations. One of the simulations investigated a pro-poor scenario of increasing VAT and recycling the additional revenues to poor households. The authors increased the VAT on all products and the additional tax income was distributed to the poor based on alternative poverty threshold assumptions. They found that the mean incomes of these households increased considerably, which also reduced poverty and inequality. Hence, the authors concluded that a viable pro-poor tax reform option is to increase consumption taxes alongside a progressive income tax system, and simultaneously increase welfare transfers (Mabugu et al., Citation2015:ii98).
Based on experiences elsewhere and with reference to the redistribution efforts and patterns in South Africa during the past 20 years, this article explores the extent to which zero-rating has become a much less significant factor than when it was considered and assessed almost as a lone-standing instrument and thus implemented to compensate for the regressiveness of VAT in the early 1990s. We add to the local empirical evidence on pro-poor VAT reform (see Mabugu et al., Citation2015) by providing a more disaggregated and in-depth partial analysis of VAT zero-rating, while also highlighting its cost-effectiveness compared with social transfers.
5. Data and research methodology
We use expenditure data from the Income and Expenditure Survey (IES) of 2010/11, released by Statistics South Africa (Citation2012). We first analyse household spending patterns on the zero-rated items across the income distribution. We use total consumption as the indicator variable because income data in surveys generally tend to be under-reported and are also less accurate as an indicator of actual living standards. We use these data to calculate the tax revenue foregone for the zero-rated items, and derive the tax amount by multiplying the expenditure on zero-rated items by the VAT rate of 14%. We perform a simple cost–benefit analysis in order to compare VAT zero-rating to social assistance programmes, by comparing the benefit of zero-rating (i.e. the benefit to the poor) with the cost of zero-rating (i.e. the foregone tax revenue to the rich). We calculate a similar ratio for social assistance programmes by comparing the benefits to the beneficiaries with the administrative cost of the programmes: for these calculations we use estimates of national expenditure released by National Treasury (Citation2014:2, 9 and 27).
Our approach is a partial analysis, unlike other empirical studies of this nature (see for example Mabugu et al., Citation2015:ii81–ii84). Hence, we do not analyse the distributional impact of both social spending and taxation. The motivation behind this is to provide a much more in-depth analysis of VAT zero-rating at the individual product level.
6. Results
6.1. Main findings on zero-rated items
Of the 19 basic food items, we include 16 food items identified in the IES 2010/11 for which expenditure data are available (items such as brown wheaten meal, dried mealies and dairy powder blend are not listed) (see ). We also assume that both edible oils and cooking fat (vegetable) represent vegetable oil (as one item on the zero-rated list). Paraffin is added to the analysis. Because the majority of the items are included, these few exclusions will not have a significant effect on the analysis.
Table 1. Spending on zero-rated goods as a proportion of total consumption (%), by consumption decile, 2010/11.
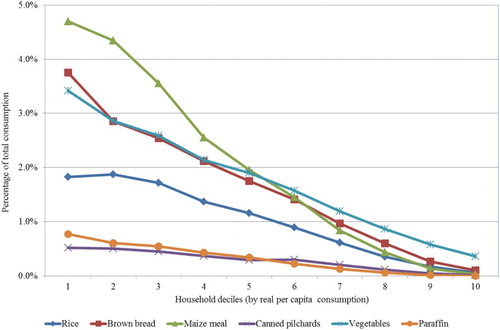
shows that spending on most zero-rated items as a proportion of total consumption declines across the consumption deciles. shows these proportions for selected zero-rated items, by household consumption decile. Spending by lower income groups on these items constitutes a much higher percentage of the consumer goods basket than for higher income groups, thus confirming the softening impact of zero-rating on the regressiveness of VAT.
Figure 1. Spending on selected zero-rated items as a proportion of total consumption, by consumption decile. Source: Authors’ own calculations from IES 2010/11.
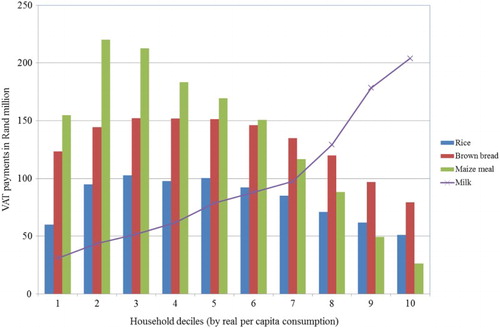
By contrast, the cost to the fiscus of zero-rating is greatly enhanced because of the consumption of such items across all deciles. Some examples of these items are illustrated in . Assuming the bottom four deciles represent the real truly needy, it transpires that the ‘unnecessary’ tax relief from zero-rating (effectively the ‘wasted’ benefit accruing to higher income groups) amounts to R5265 million (in 2012 prices), or approximately 55% more than the combined benefit to the bottom four deciles.Footnote7 This underscores Keen’s (Citation2012:5) reminder that ‘(a)nalysts often point out that most of the benefit of reduced indirect tax rates actually accrues to the better-off, making this a very poorly targeted way of pursuing equity objectives’.
Figure 2. VAT revenue foregone on selected zero-rated goods (Rand million). Source: Authors’ own calculations from IES 2010/11.
shows the value that zero-rating bestows on households by consumption decile, and the benefit received by the poorest 40% of households, compared with the cost for the fiscus of such benefits (i.e. the foregone revenue due to the zero-rated consumption by the highest six consumption deciles). The poorest 40% of households received a benefit of R3396 million (in 2012 prices), compared with R5265 million for the richer households (in 2012 prices). The ratio of the total benefit (i.e. foregone revenue to deciles one to four) to total cost (i.e. foregone revenue to deciles five to 10) is 0.65.
Table 2. Zero-rating benefit by consumption decile, 2010/11 (Rand million, 2012 prices).
Because of the across-the-board consumption of zero-rated products, zero-rating has more value as an anti-poverty instrument than an inequality-reducing instrument. In this regard, Keen (Citation2012:7) observes that:
… the amount of redistribution that can be achieved by differentiating rates of indirect taxation will generally be quite limited … because variation in the share of income spent on particular goods is generally just not great enough to make this an effective way to distinguish between poor and rich.
The balanced-budget approach to tax analysis means that any tax relief in the form of zero-rating has to be compensated for by other taxes, which obviously will have different distributional features. This means that the tax system as it stands today reflects a set of taxes and distributional effects which came about when certain goods were zero-rated as many as 20 years ago. This means that, should zero-rating be removed or reduced, the impact on the economy goes much further than that of the removal because a new set of distributional relations will be effected. Their nature will depend on how the extra revenue is used. An option could include using the tax revenue from a 14% VAT on formerly zero-rated goods to finance new or existing income support programmes to the poor equivalent to the foregone benefit received under zero-rating. To the extent that the delivery cost is less than the tax yield gained from the rich, there will be a net revenue gain for the government (to be allocated in line with other fiscal priorities). In the hand of skilled politicians and technocrats, such a scenario might be feasible from a political economy as well.Footnote8 A key question will be whether zero-rating can be replaced by a programme that reaches the same beneficiaries.Footnote9 We return to this question later.
There are further considerations when assessing the effectiveness and importance of zero-rating in the broader context of poverty alleviation and income inequality. One is the relative contribution of zero-rating over time, compared with other forms of assistance – as indicated by the third approach to imposing VAT in Section 4.2. This remains an issue of debate and raises a fundamental question posed by Keen (Citation2012:5):
How well targeted do public spending measures have to be for the poor to be best served not by taxing at a particularly low or zero rate those commodities that account for an especially large part of their budget, but by taxing them and using the proceeds to increase that public spending?
shows the changing ratio of benefits from zero-rating relative to budgeted social assistance in South Africa, together with delivery cost, for the survey year 2010/11, on the assumption that the lowest four deciles represent the targeted groups for both programmes. Social assistance includes expenditure on old age, child support, war veterans, disability, foster care, care dependency, grant-in-aid and social relief (National Treasury, Citation2014:9). The total number of beneficiaries was approximately 14.7 million (about 28% of the population) in 2010/11. This reflects a much higher benefit-to-cost ratio for social assistance than for VAT zero-rating (calculated as the foregone tax revenue for the top six deciles). The social assistance programme clearly is much better targeted and arguably more effective from a benefit–cost point of view, but the distributional effect is of course different. There is one big difference between the cost drivers of the two schemes. Zero-rating adjusts automatically to inflation: transfers are cash amounts that require discretionary inflation adjustments. In the event that cash transfers do not keep pace with inflation, this difference clearly makes zero-rating a better option for beneficiaries. also presents evidence that the social assistance programme dwarfs the zero-rating in money terms.
Table 3. Comparison of benefits and costs of social assistance and VAT zero-rating.
A sensitivity analysis of the benefit–cost ratios for VAT zero-rating is shown in and (for selected items). We assume alternative scenarios of who comprises the poorest consumer group; that is, we show the ratios for Group 1 (comprising only decile one), Group 2 (comprising deciles one and two), Group 3 (comprising deciles one, two and three), Group 4 (comprising deciles one, two, three and four) and, finally, Group 5 (comprising households with real per-capita consumption below the poverty line of R7859.28 per annum in 2012 prices).Footnote10
Figure 3. Benefit–cost ratios for alternative scenarios of the poor. Source: Authors’ own calculations from IES 2010/11.
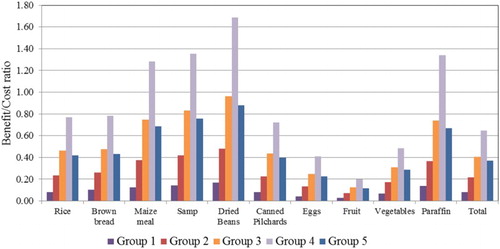
Table 4. Benefit–cost ratios for alternative scenarios of the poor.
The total benefit–cost ratio is relatively smaller for Group 1 (decile one), followed by Group 2 (decile two) and then Group 5 (households below the poverty line), compared with Group 4 (the same group represented in ). A comparison of the ratios for the individual items indicates that certain items are disproportionately consumed by the poor (because the revenue foregone for the poor is relatively larger in these cases), such as maize meal, samp, dried beans and paraffin. However, the total benefit–cost ratios still remain smaller compared with the social assistance transfer ratios presented in . This unequivocally confirms that social transfers are more cost-effective than VAT zero-rating.
One of the conditions under which the targeted transfers are likely to be more effective in dealing with distributional issues than zero-rating selected items is when they are in the form of means-tested cash transfer systems. When South Africa introduced and expanded its multiple-rate VAT system during the 1990s, its welfare transfer system was in an early stage of development and of limited coverage. Subsequently a quite successful means-tested and cash transfer systemFootnote11 has been developed, consisting of old age pensions, disability grants and child support grants. An important advantage of this means-tested transfer system is its progressive reduction in the benefit as income rises, a benefit reduction along a sliding scale which zero-rating lacks. It might, of course, be argued that targeted expenditure is subject to benefit shifting in the sense that the de facto beneficiary is not the same as the de jure beneficiary. The same phenomenon characterises tax benefit incidence, however. South Africa’s progress with poverty relief systems since the early 1990s has therefore diminished the importance and usefulness of, and consequently the need for, zero-rating, although the removal of such tax benefits, however small relative to other social security benefits, remains a thorny issue.
One question that arises is whether the presented argument for a reduced reliance on indirect tax relief is also evidenced by international trends. presents a summary of the international experience, showing that over time an increased percentage of new VAT regimes has carried a single rate at introduction.
Table 5. International experience: VATs with a single rate at time of introduction.
Anecdotal case-study evidence of country developments about trends in the structure of VAT in developing countries is also relevant to this analysis. India is an example of distributional choice. In the face of equity considerations, their Empowered Committee of State Finance Ministers suggested a standard VATFootnote12 rate of 20% (state and federal VATs combined) in 2009 and a reduced rate of 12% on necessities, but converging to 16% within three years (Keen, Citation2012:5) – thus signalling an envisaged reduced reliance for equity purposes on multiple VAT rates. Even so, zero-rating (and thus the first approach in Section 4.2) remains an attractive pragmatic choice, which depends on the availability of alternative redistributive instruments. In this regard, Keen (Citation2009:166) reports both Bird & Gendron (Citation2007) and Ebrill et al. (Citation2001) as stating that the case for differential rates of commodity taxation is stronger in developing countries than elsewhere, given the lesser availability of other instruments to address distributional concerns. Other factors also influence the VAT structure. Ghana is an example of the political economy difficulties of the reform of a VAT system. It turned out that a main difference between an initial, failed VAT and a subsequent, successful one was a substantial increase in the threshold, removing many small firms from the tax base.Footnote13 The presented discussion leads us to a few further questions, which we now address.
6.2. How much revenue would be gained by abolishing zero-rating?
presents an estimate of the net impact on the fiscus if the zero-rated items analysed were to be taxed at the standard VAT rate of 14%, assuming that the revenue gain from the poorest four deciles are reallocated to a social assistance programme with the same ratio between benefits and delivery cost as for existing programmes depicted in . The net saving in 2012 prices would be R4688 million. A reallocation of government funds as implied by the calculation presented in will plug a huge leakage in the indirect tax system, thus adding to tax efficiency. Provided the compensatory social assistance is implemented efficiently and is well targeted, the end result will also be superior to zero-ratingFootnote14 as regards income inequality, but without sacrificing poverty relief. Hence, our micro-level analysis supports the findings of Mabugu et al. (Citation2015:ii98).
Table 6. Estimate of the net revenue gain for the fiscus of replacing zero-rating with target social assistance.
6.3. A luxury VAT
Imposing a luxury VAT is another option to consider, and how it compares with tweaking excise rates. We identify items that one might target and the revenue implications thereof. More importantly, we investigate the pro-poor nature of such a policy option.
As mentioned in Section 4.2, a higher VAT rate on luxury goods will encounter the same identification and administrative difficulties mentioned in respect of ‘luxury’ excise taxes. , for example, presents VAT payments on ‘non-essential’ goods, including items which might be thought of as luxury goods, such as televisions and laptops. There are a few products that are exclusively consumed in the top deciles, such as four-wheel-drive vehicles and boats, aircrafts and go-carts. The benefit of an excise tax above a luxury VAT is that such a tax would become integrated with an existing tax system. Even if it is possible to identify such luxury items, however, their value will only be in reducing inequalities (subject to the extent they are consumed by the poor), and will not contribute to poverty reduction.Footnote15
Table 7. Government revenue from VAT on non-essential products for 2010/11 (Rand million, in 2012 prices).
7. Policy implications: Is there a distributionally neutral substitute for zero-rating?
At various points in this article a key question has been raised or implied: can VAT zero-rating be replaced by a social transfer programme that reaches the same lower income beneficiaries, and leave none of them worse off? The results of Mabugu et al. (Citation2015) showed a reduction in poverty and inequality if the additional revenue raised (from increased VAT rates) was allocated to the poor in the form of a cash transfer. These transfers, however, were universal to all poor households and did not represent a non-neutral impact in the sense of recognising differences between households and across income deciles in spending behaviour. This raises some questions.
First, if we remove zero-rating and we tax all goods at a standard rate with the purpose of raising sufficient revenue to compensate the poor for their losses, we must know who the beneficiaries of zero-rating are. Establishing a welfare-neutral transfer to the poor will be difficult because it requires information on consumptions patterns of the poor at the micro-level, which makes such a transfer administratively difficult to implement. More work will be needed to establish the extent to which a one-to-one correspondence will be possible and/or to identify non-corresponding beneficiaries – an endeavour that will definitely be worthwhile given the potential net fiscal saving of R4688 million (in 2012 prices). Hence, although the conditional transfer suggested by Mabugu et al. (Citation2015:ii93–ii94) introduces a dimension to welfare payments that requires a compensatory effort of some sort for beneficiaries, it still does not replace VAT zero-rating with an adequately discriminating transfer that recognises differences in spending patterns.
A second question is whether any other more cost-effective programmes can be conceptualised. At various times in the past the idea of a universal grant was proposed, part of which could be recouped via the income tax system (i.e. designing the grant as a negative income tax). The idea was judged to be unacceptable from a cost point of view. Given the information discussed in this article about the ‘delivery cost’ of zero-rated goods, it might just be an appropriate time to investigate alternatives to zero-rating (an example would be a universal grant) and compare the relative delivery costs of these alternatives with those of zero-rated goods.
One aspect that our research has made apparent is that, if VAT zero-rating is to remain intact, there will have to be a rigorous investigation into the appropriateness of items on the zero-rated list and the mechanisms to identify them (taking account of consumption patterns of the poor and their nutritional habits).
8. Conclusion
This article investigated a number of questions about possible changes in the South African VAT tax system from the perspectives of efficiency and equity (including poverty alleviation), against the backdrop of theoretical views and empirical findings on poverty and income inequality in South Africa. The feasibility and political acceptability of moving towards a broad-based and single-rate VAT depends on the extent to which well-targeted social assistance programmes are or can be put in place. Since the introduction of a relatively broad-based VAT in South Africa in 1991, the coverage and delivery effectiveness of social assistance programmes have developed substantially. The latter now dwarfs zero-rating in its effect on inequality and poverty alleviation and seemingly demonstrates a superior benefit–cost ratio. However, removing VAT zero-rating will present quite severe challenges to the political economy of taxation, given vested interests and the prospective replacement of a tax benefit that adjusts automatically with a government transfer benefit that relies on discretionary policy changes.
Disclosure statement
No potential conflict of interest was reported by the authors.
Additional information
Funding
Notes
1 This also implies that the nature and extent of fiscal redistribution extends beyond the impact of any single tax or expenditure measure: an assessment of fiscal incidence in its entirety is indicated.
2 For example, when any of the zero-rated food items is used as feed for animals.
3 There are limitations to using the Gini coefficient. Chitiga et al. (Citation2014) refer to, amongst others, demographic changes that are not considered (e.g. having a higher proportion of elderly people can increase inequality). Lifetime income must be considered as well – see Charles-Coll (Citation2011:26) for more details.
4 Lustig (Citation2015:25) defines the marginal contribution as equivalent to asking what inequality would have been with or without a particular fiscal instrument (or modifications in that instrument).
5 Arguably this warrants a different assessment of their distributional impact than if they were mere revenue-generating taxes.
6 We emphasise this, in case the reader should think that scholars closely associated with the International Monetary Fund (such as Keen) may be biased in the sense of being subject to a ‘house view’ of the International Monetary Fund.
7 A similar picture can be shown for Mexico, which also has extensive zero-rating of food and other items (see Keen Citation2012:8).
8 contains estimates of the revenue, cost and net fiscal gain.
9 It has to be noted that we do not take into account the impact of exemption from VAT on low-income groups in our analysis.
10 This is based on the poverty lined used by Woolard & Leibbrandt (Citation2006:22) of R322 per capita per month (R3864 per annum) in 2000 prices. We use consumption instead of income to draw the poverty line.
11 The large volume of social grant spending in South Africa, at about 3.5% of GDP, is almost twice as large as in other developing countries with large grant systems (Van der Berg & Siebrits Citation2015:173).
12 VAT is called a general sales tax in India.
13 See Keen (Citation2009:167–168) for this and other country examples of compensatory measures when introducing VAT or engaging in VAT reforms.
14 Lustig’s (Citation2014) study confirmed the hugely successful redistribution impact of South Africa’s income-support programmes, but was silent on the relative cost of the expenditure and tax programmes.
15 The magnitudes are such that these taxes are unlikely to make much of a dent in the Gini coefficient.
References
- Atkinson, AB & Stiglitz, JE, 1976. The design of tax structure: Direct versus indirect taxation. Journal of Public Economics 6(1-2), 55–75. doi: 10.1016/0047-2727(76)90041-4
- Bastagli, F, 2015. Bringing taxation into social protection analysis and planning. ODI Working Paper 421. Overseas Development Institute. https://www.odi.org/sites/odi.org.uk/files/odi-assets/publications-opinion-files/9700.pdf Accessed 2 August 2016.
- Bhorat, H & Van der Westhuizen, C, 2012. Poverty, inequality and the nature of economic growth in South Africa. DPRU Working Paper 12/151. Development Policy Research Unit, Cape Town.
- Bird, RM & Gendron, P, 2006. Is VAT the best way to impose a general consumption tax in developing countries? Bulletin for International Taxation 60(7), 287–96.
- Bird, RM & Gendron, P, 2007. The VAT in developing and transitional countries. Cambridge University Press, Cambridge and New York.
- Bird, RM & Zolt, EM. 2005. Redistribution via taxation: The limited role of the personal income tax in developing countries. Law & Economics Research Paper Series, Research Paper No. 05-22. Los Angeles School of Law, University of California.
- Black, PA, Calitz, E, & Steenekamp, TJ (Eds), 2015. Public economics. 6th edn. Oxford University Press, Cape Town.
- Charles-Coll, JA, 2011. Understanding income inequality: Concept, causes and measurement. International Journal of Economics and Management Sciences 1(3), 17–28.
- Chitiga, M, Owusu-Sekyere, E & Tsoanamatsie, N, 2014. Income inequality and limitations of the Gini index: The case of South Africa. Human Sciences Research Council, November 2014, http://www.hsrc.ac.za/en/review/hsrc-review-november-2014/limitations-of-gini-index Accessed 30 July 2016.
- Duclos, J & Verdier-Chouchane, A, 2011. Analyzing pro-poor growth in Southern Africa: Lessons from Mauritius and South Africa. African Development Review 23(2), 121–46. doi: 10.1111/j.1467-8268.2011.00276.x
- Ebrill, L, Keen, M, Bodin, J & Summers, V, 2001. The modern VAT. International Monetary Fund, Washington, DC.
- Inchauste, G, Lustig, N, Maboshe, M, Purfield, C & Woolard, I, 2015. The distributional impact of fiscal policy in South Africa. Policy Research Working Paper Series 7194, The World Bank.
- International Monetary Fund, 2014. Fiscal policy and income inequality. IMF Fiscal Policy Paper. https://www.imf.org/external/np/pp/eng/2014/012314.pdf Accessed 1 August 2016.
- Keen, M, 2009. What do (and don’t) we know about the value added tax? A review of Richard M. Bird and Pierre-Pascal Gendron’s the VAT in developing and transitional countries. Journal of Economic Literature 47(1), 159–70. doi: 10.1257/jel.47.1.159
- Keen, M, 2012. Targeting, cascading, and indirect tax design. Paper delivered as the third Dr Raja J. Chelliah memorial lecture. National Institute of Public Finance and Policy, New Delhi. 9 February 2012. 31 pages.
- Leibbrandt, M, Poswell, L, Naidoo, P & Welch, M, 2006. Measuring recent changes in South African inequality and poverty using 1996 and 2001 census data. In Bhorat, H & Kanbur, R (Eds.), Poverty and policies in post-apartheid South Africa. Human Sciences Research Council, Cape Town, 95–142.
- Lustig, N, 2014. Fiscal policy, inequality and the poor in the developing world. Round 1. CEQ Working Paper No. 23, Center for Inter-American Policy and Research and Department of Economics, Tulane University and Inter-American Dialogue.
- Lustig, N, 2015. Inequality and fiscal redistribution in middle income countries: Brazil, Chile, Colombia, Indonesia, Mexico, Peru and South Africa. Working paper 1505, Tulane Economics Working Paper Series. Tulane University, Tulane.
- Mabugu, R, Fofana, I & Chitiga, M, 2015. Pro-poor tax policy changes in South Africa: Potential and limitations. Journal of African Economies 24(suppl 2), ii73–ii105. doi: 10.1093/jae/eju038
- Muñoz, S & Cho, S, 2003. Social impact of a tax reform: The case of Ethiopia. IMF Working Paper N. 03/232, Fiscal Affairs Department, International Monetary Fund.
- National Treasury, 2014. Budget 2014. Estimate of national expenditure. Vote 19. Social development. National Treasury, Pretoria.
- National Treasury & South African Revenue Services, 2015. 2015 tax statistics. Joint publication by National Treasury and South African Revenue Services. http://www.treasury.gov.za/publications/tax%20statistics/2015/TStats%202015%20Inside%20WEB.pdf Accessed 2 August 2016.
- OECD, 2012. Consumption tax trends 2012: Vat/GST and excise rates, trends and administration issues. OECD Publishing, Paris. http://www.oecd-ilibrary.org/taxation/consumption-tax-trends-2012_ctt-2012-en Accessed 21 May 2015.
- Republic of South Africa, 1993, Budget review, 1993. Department of Finance, Cape Town. http://www.treasury.gov.za/documents/national%20budget/Budget%20Review%201993.pdf Accessed 2 August 2016.
- Republic of South Africa, 1996. Macroeconomic strategy on growth, employment and redistribution. Government Printer, Pretoria.
- Republic of South Africa, 2001. Budget review 2001. Chapter 4. Revenue issues and tax proposals. National Treasury, Pretoria. http://www.treasury.gov.za/documents/national%20budget/2001/review/Chapter%204.pdf Accessed 2 August 2016.
- Rosen, HS & Gayer, T, 2014. Public finance. 10th edn. McGraw-Hill Education, Maidenhead, UK.
- Statistics South Africa, 2012. Income and expenditure survey 2010/2011. Statistics South Africa, Pretoria.
- Van der Berg, S, 2009. Fiscal incidence of social spending in South Africa, 2006. Stellenbosch Working Paper Series No. WP10/2009. http://www.ekon.sun.ac.za/wpapers/2009 Accessed 24 September 2014.
- Van der Berg, S & Siebrits, K, 2015. Social security. Chapter. In Black, PA, Calitz, E & Steenekamp, TJ (Eds.), Public economics. 6th edn. Oxford University Press, Cape Town. Chapter 9, 170–91.
- Van der Berg, S, Louw, M & Yu, D, 2008. Post-transition poverty trends based on an alternative data source. The South African Journal of Economics 76(1), 58–76. doi: 10.1111/j.1813-6982.2008.00161.x
- Woolard, I & Leibbrandt, M, 2006. Towards a poverty line for South Africa: Background note. Southern Africa Labour and Development Research Unit, University of Cape Town, Cape Town.
- World Bank, 2014. South Africa economic update. Fiscal policy and redistribution in an unequal society. The World Bank, Washington, DC. https://openknowledge.worldbank.org/bitstream/handle/10986/20661/921670WP0P131400SAEU60for0web01029b.pdf?sequence=1 Accessed 2 August 2016.
- Yu, D, 2016. Factors influencing the comparability of poverty estimates across household surveys. Development Southern Africa 33(2), 145–65. doi: 10.1080/0376835X.2015.1120646