
ABSTRACT
Although consensus to move beyond gross domestic product (GDP) for measuring development in Africa exists, efforts to operationalise the idea have been frustrated by institutional barriers and lack of an integrated methodology. This article addresses the methodological problem by introducing an innovative graphic tool – The Gauteng City-Region Socio-Economic Barometer. The tool pulls together a set of 38 indicators across 10 sectors into a single analytical visual. Its efficacy rests in its ability to show each individual indicator, sector, and the overall socio-economy simultaneously. The Barometer not only acts as a tracking and diagnostic tool but as a benchmarking tool as well. Applied to Gauteng province of South Africa, the Barometer shows that high levels of GDP do not necessarily mean good quality of life. Assessment of welfare solely on the basis of GDP can therefore be misleading for government. The Barometer methodology is an invaluable tool for governments committed to evidence-based planning.
1. Introduction
The need to move beyond gross domestic product (GDP) in measuring development is widely shared (Costanza et al., Citation2009; Daly & Posner, Citation2011; Fioramonti, Citation2014). Economists have noted that GDP is a flawed measure of economic welfare (Jones & Klenow, Citation2015). Leisure, inequality, mortality, morbidity, crime, and the natural environment are just some of the major factors affecting living standards and yet they are incorporated imperfectly, if at all, in the GDP measure (Fioramonti, Citation2014; Jones & Klenow, Citation2015). There is therefore a push under the rubric ‘Beyond GDP Movement’ to coerce countries to develop other measures of economic welfare that will complement the GDP measure. In 2000, world leaders from 189 countries gathered at the United Nations in New York and came up with the eight Millennium Development Goals that were designed to improve the global human condition (Costanza et al., Citation2009). These goals were based on a broad vision to fight poverty in its many dimensions (UN, Citation2015). This vision has been the overarching development framework for the world in the 15 years between 2000 and 2015 (UN, Citation2015). In addition to the Millennium Development Goals, there are other indexes that have been used to measure development and well-being, namely the Social Progress Index (SPI), Happiness Index, Human Development Index (HDI), and Quality of Life (QoL) index (see Costanza et al. [Citation2009] for detailed discussion of the measures). While these efforts have merit, they present critical challenges for African countries where GDP is widely used as the measure of development and where the use of other measures is hampered by lack of data. Sometimes institutional barriers such as lack of political will exist that force countries to stick to GDP as the only measure of economic progress. Where data are available, tools for manipulating that data in ways that give a holistic picture of the developmental status of countries may be lacking.
This article presents a tool, the Gauteng City-Region (GCR) Socio-Economic Barometer, for assessing developmental progress using 38 indicators across major sectors of the socio-economy. The tool is applied to Gauteng province of South Africa, in order to test its efficacy in presenting a holistic view of development. The tool shows how other indicators of well-being could be used to complement the GDP measure. The rest of the article is organised as follows: Section 2 summarises developmental challenges in South Africa, Section 3 discusses motivations and efforts around the Beyond GDP initiative, Section 4 gives the methodology of the Barometer, Section 5 discusses the data and data sources, Section 6 applies the Barometer to Gauteng province of South Africa and Section 7 concludes.
2. Development challenges in South Africa
South Africa is hard-pressed to raise living conditions, improve quality of life, and achieve permanently higher per-capita incomes for its people (The Presidency, Citation2011). The country faces a number of challenges such as: reducing income inequality, which is one of the highest in the world – a Gini coefficient of 0.69 (World Bank, Citation2012); lowering poverty rates among historically disadvantaged groups); fostering inclusive growth; and attaining social cohesion (The Presidency, Citation2011). The attainment of democracy in 1994 gave way to a new non-racial government that was committed to improving living conditions of previously disadvantaged groups, eliminating racial imbalances and creating a free society based on principles of justice and equal opportunities for all. Based on a non-racial constitution put in place in 1996, a series of policy interventions were formulated and implemented.
However, in spite of all the efforts by the government to improve people’s lives, concerns are rising – particularly from the poorer and marginalised sectors of society – that the government has not lived up to the vision set in 1994 (Managa, Citation2012). Results of QoL surveys conducted on Gauteng residents by the Gauteng City-Region Observatory (GCRO) in 2009, 2011, and 2013 reveal that, while access to basic services has increased, people’s satisfaction with the government, particularly at the local sphere, is waning. This disjuncture between levels of service delivery and people's satisfaction with the government raises questions about the quality of government services as well as the manner in which these services are delivered. It also indicates that service delivery alone is not enough to raise the quality of life but other factors such as uninterrupted service, affordability, jobs, a clean environment, and safety are also important.
Yet, in spite of all these challenges, South Africa has highest GDP in Africa. In 2014 it was ranked 33rd in the World Bank GDP rankings out of 193 countries. This means that South Africa has a very strong economy compared with other countries across the world (with a GDP of US$350 085 million). During the third quarter of 2015, Statistics South Africa (Stats SA) reported that the national nominal GDP at market prices was R1007 billion (or US$629 375 million). This translates to a per-capita GDP of R18 322 (or US$1145), based on the 2015 mid-year population estimate of 54.96 million.
The South African case demonstrates a high GDP is not a panacea for higher social and human well-being. There are cases of abject poverty in many parts of the country, high levels of income inequality, high crime rates, informal housing, poor water and sanitation facilities in informal settlements, racial tension, and mistrust. The GDP statistic alone for South Africa gives no clue of all this, warranting the need for more holistic measures of development that take into account other dimensions of well-being.
3. Beyond GDP
Measurement of developmental progress has commonly relied on the use of the GDP measure. However, recent trends and events such as the global financial crisis have shown that overreliance on GDP as a measure economic strength can be misleading (Daly & Posner, Citation2011). There is growing consensus that GDP: is an inappropriate measure to gauge progress (Fioramonti, Citation2014); is ‘inadequate’ as a traditional concept of growth (Daly & Posner, Citation2011:3); and is a flawed and poor instrument for measuring economic welfare let alone social progress (Daly & Posner, Citation2011; Jones & Klenow, Citation2015). While GDP serves the purpose for which it was designed (i.e. measuring the value of goods and services produced in the economy), critiques question how it has come to play ‘such a defining role in public debates about economic performance and social progress and ultimately in policy making’ (Daly & Posner, Citation2011:4). The strong emphasis on GDP by governments across the world is premised in widely accepted (but false) beliefs that more money means higher quality of life (Costanza et al., Citation2007). Empirical evidence now exists both in developing and developed worlds that growth in GDP does not imply increase in well-being or happiness (see Easterlin, Citation2003). Hence measurement of progress needs to be supplemented with other measures that focus on other aspects of human well-being (Fioramonti, Citation2014). Stiglitz and others, in a widely publicised report on the ‘Measurement of Economic Performance and Social Progress’, also concluded that the measurement of economic systems needs to shift from measuring economic production to measuring people’s well-being (Stiglitz et al., Citation2009).
Globally, the ‘Beyond GDP’ initiative advocates for the expansion of the national income measure in ways that account for income distribution, social well-being including poverty rates, literacy, life expectancy, decent work, human and public wealth, environmental sustainability, public attitudes on issues such as democracy, civil society, living conditions, levels of subjective well-being such as life satisfaction, feelings of security, and trusting one’s neighbour, among others (Vemuri & Costanza, Citation2006; Costanza et al., Citation2007; Abdallah et al., Citation2008; Daly & Posner, Citation2011; Fioramonti, Citation2014). Several indexes have emerged over the years in response to the inadequacies of GDP. These indexes include, inter alia, the HDI, Happiness Index, QoL index, SPI, and Genuine Progress Index. What these new measures suggest is that there are various aspects of welfare which impact people’s lives that ought to be considered instead of relying on a single measure. As Daly & Posner (Citation2011) argue, GDP has limitations when it comes to assessing income distribution, quality of goods or services produced, and economic sustainability. Important aspects of well-being such as poverty, literacy, and life expectancy and other aspects of subjective well-being such as life satisfaction, feelings of security, and trusting one’s neighbour cannot be inferred from the GDP measure.
Based on these shortcomings, it is therefore necessary to complement GDP with other measures when assessing a country’s welfare progress in order to avoid giving a false indication of well-being. For example, the rise in GDP for most countries in Africa is not consistent with the high levels of poverty, inequality, and misery that the poor are experiencing on the continent. The concern by countries in Africa to raise their GDP status has in many ways obscured not just the deeper needs of society but also the dire consequences of economic growth such as inequality and environmental degradation (Daly & Posner, Citation2011). As shown later, a high GDP alone does not imply well-being because alongside an impressive GDP figure can be seen a series of social ills that impact negatively on quality of life. Countries that focus on raising GDP may do so at the expense of other important life essentials such as a clean environment, and South Africa is a typical example of a greenhouse gas emitter.
The weaknesses of GDP highlighted do not call for the elimination of GDP as a measure but suggest a need to complement GDP with other indicators. It is against this backdrop that we introduce the GCR Socio-Economic Barometer, a tool that not only uses multiple indicators but presents these indicators in such a way that both the overall development picture and the sector-specific scenarios are shown simultaneously.
4. Methodology
The Barometer was developed at the GCRO, a government-initiated research institute based at the University of the Witwatersrand in Johannesburg. The GCRO was established in 2008 by the Gauteng Provincial Government (GPG) to assist in building a knowledge base that government, business, labour, civil society, and citizens need to shape appropriate strategies that will advance the GCR as a competitive, integrated, sustainable and inclusive city-region. The GCR Socio-Economic Barometer was identified as one of the research projects that could reflect upon development progress in Gauteng in a holistic manner. Through a composite picture, the Barometer is aimed at assisting the government to quickly and easily identify sectors of the economy that are performing well or are underperforming. The Barometer was designed to serve a threefold purpose: to assess the current state of development; to show progress over time; and to enable benchmarking with other provinces in the country or similar sized city-regions elsewhere in the world.
4.1. Conceptual framework
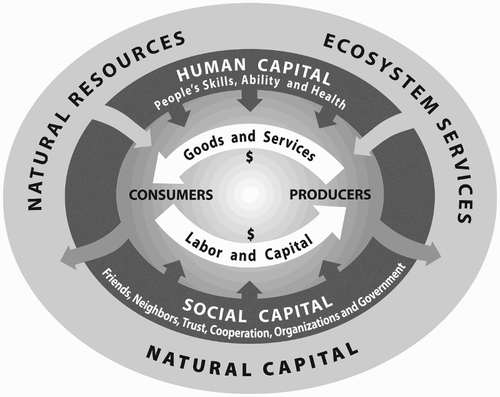
The GCR Socio-Economic Barometer falls in a class of indicators described by Costanza et al. (Citation2009) as Indicator Suites. Indexes such as the SPI, HDI, QoL index and even GDP are derived from a combination of several other variables that a manipulated to form a composite index. The Barometer does not attempt to summarise all of the variables into a single statistic to be used to reflect progress; rather, it pulls together a set of indicators in a way that shows the level and change in each indicator, each sector, and the overall economy simultaneously. The basic assumption here is that the economy is one single whole consisting of a number of distinct but interconnected parts. Based on Costanza et al. (Citation2009), these parts include the human economic system and the social and environmental system as shown in . The figure also shows how the component parts of the economy connect and interact with each other.
Figure 1. View of economy as part of a larger system. Source: Costanza et al. (Citation2009).
The Barometer does not attempt to show how the different parts interact and affect each other, but looks at the final outcome for each indicator and each sector. There are more complex methodologies for economy-wide analysis such as Computable General Equilibrium that show how changes in one sector may affect the rest of the economy, but these are beyond the scope of this article. The aim is to understand the state of the socio-economy at a particular point in time.
4.2. Standardisation of variables
Although South Africa has robust data collection systems, policy-makers and the general public find it difficult to discern the direction of development due to the existence of multiple variables from various data sources, variations in survey designs, and inconsistencies in how variables are defined. As such, comparison over time is almost impossible. In developing the Barometer, effort was made to standardise definitions and reconcile datasets to ensure accuracy and integrity of final data points. The indicators were also selected and standardised to allow for international benchmarking while taking account of local specifics; for example, race issues, social cohesion, and crime are pertinent to development in South Africa. This fits well with the EU Commission recommendation that indicators selected to supplement GDP need not just be clear and appealing but must include environmental and social aspects of progress as well.
The standardisation of definitions was also necessary given the local context of South Africa’s development. Development planning in South Africa since 1994 was a staged process. For example, the Reconstruction and Development of 1994 had two phases. Phase 1 was an interim measure designed to provide very basic services to communities that were historically disadvantaged and Phase 2 was meant to provide services of a much higher quality than Phase 1. A good example is water and sanitation, where Phase 1 guaranteed a communal standpipe while Phase 2 guaranteed an individual yard tape or piped water inside the dwelling. However, the data collection system used by Stats SA has retained the range of water and sanitation services framed under Reconstruction and Development Phase 1. For the purposes of the Barometer and in the interests of assessing government progress beyond Phase 1, we redefined access to water as ‘yard tape or piped water inside dwelling’. Similarly, under sanitation we redefined it as ‘flush or chemical toilet’ only, leaving out ventilated pit latrine and other inferior forms of sanitation. A similar process was followed for other indicators.
4.3. Choice of indicators
One of the critical challenges for Beyond GDP has been the existence of social and institutional barriers to better measures of progress. These barriers are primarily based on resistance to change and include the dominance of the ‘growth is good’ paradigm, lack of leadership, and the power of those with a vested interest in maintaining the status quo (Costanza et al., Citation2009). In designing the Barometer, it was clear how government’s willingness to pursue evidence-based planning and step up effective monitoring and evaluation of programmes can promote a Beyond GDP type of analysis of the economy. GPG realised the need for keeping track with development changes in the province and provided financial support for the development of the Barometer.
presents the list of indicators included in the Barometer. Ten specific sectors were identified and a set of 38 indicators (both objective and subjective) were selected to populate the respective sectors. This set was generated after extensive consultation with key stakeholders in government and academia. Meetings were held between academics in the GCRO and members of GPG’s Monitoring and Evaluation Department to discuss each indicator and decide on which to include or discard based on local and international best practice. In addition, major international documents that report on developmental progress were also consulted, including: The HDI (UNDP, Citation2013), Education for All Global Monitoring Report (UNESCO, Citation2014), Annual Report 2013 (UNICEF, Citation2013), Global Tuberculosis Report (WHO, Citation2013), World Bank Reports, United Nations Economic Commission for Africa, African Development Bank, and the Millennium Development Goals report.
Table 1. Indicators and measures.
The GCR Socio-Economic Barometer is not necessarily a composite index as is GDP. However, it has been designed such that, taken together, the indicators reflect on the status of the province yet allow for both sectoral analysis as well analysis of each indicator. Policy-makers are often presented with sectoral analytical reports that provide little of what is happening in other sectors. The GCR Socio-Economic Barometer is designed to reflect on developments across the entire socio-economic and political landscape of Gauteng, prompting policy-makers to think holistically. Other indexes such as the Social Vulnerability Index, Environmental Index, and Decent Work Index, while important, are so specific as to lose sight of developments in and or implications for other sectors. This has been the major weakness and criticism levelled against GDP as a measure of development.
The methodology of the GCR Socio-Economic Barometer is easily adaptable to any geographical scale provided data for the indicators are available at those levels. A list of indicators used in the analysis and the precise definitions for each are provided in Appendix 1.
5. Data, data sources, and the tool
Stats SA is the main source of official data in the country. They provide data on the economy, income and expenditure, and the labour market. They also conduct a General Household Survey annually, which provides key information on household access to infrastructure and basic services. Two private companies, Quantec and Global Insight, use Stats SA data to derive a number of measures and indexes which we have used, such as the Tress Index, Gross Fixed Capital Formation, HDI, Poverty Rates, and Gini coefficient. Other data sources include the South African Air Quality Information Systems, a specialised unit that generates data on air quality, the South African Police Service, the official source of crime statistics, the Department of Water Affairs on drinking water and wastewater quality, the Department of Health, Gauteng Department of Education, the Department of Basic Education, the Council for Higher Education, and the Independent Electoral Commission for data related to voters and voting patterns.
Data on most of the subjective indicators was drawn from the GCRO QoL Surveys for 2009 and 2011. QoL surveys are cross-sectional surveys conducted biennially by the GCRO and are comparable over time. The sample sizes for QoL surveys were 6639 and 17 289 for 2009 and 2011 respectively. Because QoL focuses on Gauteng province alone, it is the largest single living conditions survey in the country. A special sampling technique where Population Sampling Units (the 508 wards in the province) are broken down into small area layers was used to permit a balanced sample distribution across each ward. Probability proportional to size was then used to determine the distribution of population in each small area layer and every fifth stand was selected for interview. The final datasets were weighted according to Census figures to reflect the actual population distribution.
5.1. Data challenges
There were some data challenges which caused some important indicators to be dropped (e.g. lack of sufficient data points to cover the analysis period and the unavailability of data at provincial level). QoL surveys are biennial and started in 2009, and hence there were only two data points (i.e. 2009 and 2011) for the subjective indicators mostly under Safety and Security, Social Cohesion, and Governance sectors. These areas are key areas in the context of South Africa in general and Gauteng in particular because high crime rates, racial tension, and corruption are distinctive features of the Gauteng economy and impact directly on the economy and quality of life of residents. Given that QoL surveys will continue into the future, more data points will be available in future editions of the Barometer. Other data such as voter registration and voting patterns are only available for years during which elections were held.
5.2. The Barometer tool
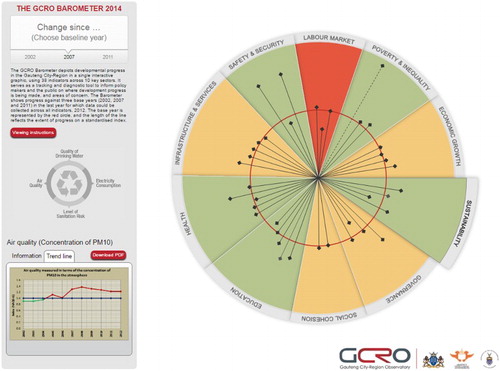
After considering all data constraints, the 38 indicators were identified and classified into 10 sectors. Although the number of indicators per sector varied, this was not an indication that some sectors were more important but that some sectors had more aspects to show than others. shows the various features of the Barometer. All of the indicators share a common origin and extend positively outwards to populate their respective areas.
Figure 2. Barometer visual. Source: Author.
5.3. The GCR Socio-Economic Barometer 2014
The first version of the Barometer released by the GCRO was the GCR Socio-Economic Barometer 2014. Three base years (i.e. 2002, 2007, and 2011) were used to benchmark progress in the current year (i.e. 2012). All variables were assumed to carry equal weighting and a simple index was generated for each of the 38 indicators across the entire period. The indexes were generated based on the three base years (2002, 2007, and 2011), thus reflecting relative progress. Using Excel, we generated a spoke chart which allowed us to plot the 38 indexes on a single chart and fit in a benchmark line (red circle with a value of 100) for assessing progress relative to the base year. Hence the 2012 values could be compared with values in 2002, 2007, and 2011. Where indicator lines extended beyond the red circle, this meant that there has been positive progress, while lines falling short of the red circle indicated a negative absolute change in the value of that indicator. A line extending to just touch the red circle indicated no change at all.
5.4. Analysis scale
In order to make inference to the level of changes, an average index was derived for each sector and for each year. The results were applied on a three-colour scale in order to classify the changes relative to the base years. The typology presented in was created.
Table 2. Key for interpreting the average indexes.
The Barometer was therefore designed in a way that identifies instantaneously the areas that are doing well and those that are not, while offering an opportunity to drill down into specific indicators to observe what is driving sector averages up or down for each year.
6. Case study: Gauteng province
Gauteng is the most populous province in South Africa with a population of over 12 million people (Stats SA, Citation2011). Population densities are extremely high, up to 675 people per km2 compared with a national average of 42. Gauteng is largely an urban area containing three metropolitan cities, namely Johannesburg, Tshwane (Pretoria), and Ekurhuleni, see . A large population coupled with a high rate of urbanisation makes it difficult for local governments to keep pace with service delivery needs in the face of high levels of poverty and inequality. Income inequality is very high for Gauteng by international standards (Gini coefficient of 0.63 in 2012).
Figure 3. Map of Gauteng province. Source: GCRO Maps/GIS.
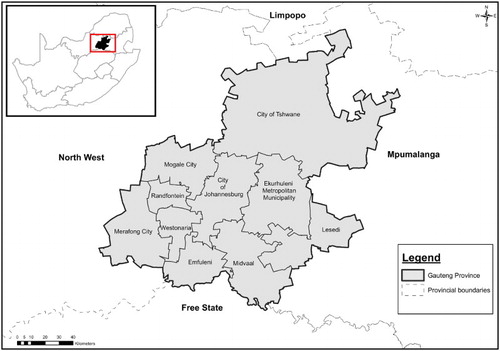
Although small in area, Gauteng serves as the country’s economic hub, generating about 34% of South Africa’s GDP (Kok, Citation1998; OECD, Citation2011). As such, in 2012 alone Gauteng contributed 35% to total national GDP.
6.1. Results for Gauteng
Since 2002, Gauteng has achieved significant progress in most areas. The province maintained its position as the economic powerhouse of South Africa. Year-on-year percentage changes in GDP were positive except for 2009 when the economy experienced negative growth due to the impact of the global financial crisis. GDP per capita was highest in the country despite a large population. Enormous potential for future growth exists given the expansion in Gross Fixed Capital Formation. The degree of industrial diversification is also quite high in relative terms.
Labour force participation rate was high but fluctuated over the analysis period, averaging 71% (Stats SA, 2002–12, 3rd Quarter Series). However, the participation rate dropped from 73.2% in 2008 to 70.0% in 2009 and has not improved much since then. Much of this decline is attributed to the loss of confidence in the labour market following enormous job losses caused by the impact of the global financial crisis (Everatt et al., Citation2009). Unemployment was at its lowest in 2007 at 17.9% before rising to a peak of 27.8% in 2011 (Stats SA, 2002–12, 3rd Quarter Series). The drop by 3 percentage points in 2012 relative to 2011 indicates a recovery from the global financial crisis. Employment numbers for 2012 rose to levels prior financial crisis.
The HDI rose from 0.67 in 2002 to 0.74 in 2012 while the poverty rate fell dramatically from 10.4% to 1.7% over the same period (Global Insight, Citation2012). A number of factors were instrumental in effecting this dramatic improvement: expansion in the roll out of social grants; income growth; above-inflation wage increases; decelerating inflationary pressures; and expansion of credit (Stats SA, Citation2014). Income inequality remains extremely high (the average Gini coefficient is 0.60 for the period 2002–12). However, income distribution improved marginally from a Gini coefficient of 0.65 in 2002 to 0.63 in 2012 (Global Insight, Citation2012). Poverty and inequality are major defining features of the South African society and not just Gauteng alone (Stats SA, Citation2014).
Based on General Household Survey data, access to basic services such as water, sanitation, and electricity improved significantly over this period and an average of 75% of households across Gauteng lived in formal dwellings. However, here the number of backyard dwellings is increasing, indicating a deficit in the housing sector (GCRO, Citation2014). However, there are significant distortions in the housing sector where some poor households are allegedly trading their formal houses for cash, preferring to live in informal dwellings (Charlton, Citation2014). This trend is indicative of the underlying structural problems in the economy reflected in high-income inequality and high unemployment. Communication improved phenomenally as access to landline and cellular telephones rose from 59.2% in 2002 to 96.3% in 2012, mainly due to a rise in the usage of cellular telephones (Stats SA, General Household Survey, 2002–12; Stats SA, Citation2014).
Crime statistics indicate a higher degree of success in fighting crime in Gauteng. Murder rates fell from 49 cases per 100 000 people in 2003 to 24 cases per 100 000 people in 2012, resulting in a 51% reduction (SAPS, Citation2012b). Although sexual crimes are still very high (an average of 140 crimes per 100 000 inhabitants), the outlook is positive given a decline from 174 cases per 100 000 inhabitants in 2008 to 99 in 2012 (SAPS, Citation2012b). However, people’s perceptions of safety have waned. Only 59% of respondents in the GCRO QoL survey felt safe or very safe walking in their neighbourhood after dark in 2011, compared with 65.2% recorded in 2009. The South Africa Police Service has become proactive towards crime prevention through community awareness campaigns, visible policing strategies, and other programmes such as Victim Empowerment and Domestic Violence Programmes (SAPS, Citation2012a). These measures are expected to lower people’s perceptions of crime. Crime data always represent reported crime and as such are in most cases an underestimate because some crimes go unreported. However, trends in reported crimes show high levels of detection by police and hence an improvement. What remains unknown is the level of conviction that forces perpetrators of crime to be punished for their offences.
Life expectancy rose from 56 years in 2002 to 60 years in 2012 while infant mortality fell significantly from 46 to 24 deaths per 1000 births, and maternal mortality fell from 141 to 116 per 100 000 (HST, Citation2012). The incidence of tuberculosis in South Africa is one of the highest in their world. However, tuberculosis cure rates for Gauteng were impressive, rising from 57.7% in 2002 to 78.2% in 2012 (HST, Citation2012). Sadly, the HIV prevalence rate among antenatal women remains very high (an average of 30%), with only a marginal reduction of 3 percentage points occurring between 2002 and 2012 (HST, Citation2012).
In the education sector, the net enrollment ratio (NER) for primary schools fell from 89% in 2002 to 81% in 2012 while the learner–educator ratio remained stable at an average of 35 (GDE, Citation2011). The Matric pass rate rose from 78.1% in 2002 to 84% in 2012 (DBE, Citation2014). In higher education, university graduates in science and technology increased remarkably from 12 048 in 2002 to 20 178 in 2012, an increase of 67.5% (DHET, Citation2012). The adult literacy rate also rose from 80.5% in 2002 to 97.0% in 2012.
In terms of governance, a high proportion of people in Gauteng felt that corruption is the greatest threat to democracy (84.2% of respondents in 2011 compared with 58.5% in 2009). In spite of the increase in the roll out of basic services, the level of satisfaction with services fell from 95.5% in 2009 to 76.2% in 2011(GCRO QoL, Citation2011). On the other hand, citizen participation in local government elections increased from to 42% in 2002 to 56% in 2011 (IEC, Citation2012). However, the registration rate for the voting-age population fell by 1.6 percentage points from 69% in 2002 to 67.4% in 2011 (IEC, Citation2012).
The quality of Gauteng’s drinking water scored 98.1% in 2012 on the Blue Drop Index, which is a significant improvement from 74.4% in 2009 (DWA, Citation2012a). However, there are challenges with regard to wastewater. The Green Drop Index fell from 78.8% in 2011 to 62.8% in 2012 (DWA, Citation2012b). Air quality was assessed on the basis of the concentration of PM10.Footnote1 The National Air Quality Standard is set at 1, where values >1 indicate poor air quality and values <1 indicate good air quality. Results show that air quality in Gauteng is relatively poor. This can be explained by the presence of heavy industries and a large vehicle population. On the other hand, electricity consumption fell from 5.72 MWhFootnote2 per capita in 2002 to 4.76 in 2012 and this reduction is attributed mainly to changes in use behaviour and the high cost of electricity (Stats SA, Citation2012).
6.2. Changes over time
shows the developmental status in Gauteng in 2012 relative to the three base years 2002 (Slide 1) 2007 (Slide 2), and 2011 (Slide 3).
Figure 4. Changes over time. Slide 1: Change since 2002; Slide 2: Change since 2007; Slide 3: Change since 2011; Slide 4: Average Index per year. Source: Author.
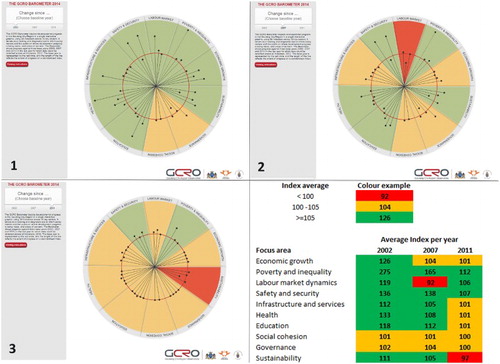
Over the 10-year period, there are indications that there have been significant improvements in all sectors. However, based on an analysis of available official data, a number of have worsened since 2002, namely air quality, public opinion on service delivery, NER for primary schools, and safety and security. Overall, there are challenges in the areas of social cohesion and governance because these sectors showed no improvement. There was a dramatic reduction in the poverty rate which is explained by the successful roll out of the social grant programme. Slide 2 in Figure 4 shows GCR status in 2012 relative to 2007. Here we see a higher number of sectors experiencing no change compared with a situation where 2002 is the base year. The social cohesion and governance sectors showed little or no change, with the infrastructure and services and the economic growth sectors also slowing down. The labour market was the worst affected with the overall change between the two years shown as negative. This signifies the sensitivity of the labour market to both long and short-term economic shocks including the global financial crisis. The reduction in the poverty rate remains significantly high. Slide 3 shows change over a space of one year. Nearly all sectors show no change. Sustainability has declined while the safety and security and the poverty and inequality sectors show positive change. Overall, there appears to be little positive change over short time spans.
7. The Barometer and South Africa’s development
South Africa faces a number of challenges related to human development, in particular poverty, income inequality, and crime. These issues can hardly be discerned from analysing GDP alone. The GCRO Barometer, by pulling together indicators from various sectors, gives a much fuller picture of development. It also allows one to focus on headspace issues such as people’s attitudes towards service and their neighbourhoods, adding to the tone of the nature of development in the country. Moreover, the GDP statistics for South Africa give no clue, warranting the need for more holistic measures of development that take into account other dimensions of well-being than just GDP. The GCRO Barometer approach is a more integrated approach of exposing development challenges in South Africa.
8. Conclusion
Looking beyond GDP in measuring development progress particularly in the countries of the south is imperative. It is easy for governments to be pre-occupied with raising their GDP status by encouraging growth and investment at the expense of the environment, poverty, inequality, and other aspects of human well-being. While GDP is such an important measure of economic activity, an understanding of broader issues of well-being is essential. Although consensus has built around the need to complement GDP with other measures, innovative ways of presenting multiple indicators in ways that convey the direction of development are also needed. The Barometer is one alternative for depicting development progress across sectors and across time while paying particular attention to changes in individual indicators. The GCR Socio-Economic Barometer presented here provides an opportunity for analysing, comparing, and presenting changes across various aspects of the economy and human well-being simultaneously. It brings to the attention of policy-makers areas that require urgent attention and how positive expansion in one area may be associated with negative changes in others. The Barometer offers an opportunity to think holistically about the socio-economy.
Applied to Gauteng province of South Africa, the Barometer revealed challenges in a number of sectors such as social cohesion, governance, and sustainability, on one hand, while showing a strong economy in GDP terms on the other. There was also shown very little positive change over shorter time spans, which is a concern given the five-year local government electoral cycle in South Africa and rapid changes in policies. It is therefore imperative for policy-makers to design programmes that have greater impact in the short term. Needy communities find it difficult to wait longer to experience benefits of development, hence the high rates of service delivery protests (Nyar & Wray, Citation2012). When government policies and programmes take a long time to mature, or when service delivery is not maintained at a high level, society develops negative attitudes towards government, loses interest in public affairs, and ceases to participate in civic forums where residents’ voices can be heard by elected representatives. This results in further alienation and exclusion from the benefits of development and eventually polarisation as shown by indicators under social cohesion and governance.
These results and conclusions could not have been possible if developmental analysis centred solely on GDP. The GCR Socio-Economic Barometer has shown that, juxtaposing GDP with other indicators of well-being, yields a holistic picture of the economy and generates better insights into the real state of the socio-economy. The Barometer methodology is adaptable to any sphere of government or country and indicators can be adjusted as necessary.
Finally, developing a multiple indicator barometer such as this requires that data are available for all of the indicators for the period being analysed. Given that the data required do not come from a single source, updating the Barometer annually is a challenge. Data collection is too costly and most African countries cannot afford to carry our surveys on an annual basis. This is the major hindrance to moving beyond GDP in measuring development in the continent.
Acknowledgements
The author is grateful for comments received from Lorenzo Fioramonti, Professor of Political Economy at the University of Pretoria (South Africa) and founding director of the Centre for Governance Innovation (GovInn) at the University of Pretoria (South Africa). The GCRO Barometer was presented at the Beyond GDP conference organised by GovInn in September 2014. The author is also grateful to participants at this conference for their invaluable feedback.
Disclosure statement
No potential conflict of interest was reported by the author.
Notes
1 PM10 refers to particulate matter of up to 10 μm in size that are floating in the atmosphere.
2 Megawatt hour.
Related Research Data
References
- Abdallah, S, Thompson, S & Marks, N, 2008. Estimating worldwide life satisfaction. Ecological Economics 65, 35–47. doi: 10.1016/j.ecolecon.2007.11.009
- Charlton, S, 2014. Public housing in Johannesburg. In Harrison, P, Gotz, G, Todes, A & Wray, C, (Eds.), Changing space, changing city: Johannesburg after Apartheid. Wits University Press, Johannesburg, 176–93.
- Costanza, R, Fisher, B, Ali, S, Beer, C, Bond, L, Boumans, R, Danigelis, NL, Dickinson, J, Elliott, C, Farley, J, Gayer, DE, MacDonald Glenn, L, Hudspeth, T, Mahoney, D, McCahill, L, McIntosh, B, Reed, B, Rizvi, SAT, Rizzo, DM, Simpatico, T & Snapp, R, 2007. Quality of life: An approach integrating opportunities, human needs, and subjective well-being. Ecological Economics 61, 267–76. doi: 10.1016/j.ecolecon.2006.02.023
- Costanza, R, Hart, M, Posner, S & Talberth, J, 2009. Beyond GDP: The Need for New Measures of Progress. The PARDEE PAPERS / No. 4 / January 2009. Boston University.
- Daly, L & Posner, S, 2011. Beyond GDP: New measures for a New Economy. Dēmos, New York.
- DBE (Department of Basic Education), 2014. Education statistics in South Africa 2012. National Department of Basic Education, Pretoria.
- DHET, 2012. Department of Higher Education and Training, Higher Education Management Information System (HEMIS) and Council for Higher Education (CHE) statistics.
- DWA (Department of Water Affairs), 2012a. The Blue Drop Report, 2012. Blue drop certification – drinking water service regulation. National Department of Water Affairs, Pretoria.
- DWA (Department of Water Affairs), 2012b. The Green Drop Report. Progress Report 2012. Green Drop Certification – Waste water service regulation. National Department of Water Affairs, Pretoria.
- Easterlin, RA, 2003. Explaining happiness. Proceedings of the National Academy of Sciences 100, 11176–11183. doi: 10.1073/pnas.1633144100
- Everatt, D, Gotz, G, Phakathi, S & Makgetla, N, 2009. Benchmarking the way cities and regions around the world are responding to the global recession. GCRO Occasional Paper No.1 August 2009.
- Fioramonti, L, 2014. How moving beyond GDP may help fight poverty in Africa. Policy Brief. CROP.
- GCRO, 2011. Quality of Life Survey, SPSS data.
- GCRO, 2014. Backyard housing in the GCR. GCRO Vignette No. 16. Gauteng City-Region Observatory Publications.
- GDE (Gauteng Department of Education, 2011. Annual Report 2009/2010. Gauteng Department of Education, Johannesburg.
- Global Insight, 2012. Development indicator, data dump, 2002–2012 Series.
- HST, 2012. Health systems trust recently updated indicators series.
- IEC (Independent Electoral Commission), 2012. Independent Electoral Commission – Election Results.
- Jones, CI & Klenow, PJ, 2015. Beyond GDP? Welfare across Countries and Time. Stanford University and NBER Working Paper Version 4.0 April 20, 2015.
- Kok, P. (Ed.), 1998. South Africa's magnifying glass: A profile of Gauteng Province. Human Science Research Council (HSRC), Pretoria.
- Managa, A, 2012. Unfulfilled promises and their consequences: A reflection on local government performance and the critical issue of poor service delivery in South Africa. Africa Institute of South Africa (AISA) Policy Brief No. 76.
- Nyar, A & Wray, C, 2012. Understanding protest action: Some data collection challenges for South Africa. Transformation: Critical Perspectives on Southern Africa 80, 22–43. doi: 10.1353/trn.2012.0050
- OECD, 2011. OECD territorial reviews: The Gauteng City-Region, South Africa 2011. Organisation for Economic Co-operation and Development, Paris.
- SAPS (South African Police Service), 2012a. Annual Report 2011/12. South African Police Service, Pretoria.
- SAPS (South African Police Service), 2012b. Crime Statistics 2002–2012 series. South African Police Service, Pretoria.
- Stats SA (Statistics South Africa), 2011. National Census, 2011. Statistical release (Revised) P0301.4 Statistics South Africa, Pretoria.
- Stats SA (Statistics South Africa), 2012. Electricity generated and available for distribution (Preliminary). Statistical release P4141 December 2012. Statistics South Africa, Pretoria.
- Stats SA (Statistics South Africa), 2014. Poverty Trends in South Africa: An examination of absolute poverty between 2006 and 2011. Statistics South Africa, Pretoria.
- Stiglitz, JE, Sen, A & Fitoussi, JP, 2009. Report by the Commission on the Measurement of Economic Performance and Social Progress.
- The Presidency, 2011. National Development Plan. Vision for 2030. National Planning Commission. The Presidency, Pretoria.
- UN (United Nations), 2015. The Millennium Development Goals Report 2015. United Nations, New York.
- UNDP, 2013. Human development report 2013: The rise of the South – Human progress in a diverse world. United Nations Development Programme, New York, USA.
- UNESCO, 2014. Education For All Global Monitoring Report 2013/4: Teaching and learning – achieving quality for all. United Nations Scientific and Cultural Organisation, Paris, France.
- UNICEF, 2013. Annual Report 2012: South Africa. United Nations Children’s Fund (UNICEF), South Africa.
- Vemuri, AW & Costanza, R, 2006. The role of human, social, built, and natural capital in explaining life satisfaction at the country level: Toward a National Well-Being Index (NWI). Ecological Economics 58, 119–133. doi: 10.1016/j.ecolecon.2005.02.008
- WHO, 2013. Global Tuberculosis Report 2013. World Health Organisation, Geneva, Switzerland.
- World Bank, 2012. South Africa economic update: Focus on inequality of opportunity. The International Bank for Reconstruction and Development. The World Bank, Washington.
Appendix 1. Precise definition of indicators as used in the analysis
Gross Domestic Product – total output of goods and services for final consumption use.
Per-capita GDP – GDP divided by total Gauteng population.
Gross fixed capital formation – the net increase in physical assets.
Tress Index – level of concentration or diversification in economy (0 = total diversification and 100 = very high concentration).
Human Development Index – index to assess comparative levels of development between countries, quantified in terms of literacy, life expectancy, and GDP per capita.
Gini coefficient – a measure of income distribution (0 = perfect equality; 1 = inequality).
Poverty rate – the percentage of the population below the international poverty line of $2.00 day.
Labour force participation rate – proportion of working-age population that is either employed or unemployed.
Unemployment rate (strict definition) – percentage of labour force without jobs.
Total number employed – persons aged 15–64 years who, during the reference week, did any work for at least an hour, or were temporarily absent from work.
Number of cases of murder per 100 000 inhabitants – number of people who lose their life through deliberate acts of others.
Safety of neighbourhoods – percentage of population aged 18 and older who felt unsafe or very unsafe to walk in the area at night.
Total sexual crimes – total sexual crimes per 100 000 inhabitants.
Access to piped water – proportion of households with piped water inside dwelling or inside yard.
Sanitation access – proportion of households with access to flush or chemical toilet.
Energy use – proportion of household who use electric energy for lighting.
Dwelling type (formal) – the proportion of households with formal housing.
Communication (landline/cellular telephone access) – proportion of households with land line or cellular telephone.
Life expectancy at birth – average number of additional years a new born infant will live if current mortality trends were to stay for the rest of that person's life.
Infant mortality rate (IMR) – number of deaths of infants younger than one year old in a given year per 1000 live births in the same year.
Maternal mortality rate (MMR) – number of women who die from childbearing, during the pregnancy, or within 42 days of delivery or termination of pregnancy, per 100 000 live births during that year.
Cure rate (tuberculosis) – percentage of patients proven to be cured using smear microscopy at the end of treatment.
HIV prevalence – percentage of antenatal women who tested HIV-positive
Net primary school enrolment (NER) – ratio of children of the official primary school age who are enrolled in primary school to the total population of the official primary school age.
Learner–educator ratio (LER), primary school – the average number of learners per educator at primary level in a given year.
Matric pass rate – percentage of candidates who sat for National Senior Certificate examinations that achieved either 40 or 30% in at least six subjects.
Science and technology graduates – percentage of university graduates with degrees in science, engineering, and technology from institutions of higher learning.
Adult literacy – percentage of population aged 15+ with no difficulty or some difficulty in reading and writing.
Membership of voluntary organisations – percentage of population aged 18+ that participates in the activities of organisations of a voluntary nature.
Public opinion on race relations – percentage of GCR population aged 18+ which agrees or strongly agrees that ‘blacks and white will never trust each other’.
Corruption perception – percentage of GCR population aged 18+ which agrees or strongly agrees that ‘corruption is the main threat to our democracy’
Public opinion of service delivery – percentage population aged 18+ that say they are ‘satisfied’ or ‘very satisfied’ with delivery of local government services.
Voter Age Population (VAP) registered – total number of people eligible to vote that is registered to vote.
Voter turnout – the proportion of registered VAP that turned out to vote in the last municipal elections.
Drinking water quality – composite score measuring compliance of water suppliers with water quality management requirements.
Sanitation risk – composite index measuring the ability of municipalities to identify and abate the risks that presents adverse impact on health and environment.
Air quality – index measuring the level of concentration of PM10 in the atmosphere recorded at all stations.
Electricity consumption – total consumption of electricity per capita.