
ABSTRACT
An Africana feminist framework is presented that considers the ways in which inequality resulting from a historical legacy of political conflict and other dimensions intersect to impact upon the accomplishment of Millennium Development Goals with regards to environmental sustainability and child malnutrition in Zimbabwe. Demographic and Health Surveys are analysed from 1988 to 2011 to examine whether differential access to water and sanitation is predicted by ethnic differences in Zimbabwe, and is predictive of chronic malnutrition. Safe water and sanitation are in short supply, and logistic regression analyses provide evidence that residents in Shona and Ndebele-dominated provinces generally have better access to these resources. Uneven distribution of these development resources has a deleterious impact on early childhood nutrition. This work elicits results that give rise to child health-related policy recommendations that may inform post-2015 discussions of Sustainable Development Goals, namely that within-country ethnic differences must be taken into account.
1. Introduction
The United Nations Millennium Declaration’s Millennium Development Goals (MDGs) called for reductions in extreme hunger and poverty, reductions in maternal and infant mortality, improvements in access to water and sanitation, and promotion of gender equality and empowerment of women, among other goals, between 1990 and 2015. This effort was spearheaded in the early 2000s by former Minister of Health in Mozambique, Dr Francisco Songane (Horton, Citation2006). MDGs are ‘a mechanism to improve accountability, reenergize commitment’ (Gillespie, Citation2003:327) and recognise successes that include 19 indicators of progress (United Nations, Citation2006).
There are aspects of two synergistic MDGs in particular that are the focus in this article:
(Goal 1) Eradicate extreme poverty and hunger, and in particular, Target 2 to halve between 1990 and 2014, the proportion of people who suffer from hunger, as indicated by (4): prevalence of underweight children under five years of age (UNICEF-WHO). (United Nations Statistics Division Citation2014a)
(Goal 7) Ensure environmental sustainability, and in particular, Target 10 to halve by 2015 the proportion of people without sustainable access to safe drinking water and basic sanitation, as indicated by (30): proportion of population with sustainable access to an improved water source, urban and rural (UNICEF-WHO), and (31): proportion of population with access to improved sanitation, urban and rural (UNICEF-WHO). (United Nations Statistics Division Citation2014a)
The Republic of Zimbabwe excelled in meeting MDGs with regards to gender parity in primary and secondary education (United Nations Statistics Division, Citation2014a) and adult literacy (UNESCO Institute for Statistics, Citation2013); however, many factors have essentially remained constant or got worse. The percentage of households in urban and rural areas with improved drinking water and improved sanitation has decreased slightly from 1990 to 2012 (United Nations Statistics Division, Citation2014a). Infant and child mortality rates have not improved from 1990 rates (United Nations Statistics Division, Citation2014a). Stunting, reflecting chronic malnutrition among young children, has increased above the percentage in 1990 (UNESCO Institute for Statistics, Citation2013). presents an overview of these changes.
Table 1. Overview of selected MDG indicators and targets, Zimbabwe 1990–2013.
In this article, Zimbabwe’s challenges in meeting MDGs are examined. The Zimbabwe Demographic and Health Surveys (ZDHSs) for 1988, 1999, 2005/06, and 2010/11 are analysed. Discussion addresses lessons from Zimbabwe that provide recommendations for Sustainable Development Goals in the post-2015 era.
The lens of Africana feminist studies, as an important branch of and often even a corrective to critical postcolonial studies (Imam et al., Citation1997), facilitates addressing the social context of health and illness among women and children in Zimbabwe as well as unveiling the underlying social structures within which health, illness, and healing occur from 1988 through 2010/11. The Africana feminist methodology utilised has three main features (for details see Zerai & Banks, Citation2002; Zerai, Citation2014). This methodology takes into account context and relational differences, and produces an intersectional analysis. In the following, features of the social, political, and historical context in which child health has occurred in Zimbabwe during its first decade of independence until recent times are examined. In explaining this context, the role of the state in direct and structural violence and other inequalities are described. The quantitative analysis examines relational differences; that is, how resources accrued to privileged groups directly relate to the withdrawal of resources from other groups. Specifically, the analysis interrogates Shona and related Ndebele resource allocations. In the quantitative analysis, Africana feminist methodology inspires intersectional analysis, which is framed as the examination of simultaneous and multiplicative categories of ethnicity, urbanicity, and region. The specific aims of this article are to examine differential access to water and sanitation by ethnolinguistic and regional differences, and further to analyse the impact of access to water and sanitation on early childhood morbidity.
2. Literature review and structural inequality as a context in Zimbabwe
Arguably, structural inequality is endemic in Zimbabwe. An Africana feminist analysis helps us to see that this inequality is evident in three realms. It is evident historically, in terms of ethnic differences that were exploited by the state and exacerbated by the practice of using violence to settle political differences (Campbell, Citation2003). It is evident today because those ethnic differences are reified by the inequitable distribution of development resources (Zerai, Citation2014). Finally, inequality between elite Zimbabweans and the rest of the citizenry is evident, resulting from corruption and the systematic withdrawal of resources, which could have been devoted to building up Zimbabwe’s infrastructure. Davies (Citation2004) argues that several events have contributed to the emptying of the coffers for social development resources for the citizens of Zimbabwe, including the 1997 payments to war veterans, the 1998 Democratic Republic of the Congo engagement, and 2002 land reform, each leading to personal wealth acquisition to compliant elites within Zimbabwe:
The real costs of the ‘personal wealth acquisition’ project have been imposed on ordinary Zimbabweans in terms of economic decline and foregone growth. … It appears that previously accumulated capital has been destroyed or, in effect, converted into private wealth. This has happened largely with the blessing of the government. … And this has created the environment in which self-privileging individuals are able to appropriate the language of nationalism and anti-imperialism for self-aggrandisement. (Davies, Citation2004:39–40)
Inequitable distribution of development resources (Zerai, Citation2014; Murambadoro, Citation2015), theft of country assets by elites (Campbell, Citation2003; Davies, Citation2004), violence from the military and police turned against the people of Zimbabwe for political ends (Campbell, Citation2003), and the withdrawal of a safety net for the country’s most vulnerable citizens (Osirim, Citation2003) constitute a web of structural inequality in Zimbabwe that affects women and children. In this article, structural inequality in the form of lack of access to development infrastructure and its effects on child health are examined.
2.1. Violence, Gukurahundi, ethnic tensions, and differential access to development infrastructure
A defining moment forecasting the differential access to water and sanitation for various regions of the country is the Gukurahundi from 1980 to 1987. A direct assault against people living in Matabeleland and Manicaland, through political destabilisation and repression of these regions of the country (Catholic Commission for Justice and Peace in Zimbabwe, Citation2007), reportedly as many as 20 000 died (Campbell, Citation2003). Violence during the ‘Matabeleland rebellions’ aka Gukurahundi from 1980 to 1987 set the stage for maldistribution of development resources in Zimbabwe in contemporary times (Zerai, Citation2014). In addition to political differences, ethnicity was used to exacerbate conflict and promote persistent inequalities. Violence during 1980–87, especially in Matabeleland North and South, was due to both dissident activity and state repression (Kriger, 2003). The repression of these areas resulted in slower than expected improvements in infant mortality in affected regions (Zerai, Citation2014:35–7). For example, the Zimbabwe government instituted a food curfew in Matabeleland South from February through April 1984 to ‘starve out’ the rebels. These months coincided with the seasonal peak hunger, when children and the elderly are especially vulnerable. Because the insurgents’ backing reportedly came from South Africa, the Zimbabwe government defended their actions by stating that they were attempting to sever the rebels’ access to this outside intervention. The result of the curfew and cuts in government food subsidies to Matabeleland South during the early to mid 1980s caused malnourishment and even starvation for the citizens of the region (Catholic Commission for Justice and Peace in Zimbabwe, Citation2007). These citizens were depending on government food subsidies at the time because of the concurrent drought. During the drought in Matabeleland South, there was international criticism regarding the treatment of those living in the regions under curfew. Zimbabwe immediately lifted the curfew in Matabeleland South when the US Congress threatened to withhold a shipment of corn (Catholic Commission for Justice and Peace in Zimbabwe, Citation2007). Systematic starvation of this and other communities may have precipitated long-term effects on child morbidity.
Taking a look at political events in Zimbabwe, many have affected inequality as already noted. The effects of the Economic Structural Adjustment Programme (Moyo et al., Citation2000), land reform and impact of subsequent European Union and US sanctions (Davies, Citation2004), Operation Restore Order in 2003 (Tibaijuka, Citation2005), and pre and post-election violence (U.S. State Department, Citation2009) include multiple losses of limbs and life, displacements, losses of livelihood, and diversion of civilian resources (U.S. State Department, Citation2009) that impair the health and well-being of the people of Zimbabwe. ‘Human rights violations [include] violence and discrimination against women; trafficking of women and children; discrimination against persons with disabilities, ethnic minorities, (and others); harassment and interference with labor organizations; child labor; and forced labor … ’ (U.S. State Department, Citation2009). The opportunity for Zimbabwe state to better serve its citizenry and to reach the MDGs that the government agreed to almost two decades ago has been severely undercut by direct violence and structural inequality in Zimbabwe.
3. Growth faltering, morbidity, and early childhood malnutrition: a conceptual model
Hunger in Africa, even in places that are plagued with drought, is avoidable. Zimbabwean feminist scholar Professor Rudo Gaidzanwa (Citation2009) advises setting aside food reserves to prepare for the possibility of drought. However, some families in Zimbabwe are not able to provide proper nutrition for their young children, as shown in the following. The main causes of chronic malnutrition in Zimbabwe are proximate determinants such as nutrient availability and household contamination, background characteristics such as rural / urban residence and socio-economic status, and distal determinants such as resources made available to communities and within states (Zerai, Citation2014). Drought, a breakdown in drought feeding programmes, financial crisis, high unemployment, and poverty are all factors that impact nutrient availability. A lack of access to health care is another problem that directly contributes to stunting, because monitoring of children’s physical and mental conditions by health care professionals cannot happen if obtaining services is problematic (Zerai, Citation2014). However, the focus of this article is the impact of environmental contamination on early childhood morbidity. Connections between unsafe water and poor sanitation and child morbidity are explained as operating through environmental contamination and the mechanism of environmental enteropathy.
3.1. Environmental contamination
A proximate determinant of chronic malnutrition is environmental contamination. One dominant feature of child health in Africa and elsewhere is that lack of access to clean drinking water leads to many preventable diseases and death. Such a lack of access is affected by a multitude of factors, including breakdown in infrastructure, leading to unreliable piped water sources; drought, leading to inadequate water supply; inadequate sanitation services, leading to contamination of freshwater sources; and floods and climate variability, leading to disastrous water events (Kundzewicz, Citation2013). Sub-Saharan Africa, and Zimbabwe in particular, is located in a zone that is subject to unpredictable climate variability (Kundzewicz, Citation2013).
The work of Jean Humphrey, Johns Hopkins researcher and professor of international health, is helping us to better understand the import of physical environment to child health. She states that:
a key cause of child undernutrition is a subclinical disorder of the small intestine known as tropical enteropathy, … caused by fecal bacteria ingested in large quantities by young children living in conditions of poor sanitation and hygiene. … Provision of toilets and promotion of handwashing after fecal contact could reduce or prevent tropical enteropathy and its adverse effects on growth. … The primary causal pathway from poor sanitation and hygiene to undernutrition is tropical enteropathy and not diarrhea. (Humphrey, Citation2009:1)
Smith and her colleagues find that environmental enteropathyFootnote1 predicts stunting, a sign of chronic malnutrition (Smith et al., Citation2013). In a presentation at the Safe Global Water and Sanitation Summit in Arusha, Tanzania, Griffiths (Citation2013) linked Smith et al.’s (Citation2013) findings to the importance of safe water and sanitation, indicating that living environments may impede benefits of improved nutritional intake. Griffiths (Citation2013) explained that environmental enteropathy results from farmers working in contaminated fields, children eating contaminated foods, and infants breastfeeding from mothers who have eaten contaminated foods.
In her work, Humphrey (Citation2009) shows that undernourished children with an abnormal gut microbiome ‘produced marked weight loss’. The abnormal microbiomes, researchers found, stay the same even if better food is provided. Poor sanitation and hygiene plus faecal contamination in the domestic environment altered the intestinal bacteria.
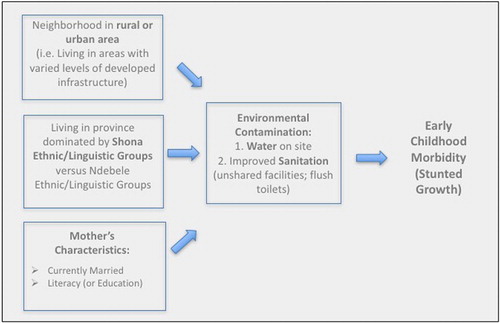
For these reasons, this article focuses on the impact of environmental contamination, operationalised as access to water and sanitation, as a key explanatory link to child health. The conceptualisation that a historical legacy of ethnic/political conflict in Zimbabwe has deleterious effects on equitable distribution of safe water and improved sanitation with resulting effects on child health is examined. The conceptual model is shown in . Focusing on water and sanitation, the model traces the effect of environmental contamination on early childhood growth faltering. The model, built from the Mosley & Chen (Citation1984) proximate determinants framework and modified appropriately, takes into account within-country inequalities, including those emanating from living in rural versus urban areas, and ethnic differences. It also takes mother’s characteristics (namely, marital status and literacy or completed primary education) into account.
Figure 1. Conceptual model.
4. Methodology
Data from the ZDHS for 1998, 1999, 2005/06, and 2010/11 are analysed. Separate nationally representative samples of childbearing-aged women (age 15 to 49) are interviewed in each data set. (For more information on the ZDHS, please see Zimbabwe Central Statistical Office & Demographic and Health Surveys, Citation1989; Zimbabwe Central Statistical Office & Macro International Inc., Citation2000, Citation2007; Zimbabwe National Statistics Agency & ICF International, Citation2012). The following hypotheses are examined:
Water and sanitation resources are in short supply throughout Zimbabwe. Consistent with the literature on the impact of payouts to veterans in 1997 and the subsequent stock market crash, in households with childbearing-aged women improved water and sanitation decreased overtime or essentially remained stagnant from 1988 until 2010/11. Because of economic recovery efforts, improved water and sanitation may have improved overall nationally, but have not much surpassed 1988 access levels in young children’s households. Descriptive analyses provide information on availability of water and sanitation resources to households with childbearing-aged women in 1988, 1999, 2005/06, and 2010/11.
Improved water and sanitation resources are concentrated in urban areas. Descriptive analysis provides information on access to improved water and sanitation resources in urban versus rural areas. Chi-square and logistic regression provide results to examine whether differential access is statistically significant.
Improved water and sanitation resources are concentrated in Shona areas of the country. This reflects structural inequality. Descriptive analysis provides information on access to improved water and sanitation resources in Shona-dominated versus non-Shona-dominated regions of the country. Chi-square and logistic regression provide results to examine whether differential access is statistically significant.
The effect of living in urban areas and Shona regions on access to clean water and improved sanitation is simultaneous. Guided by Africana feminist methodology, statistical analyses explore the effect of living in urban areas and Shona-dominated regions. The intersecting inequalities examined here include the privileges enjoyed by urban residents and those accrued to individuals living in Shona provinces.
Early childhood morbidity, measured as low height for age, is negatively affected by water on premises and flush toilets on premises. Logistic regression analysis will test whether the odds of stunting among children age three to 59 months are decreased in households with water piped into residence and those with flush toilets on premises. (See later for further explanation.)
In the following, variable operationalisations are delineated. The availability of improved water and sanitation throughout Zimbabwe is then examined and further results examine whether Shona-dominated residence is associated with better access to safe water and sanitation resources, tested utilising logistic regression using SPSS. Finally, the effect of access to water and sanitation on under-five morbidity is analysed.
5. Describing variables in the analysis
After appropriately weighting ZDHS data sets (see Rustein & Rojas, Citation2006), subsamples from the ZDHS data sets that contain women who have given birth to children in the five years preceding the survey were created. Retrospective data on each child’s birth, immunisations, health outcomes, and other variables are provided in the ZDHS. Also, ZDHS child files containing anthropometric measures of children under the age of five were examined. ZDHS variables analysed include living in rural or urban areas (1 = urban and 0 = rural), region (described later), language of the interview (in order to determine the dominant ethnolinguistic group in each region, described later), height for age (age three to 59 months), weight for height (age three to 59 months), water on premises (1 = water on premises and 0 = no water on premises), and flushed toilets on premises (1 = no flush toilet premises and 0 = flushed toilet on premises). Cases with missing values in one variable of interest were excluded from the analysis.
5.1. Changes in childhood morbidity in Zimbabwe, 1988–2010/11
The percentage of children whose growth was stunted is calculated on the basis of height for age, which signals ‘linear growth retardation and cumulative growth deficits’ (Zimbabwe National Statistics Agency & ICF International, Citation2012:140):
Children whose height for age Z-score is below minus two standard deviations from the median of the reference population are considered short for their age [stunted], or chronically malnourished. Stunting reflects failure to receive adequate nutrition over a long period and is also affected by recurrent and chronic illness. So it represents the long-term effects of malnutrition (specifically, under-nutrition) in a population. (Zimbabwe National Statistics Agency & ICF International, Citation2012:140)
As shown in , overall rates of morbidity are high in Zimbabwe. Comparing the percentages of children falling below two or three standard deviations of the mean reference population for three anthropometric measures reveals that, from the 1988 baseline numbers, children under two standard deviations in height for age (representing stunting) increased in every year for which comparable data are available. According to estimates reported from ZDHS data, in 1988, eight years after independence, children under the age of five had a high rate of growth stunting, wasting, and growth faltering overall. Twenty per cent of children under the age of five experienced stunting in 1988 (Zimbabwe Central Statistical Office & Demographic and Health Surveys, Citation1989:96). Remarkably, this percentage remains at 32% in 2010/11 (Zimbabwe National Statistics Agency& ICF International, Citation2012:142).
Table 2. Prevalence of children under age five experiencing growth faltering in Zimbabwe from 1988 to 2010/11.
presents sample sizes and descriptive statistics of all variables in the proceeding analysis from the ZDHS for 1988, 1999, 2005/06, and 2010/11. As shown in , low height for age (stunting) is evident in 29% in 1988 and 25% in 2010/11. The variables in are derived from the birth and children’s recode files that provide information on all births to women in the ZDHS. Thousands of children are included in this file, and in the 2010/11 file, for example, the 4279 children with valid anthropometric measures are analysed.
Table 3. Descriptive statistics for analysis variables, Zimbabwe 1988, 1999, 2005/06, and 2010/11.
‘To allow for international comparability of estimates for monitoring the Millennium Development Goals (MDGs), the Joint Monitoring Program (JMP) for Water Supply and Sanitation by the World Health Organization and UNICEF’ (Citation2015) defines improved drinking water sources and ‘improved’ sanitation in specific ways. These definitions are taken into account in operationalisations of safe drinking water and modern toilets in the logistics regressions models. In the Demographic and Health Surveys, drinking water from improved sources is measured as the ‘de-jure population whose main source of drinking water is a household connection (piped), public tap or standpipe, tubewell or borehole, protected dug well, protected spring, rainwater collection, or bottled water’ (ZIMSTAT & ICF International, Citation2012). Improved sanitation (or ‘modern toilets’ as described in the tables) includes the residential population ‘whose household has a flush toilet, ventilated improved pit latrine, or pit latrine with a slab, and does not share this facility with other households’ (ZIMSTAT & ICF International, Citation2012). Descriptive statistics in provide the percentage of improved toilets according to JMP definitions where available. In 2010/11, 29% of children’s households had unshared improved toilets. But the 1999 ZDHS does not provide information on whether pit latrines have a slab. Therefore modified definitions of toilet facilities are offered, along with their percentages. For example, in 1988, 27% of measured children’s households had flush toilets in Zimbabwe, but information is not provided in the survey as to whether those toilets were shared with other households.
Only 24% of children with anthropometric measures lived in urban areas of Zimbabwe in 1988, and 27% did so in 2010/11 (). Also, 39% lived in Shona provinces in 1988, while 47% did so by 2010/11. Ndebele province residence has decreased overtime. In 1988, 19% of the sample of young children lived in Ndebele provinces, and this was reduced to 14% in 2010/11. Rural/urban residence and living in Shona-dominated regions are included in the model and not the ZDHS socio-economic data such as wealth index variable (which measures infrastructure available in the child’s household, such as access to electricity), because access to electricity and other goods measured in the wealth index are more abundant in urban areas, and therefore socio-economic status factors and wealth would be confounded with rural/urban residence, water on premises, and flush toilets on premises.
6. Ethnicity
Ethnicity is not measured directly in the ZDHS, but there is information on the language of the in-person interview and in the written questionnaire. Examining language differences by province provides a sense of ethnolinguistic differences. Certain provinces have a majority of Shona speakers: Manicaland, Midlands, and the various Mashonaland provinces. Matabeleland provinces had more diversity – 62 to 85% speak Ndebele and 25% or so speak English. The two cities with provincial status were diverse: Bulawayo had 31% completing interviews in Shona, 60% in Ndebele, and 9% in English; and Harare had 69% completing interviews in Shona, and most of the rest in English.
6.1. Describing water availability in Zimbabwe
The first row of shows that, while water on the premises was found in less than a third of children’s households in 1988, this number increased to 35% in 1999 and rose to only 38% in 2005/06. While some improvement was found in 2005/06, still only 34% of households had safe drinking water on site in 2010/11. The second row of shows that there is a clear preference for improved water resources in urban areas. The third row shows that there is a clear preference for water on premises for households in Shona regions. For example, whereas 34.9% of households with young children whose height and weight were measured in the ZDHS had water on site in all Zimbabwe households in 1999, 48.9% had water on site in Shona regions – a 14-point difference.
Table 4. Comparing percentages of young children in households with water on premises in Zimbabwe 1988, 1999, 2005/06, and 2010/11.
7. Analysis
In the following, the ZDHS data reveal that not only are water resources in short supply on the premises of the vast majority of children’s households, but that these resources are not distributed equitably throughout Zimbabwe.
7.1. Analysis of water availability in Shona areas
In the following analysis, the 2005/06 and 2010/11 datasets for examining water availability and improved toilets are pooled. Datasets from 1988 and 1999 are not pooled, given that dependent variables are measured differently. shows that for drinking water sources there was no significant difference in water availability in 2010/11 versus 2005/06 (thus no improvement), when other factors are not taken into account. , which takes into account ethnicity, mother’s characteristics, and urbanicity, shows that not only was there no improvement between 2005/06 and 2010/11, but there was actually a decrease in access to drinking water on premises of households.
Table 5. Survey year differences for safe drinking water and improved sanitation models, Zimbabwe 2005/06 and 2010/11 (pooled).
Table 6. Determinants of access to safe drinking water for children age zero to 59 months, Zimbabwe 2005/06 and 2010/11 (pooled).
Binary logistic regression analysis reveals that in 2010/11 and 2005/06 living in a Shona region increased the odds of improved drinking water sources on site by 1.699 times relative to living in Matabeleland North, Matabeleland South, Bulawayo, Masvingo, and Midlands (p < 0.001), where there is no difference in access to improved drinking water sources in the two time periods (). A second model contains survey year, Shona residence, and residence in an Ndebele province. Ndebele people are the second largest ethnicity in Zimbabwe, and households in Ndebele and Shona regions are together 1.313 times and 1.893 times (respectively) more likely to have improved sources of drinking water at the residence relative to other portions of the country (both p < 0.001). An examination of mother’s characteristics added to the previous model shows that only mother’s literacy has a significant effect (p < 0.001) on access to improved drinking water sources in the household (in addition to survey year, and living in Shona and Ndebele regions). Because water resources are affected by urbanicity, logistic regression analysis of water at home includes urban residence, Shona region, and Ndebele region residence as covariates (in additional to controlling for maternal characteristics). Here, Ndebele residence decreased the odds of water on site (p < 0.001) when adding living in an urban area of the country to the model (as shown in ). To be clear, in the saturated model the binomial logistic regression was performed to ascertain the effects of living in Shona and living in Ndebele regions, marriage, literacy, and living in urban areas on the likelihood that participants have safe sources of drinking water on their premises. The binomial logistic regression model was statistically significant, χ2(6) = 3719.81, p < 0.0001. presents results for the remaining years (1999 and 1988).Footnote2 Here, Shona region residence always increases the odds of access to improved sources of drinking water at the residence, and the model that includes both Shona and Ndebele residence always yields statistically significant positive results. However, Shona residence increases the odds of water on site only in 1999 in the full model, and Ndebele residence does not significantly increase the odds of water on site in 1988 or 1999, when controlling for urban residence ().
Table 7. Determinants of access to safe drinking water for children age zero to 59 months in 1999 and age zero to 39 months in 1988.
Guided by the framework of intersectionality arising from African feminist methodology, that effects of inequality are simultaneous and multiplicative, statistical analysis explores whether the positive effect of living in urban areas and Shona regions on access to improved drinking water sources was in fact multiplicative. Findings show this to be true in 1999 (see ). This therefore supports a hypothesis stimulated by intersectional analysis that privileges are multiplicative. The intersection inequalities here are those experienced by rural dwellers and those disadvantaged by living in non-Shona provinces.
7.2. Analysis of flushed toilets
As noted earlier, in the following analysis the 2005/06 and 2010/11 datasets for examining improved toilets are pooled. shows that for improved unshared toilets there was a significant difference (p < 0.001) in availability of improved unshared toilets in 2010/11 versus 2005/06 (thus an improvement over time), when other factors are not taken into account. With regards to availability of improved drinking water over time, water access did actually improve from 2005/06 to 2010/11 for all models containing dominant ethnicity in region of residence, mother’s characteristics, and urbanicity. The difference between 2005/06 and 2010/11 is highly statistically significant for all models (p < 0.001) (see ).Footnote3
Table 8. Determinants of modern toilets in households with children age zero to 59 months, Zimbabwe 2005/06 and 2010/11 (pooled).
Unfortunately, as with water resources, the distribution of flush toilets to households is not equitable among Zimbabwe’s provinces. In 2005/06 and 2010/11, there is again a clear preference for Ndebele and Shona provinces, when taking into account residents living in both Ndebele and Shona regions, as well as mother’s characteristics and urbanicity. Children in Ndebele and Shona regions are therefore more likely to have improved toilet facilities in their residence. However, taken alone, living in Shona areas does not increase chances for access to modern toilets in 2005/06 and 2010/11, when other factors are examined (except for survey year – see ). For those living in Shona provinces in 1988, and also for Ndebele provinces in 1988 and 1999, even when controlling for maternal characteristics, as shown by the results presented in , children in Ndebele and Shona regions are more likely to have improved toilet facilities in their residence, as defined by the JMP (UNICEF & World Health Organization, Citation2015). Also in 1988, when controlling for mother’s literacy and marital status, Shona children are 3.108 times as likely and children in Ndebele regions are 3.674 times as likely to have flush toilets in their households, relative to children living in other regions (both results are highly statistically significant, with p < 0.001).Footnote4 Controlling for urbanicity, in 2005/06 and 2010/11 (pooled data) children in Shona and Ndebele provinces were still more likely to be living in households with improved toilets (). Given that owning an unshared toilet facility is virtually synonymous with living in an urban area, especially in 1988 and 1999 when over 90% of children whose households had unshared improved facilities lived in urban areas, analyses for these years presented in include an Ndebele and Shona model that accounts for maternal characteristics and then rural or urban residence is added to the full model. Even so, Ndebele residents are still more likely in 1999 and 1988 to have an improved toilet facility (flush toilet) relative to residents in Masvingo and Manicaland, even when controlling for urban residence.Footnote5
Table 9. Determinants of modern toilets in young children's households, Zimbabwe 1999 and 1988.
7.3. Impact of environmental contamination on early childhood morbidity
While water resources and sanitation were clearly distributed with preference given to Shona and Ndebele regions, the next question that is important to analysing morbidity is whether water resources on site affected children’s nutritional intake. For every year, improved sources of drinking water on a child’s premises were negatively related to stunting (). Therefore, consistent with the findings of Smith et al. (Citation2013), excellent access to clean water, serving as a proxy for reduced environmental contamination, is associated with a lower prevalence of chronic malnutrition, as evidenced by stunting among children age three to 59 months of age during 1999–2011 (and three to 39 months in 1988).
Table 10. Impact of water and sanitation on growth stunting, Zimbabwe 1988–2011.
Unshared flush and other improved toilets is a statistically significant indicator of stunting only in 2010/11, 1999, and 1988 when also considering the impact of improved water sources on the premises (see ). In 1988, flush toilets decreased the odds of stunting by 0.323 (p < 0.001); in 1999, children with unshared flush toilets were only 0.724 times as likely to experience chronic malnutrition as those without flush toilets (p < 0.01); and for 2010/11, the odds of growth faltering with household access to unshared improved facilities were decreased by 0.851 (p < 0.05), even when considering the impact of drinking water on the premises (see ).Footnote6
8. Discussion
The intersectional lens reveals that rural–urban differences are not enough to explain inequality in the distribution of development resources in Zimbabwe, because these inequities possibly intersect with and are multiplied by resources targeted to regions dominated by certain ethnic groups. The notion of intersectional difference, where rural/urban differences are enhanced and multiplied by ethnicity, is a theory grown from Africana feminist scholarship (Zerai, Citation2014). Using these tools, this work documents the possibility of a systematic investment of development resources in Shona and then Ndebele regions over others in the country, while also considering the impact of living in urban areas. Results may provide evidence that uneven development increased the likelihood that young children especially in rural and non-Shona and non-Ndebele regions do not have piped water (relative to Shona groups in 1999) or unshared flush toilets (relative to Ndebele groups from 1988 to 1999) or other improved toilets (from 2005/06 and 2010/11) that are possibly crucial to reduce environmental contamination which would allow for adequate nutritional absorption.
The results indicate that stunting continues to occur regularly among children in Zimbabwe, given that almost one-third of children in Zimbabwe are still malnourished today. Further, Shona and Ndebele-dominated regions have greater access to clean water and improved sanitation when rural/urban areas are not taken into account. Finally, lack of access to water and sanitation consistently affect normal rates of early childhood physical growth (especially height for age).
Zimbabwe’s challenges with increasing access to water and sanitation are instructive as policy-makers consider recommendations for Sustainable Development Goals post 2015. While Zimbabwe civil servants have been intentional about providing access to water and sanitation in rural areas,Footnote7 internal economic challenges and population growth may be contributing to the continued uneven distribution of improved water and sanitation availability to urban and rural areas. This work’s contribution, arising out of an intersectional theory articulated in Africana feminism, is that the global MDGs for each geopolitical state did not account for ethnic and regional differences that contribute to in-country variability.Footnote8 The Sustainable Development Goals at this time state that differences should be examined by gender at the micro level and rural–urban area at the macro level, but a deeper examination of the Zimbabwe case reveals the importance of tracking and reducing ethnic and regional differences in access to improved water and improved sanitation on premises, as salient axes of inequality within a country.
9. Conclusion
In future research, a qualitative examination of ethnic differences in Shona, Ndebele, and other ethnic group-dominated communities may reveal the mechanisms that contribute to inequitable distribution of development resources such as water and sanitation in various communities. Is xenophobia at play? Is political patronage at play? Is ethnic identity truly what distinguishes the haves and have-nots in Zimbabwe?
The public health recommendation of this work is that clean water and improved sanitation in the form of unshared flush toilets are needed to improve child health by reducing early childhood morbidity. Clean water is enabled through adequate quality and quantity, methods of disinfection at local point sources, and education. Although not examined in this article, adequate nutrition and access to health services are certainly important as well. However, results in this article promote paying attention to water and sanitation access in order to address the environmental enteropathy that is contributing to growth stunting. A statement of Sustainable Development Goals that includes addressing in-country variability of these resources may better aid countries in meeting future development goals.
Acknowledgements
The author wishes to acknowledge anonymous reviewers, Prof. Ezekiel Kalipeni, and Prof. Michael O. West for useful comments on earlier versions of this article. The author also acknowledges the excellent work of Prof. Ezekiel Kalipeni, Juliet Iwelunmor, and Diana Grigsby-Toussaint in bringing together colleagues for the post-2015 MDG conference where this work was originally presented, and Prof. Clifford Odimegwu and Nicole De Wet who organised Family Research in Africa and the Post-2015 Development Agenda, where this revised version was presented, and as well as participants at both conferences for their useful comments and suggestions.
Disclosure statement
No potential conflict of interest was reported by the author.
Notes
1 Korpe and Petri define environmental enteropathy as:
a subclinical condition caused by constant fecal–oral contamination and resulting in blunting of intestinal villi and intestinal inflammation. … The failure of nutritional interventions and oral vaccines in the developing world may be attributed to environmental enteropathy, as the intestinal absorptive and immunologic functions are significantly deranged. (Korpe & Petri, Citation2012:328)
2 Please note that 1988 and 1999 data are not pooled because measures of variables differ for these years.
3 In , for the saturated model, the binomial logistic regression was performed to ascertain the effects of living in Shona regions and living in Ndebele regions, marriage, literacy, and living in urban areas on the likelihood that participants have unshared adequate toilet facilities on their premises in 2005/06 and 2010/11 (pooled data). The binomial logistic regression model was statistically significant, χ2(6) = 316.868, p < 0.0001. The model explained 61% (Nagelkerke R2) of the variance in unshared adequate toilet facilities at home.
4 The binomial logistic regression was performed to ascertain the effects of living in Shona regions and living in Ndebele regions, marriage, and literacy on the likelihood that participants have unshared adequate toilet facilities on their premises in 1988. The binomial logistic regression model was statistically significant, χ2(2) = 251.045, p < 0.00001. The model explained only 14.1% (Nagelkerke R2) of the variance in unshared adequate toilet facilities at home and correctly classified 73.5% of cases.
5 In 1999, the binomial logistic regression was performed to ascertain the effects of living in Shona regions and living in Ndebele regions, marriage, mother’s lack of education, primary education, and living in urban areas on the likelihood that participants have unshared adequate toilet facilities on their premises in 1999. The binomial logistic regression model was statistically significant, χ2(6) = 661.381, p < 0.00001. The model explained 45.3% (Nagelkerke R2) of the variance in unshared adequate toilet facilities at home and correctly classified 90.3% of cases. In 1999, young children living in Ndebele areas were 1.885 times as likely to have unshared flush toilets as those living in Masvingo or Manicaland (p < 0.01). In 1988, the binomial logistic regression was performed to ascertain the effects of living in Shona regions and living in Ndebele regions, marriage, literacy, and living in urban areas on the likelihood that participants have unshared adequate toilet facilities on their premises in 1988. The binomial logistic regression model was statistically significant, χ2(5) = 1940.126, p < 0.00001. The model explained 79.4% (Nagelkerke R2) of the variance in unshared adequate toilet facilities at home and correctly classified 95.3% of cases. Young children living in Ndebele areas were 1.937 times as likely to have unshared flush toilets as those living in Masvingo or Manicaland (p < 0.01).
6 The 2005/06 and 2010/11 data sets were not pooled for the early childhood growth stunting analysis because these variables were measured differently in the two data sets, due to changes in World Health Organization standards.
7 Note that while the total numbers of improved sanitation have increased, the percentages of improved sanitation in urban areas have decreased (see ). Given the size of the population in rural versus urban areas, the larger population in rural areas is driving what appears to be an increase in the total numbers of households with access to improved drinking water.
8 The Bellagio Study Group on Child Survival (Citation2003) called for an examination of within-country child health disparities by ‘routine monitoring of results at national level disaggregated by wealth, sex, and other relevant population subgroups‘ (Jones et al., Citation2003:324); however, MDG indicators focused on cross-national variation and only examined rural/urban and some gender differences.
References
- The Bellagio Study Group on Child Survival, 2003. Knowledge into action for child survival. The Lancet 362(9380), 323–7. doi: 10.1016/S0140-6736(03)13977-3
- Campbell, H, 2003. Reclaiming Zimbabwe: The exhaustion of the patriarchal model of liberation. David Philip, Claremont, South Africa.
- Catholic Commission for Justice and Peace in Zimbabwe, 2007. Gukurahundi in Zimbabwe: A report of the disturbances in Matabeleland and the Midlands, 1980–1988. Jacana, Johannesburg.
- Davies, R, 2004. Memories of underdevelopment: A personal interpretation of Zimbabwe’s economic decline. In Raftopoulos, B & Savage, T (Eds.), Zimbabwe: Injustice and political reconciliation, pp. 19–42. Institute for Justice and Reconciliation, Cape Town, South Africa. (distributed by Blue Weaver, Cape Town, South Africa).
- Gaidzanwa, RB, 2009. Poverty, HIV and AIDS: Implications for Southern Africa in the global capitalist architecture. Paper No. 23. CODESRIA/ACLA South-South Collaborative Program Series: HIV/AIDS, Gender and Social Development in the Millennium, Dakar, Senegal.
- Gillespie, D, 2003. Knowledge into action for child survival. The Lancet 362, 323–7. doi: 10.1016/S0140-6736(03)13977-3
- Griffiths, J, 2013. Water linking nutrition, agriculture and health. Paper presented at the Safe Global Water Summit held in Arusha, Tanzania, February 1, 2013.
- Horton, R, 2006. Millennium development goals (MDGs). The Lancet 367, 1–5. doi: 10.1016/S0140-6736(06)67896-3
- Humphrey, JH, 2009. Child undernutrition, tropical enteropathy, toilets, and handwashing. The Lancet 374, 1032–5. doi: 10.1016/S0140-6736(09)60950-8
- Imam, AM, Mama, A & Sow, F, eds. 1997. Engendering African social sciences. CODESRIA, Dakar.
- Jones, G, Stekettee RW, Black RE, Bhutta ZA, Morris SS, and the Bellagio Child Survival Study Group, 2003. How many child deaths can we prevent this year? Lancet 362, 65–71.
- Korpe, PS & Petri, WA, Jr. 2012. Environmental enteropathy: Critical implications of a poorly understood condition. Trends in Molecular Medicine 18, 328–36. doi: 10.1016/j.molmed.2012.04.007
- Kundzewicz, Z, 2013. Water-food-energy nexus in the changing climate. Paper presented at the Safe Global Water Summit held in Arusha, Tanzania, January 30–February 1, 2013.
- Murambadoro, R, 2015. We cannot reconcile until the past has been acknowledged: Perspectives on Gukurahundi from Matabeleland, Zimbabwe. African Journal on Conflict Resolution 15(1), 33–57.
- Mosley, WH & Chen LC, 1984. An analytical framework for the study of child survival in developing countries. Population and Development Review 10, (Supplement: Child survival: Strategies for research), 25–45. doi: 10.2307/2807954
- Moyo, S, Makumbe, J & Raftopoulos, B, 2000. NGOs, the state & politics in Zimbabwe. SAPES Books, Harare.
- Osirim, MI, 2003. Crisis in the state and family: Violence against women in Zimbabwe. African Studies Quarterly 7(2), 153–69. http://asq.africa.ufl.edu/files/Osirim-Vol-7-Issues-23.pdf.
- Rutstein, SO & Rojas, G, 2006. Guide to DHS Statistics. Demographic and health surveys. ORC Macro, Calverton, MD.
- Smith, MI, Yatsunenko, T, Manary, MJ, Trehan, I, Mkakosya, R, Cheng, J, Kau, AL, Rich, SS, Concannon, P, Mychaleckyj, JC, Liu, J, Houpt, E, Li, JV, Holmes, E, Nicholson, J, Knights, D, Ursell, LK, Knight, R & Gordon, JI, 2013. Gut microbiomes of Malawian twin pairs discordant for kwashiorkor. Science 339, 548–54. doi: 10.1126/science.1229000
- Tibaijuka, A, 2005. Report of the fact-finding mission to Zimbabwe to assess the scope and impact of Operation Murambatsvina by the UN Special Envoy on Human Settlements Issues in Zimbabwe. http://ww2.unhabitat.org/documents/ZimbabweReport.pdf Accessed 7 January 2014.
- United Nations, 2006. UN millennium project. Commissioned by the UN Secretary General and supported by the UN Development Group, 2002–2006. http://www.unmillenniumproject.org/goals/gti.htm.
- UNESCO Institute for Statistics, 2013. Adult and youth literacy: National, regional and global trends, 1985–2015. http://www.uis.unesco.org/Education/Documents/literacy-statistics-trends-1985-2015.
- UNICEF, 2013. Zimbabwe Statistics. http://www.unicef.org/infobycountry/zimbabwe_statistics.html.
- UNICEF & World Health Organization, 2015. 25 years of progress on sanitation and drinking water.
- United Nations Statistics Division, 2014a. Millennium development goals indicators. http://mdgs.un.org/unsd/mdg/Default.aspx.
- United Nations Statistics Division, 2014b. Millennium development goals indicators – Literacy rates of 15–24 years old, both sexes, percentage. http://mdgs.un.org/unsd/mdg/SeriesDetail.aspx?srid = 656&crid = 716.
- U.S. State Department, 2009. 2008 human rights report: Zimbabwe. U.S. Government Printing Office, Washington, DC. http://www.state.gov/j/drl/rls/hrrpt/2008/af/119032.htm.
- Zerai, A, 2014. Hypermasculinity and state violence in Zimbabwe: An Africana feminist analysis of maternal and child health. Africa World Press, Trenton, NJ.
- Zerai, A & Banks, R, 2002. Dehumanizing discourse, law and policy in America: A crack mother's nightmare. Interdisciplinary Research Series in Ethnic, Gender and Class Relations. Ashgate Publishing, London.
- Zimbabwe Central Statistical Office & Demographic and Health Surveys, 1989. Zimbabwe demographic and health survey, 1988. Zimbabwe Central Statistical Office and Demographic and Health Surveys, Columbia, MD. http://www.dhsprogram.com/pubs/pdf/FR43/FR43.pdf.
- Zimbabwe Central Statistical Office & Macro International Inc, 2000. Zimbabwe demographic and health survey, 1999. Zimbabwe Central Statistical Office and Macro International Inc, Calverton, MD. http://www.dhsprogram.com/pubs/pdf/FR116/FR116.pdf.
- Zimbabwe Central Statistical Office (CSO) & Macro International Inc, 2007. Zimbabwe demographic and health survey, 2005–06. CSO and Macro International Inc, Calverton, MD. http://www.dhsprogram.com/pubs/pdf/FR186/FR186.pdf.
- Zimbabwe National Statistics Agency (ZIMSTAT) & ICF International, 2012. Zimbabwe demographic and health survey, 2010–11. ZIMSTAT and ICF International Inc, Calverton, MD. https://dhsprogram.com/pubs/pdf/FR254/FR254.pdf.