
ABSTRACT
In order to meet future goals in reducing the resulting carbon emissions from transport networks, vast investment in the development of a more energy-efficient and sustainable infrastructure is required. This study investigates the infrastructure implications of a green economy transition in the Western Cape Province of South Africa with a particular focus on the transport sector. Utilising a system dynamics modelling approach, the research effort aimed to improve understanding of how technical, economic, political, social, and environmental factors interact, particularly in the context of the uncertainties encountered during this transition. The key findings of the research indicate that investment in a better public transport system, as well as shifting the movement of freight onto the rail network, would deliver long-term positive effects, including a possible carbon emission reduction of up to 17.89%.
1. Introduction
Recognised as a key development plan by the South African government, the green economy transition has been identified as a pathway towards achieving an environmentally sustainable, resource-efficient, and low-carbon economy. This in essence aims to improve human well-being and social equity while significantly reducing environmental risks and ecological scarcities (United Nations Environment Programme [UNEP], Citation2013). The Western Cape Province sees itself as a country leader in green initiatives, emphasising the need for principal drivers to have the ability to deliver both economic activity and improved environmental performance (Western Cape Government, Citation2013). This paper relates to the development of the Western Cape Green Economy Strategy Framework in which one of the cornersstones – ‘Smart Mobility’ – identifies the transport sector as being a crucial enabler of the economy and requiring strategic development.
An ‘infrastructure system’ can be defined as a network of independent, man-made systems and processes that function in collaboration with one another to produce and distribute a continuous flow of essential goods and services (Ouyang, Citation2014). The transport infrastructure systems in the Western Cape comprise many different facets that can be broadly grouped into passenger transport and general freight transport. These networks generally comprise airports, ports and harbours, roads, public transport, and rail lines, all of which are subject to complex relationships between key developments in society, the economy, and the environment. This paper focuses on roads, public transport systems, and the rail network; all in the context of both passenger and freight transportation.
The intricacy of the transport network existing in the Western Cape requires the development of certain indicators that may be used to allude to the goals and attributes of a sustainable transport system. Such a system addresses the issues of emissions, energy use, and safety, all of which significantly impact on the environment and society. The structure of transport infrastructure, especially in urban areas, fundamentally impacts on its spatial form and on the quality of its environment (Kane, Citation2010). The complexity of each transportation system derives from the pluralism of the hardware, people, and organisations involved (Richardson, Citation2005). This interconnectivity of the infrastructure with vehicles, commuters, and authorities is multiplied by the existence of different transport modes and regulations.
Based on an understanding of sustainable transport, a set of succinct robust indicators was developed through the Trans:SIT programme undertaken for the City of Cape Town (Citation2009), which include: transport energy use; emissions; full modal split; public transport use; coverage, quality, and security; congestion on major freight routes; congestion on peak hour commuter routes; loss of life and livelihood; and urban quality.
These indicators provide the means to investigate the implications of a green economy transition for transport infrastructure within the Western Cape. Whilst many of them are specifically significant in the City of Cape Town, they can still be applied to the broader scale of the Province in order to fit the scope of this study. Relating to these indicators are the frameworks and strategies identified by the Western Cape in moving towards a green economy, as indicated in .
Table 1. Green economy frameworks for the Western Cape.
Meaningful development of any model requires understanding the concept of complex systems. Complex systems are characterised by non-linear interactions, feedback loops, and evolution over time (Costanza et al., Citation1993). The complexities of the different systems involved in a green economy transition confront policy-makers with fundamental sustainability challenges. In theory, ‘transitions’ can be defined as a gradual process of change whereby the structural character of a society transforms. Transitions can involve a range of possible development paths whose scale, direction, and speed can influence, but never control, government policy (Rotmans et al., Citation2001). This theory forms the background on which the identification of different frameworks and strategies aiming to understand and contextualise the transport infrastructure complexities was created. The next step to comprehending those changes was to formulate and develop models to analyse certain scenarios and policy changes based on strategic goals and interventions.
2. Why system dynamics to analyse transport infrastructure within a green economy transition?
The demands of this topic require a level of systems thinking which aims to understand change and complexity within the collection of parts comprising the system itself, and the relationship the system has with its environment. The underlying complexity of all systems is studied through dynamic cause and effect over time (Sterman, Citation2000; Maani & Cavana, Citation2012). There exist many disciplines and methods of analysing such dynamics, of which we studied a number, using the available literature relating to the topic of infrastructure dynamics changing over time. These included methods such as empirical, econometric, agent-based, network, and system dynamics modelling. A full comparison of the applicability of each method relating to the research topic was undertaken, based on certain criteria ranging from applicability, to topic, to ease of model creation (York, Citation2015).
compares the three modelling techniques that were deemed to be the most compelling methods for this study, namely: network models, system dynamics, and agent-based models. Whilst this critique yielded very similar characteristics for the different modelling techniques based on the criteria, the aspect of relevance to the research topic was also used in deciding on the most appropriate method. System dynamics was selected as the most appropriate modelling technique, because it is very flexible and simulates the dynamic behaviour of systems. The conceptual methods of model building, both mental and computational, are relatively easy, and robust models can be created. System dynamics allows different policy scenarios to be analysed, which enabled us to explore potential strategies in a green economy transition.
Table 2. Benchmarking of different simulation techniques (adapted from Balestrini-Robinson, Citation2009).
The capacity of system dynamics to be applied to many different problems, be they quantitative or qualitative, hinges upon the understanding that the behaviour of the system is caused by its own structure (Pruyt, Citation2013). The usefulness and appeal of system dynamics lies in the ability to analyse policy and managerial issues in real-world scenarios, linking observable patterns of behaviour of systems to micro-level structure and decision-making processes (Qudrat-Ullah, Citation2005). The crux of system dynamics modelling is that single events and entities can be viewed at an aggregate level with respect to policies (Borshchev & Filippov, Citation2004). This is all achieved through the simulation of systems behaviour through the flow and delay of information. This makes system dynamics a compelling technique for modelling transitions over long periods of time at levels of aggregation designed to facilitate policy development in managerial spheres.
The system dynamics modelling phases, as outlined by Maani and Cavana (Citation2012), are illustrated in . The phases provide a process to understand problems and identify high leverage points to mitigate unwanted surprises.
Figure 1. Phases of systems thinking and modelling methodology (adapted from Maani & Cavana, Citation2012).
3. Western Cape transport infrastructure green economy model
The modelling process followed the steps outlined in , problem structuring and articulation being the starting point. This involved the identification of the key variables, the model boundary, and the time horizon, the collection of relevant data sources, and engagement with various stakeholders. The simulation period was from 2001 to 2040, in conjunction with the Western Cape government’s strategic framework for future infrastructure improvements. The reason for beginning in the year 2001 was to align the data validation period with statistical census data that were gathered in that year. Relevant data were obtained from a range of sources, including observations, meetings, company records, historical records, statistical publications, forums, and reports. The collected information was used in the formulation and validation of initial values for stocks and parameter values for auxiliary variables; a full account of the data sources is provided in York (Citation2015).
illustrates one of the conceptual models used in this study and focuses on the dynamics of passenger transport. Loop B3 describes the balancing nature of a growing economy (gross domestic product – GDP) leading to a greater GDP per capita resulting in an increase in desired vehicle ownership; with this there will be more live vehicles on the roads, resulting in increased private transport. The more the populace uses private transport as a primary means of travel, the larger the impact on functioning roads will be due to the pure volume of traffic, and the more the functioning road infrastructure is affected, the greater the impact on the economy (GDP) will be.
Figure 2. Causal loop diagram for passenger transport infrastructure in the Western Cape.
Following the conceptual phase of the modelling process comes the phase of dynamic model building, involving the construction of the computer simulation model including the relevant stocks, flows, and auxiliary variables. The model, created in Vensim DSS, consisted of 11 sub-modules. These include: population, GDP, education, live vehicles, road infrastructure, passenger transport, rail infrastructure, freight transport, fuel demand, emissions, and green economy investment. Each sub-model is discussed in the following sections, and in more detail by York (Citation2015).
3.1. Road infrastructure sub-module
The two main stocks in the road network sub-model are roads under construction (RUC) and functioning roads (FR). The stock of roads under construction is increased through road construction starting (rrcs), which is in turn influenced by the average road cost per kilometre, and the budget provided through government expenditure for road construction. The budget for road construction is the difference between the road maintenance cost and the roads infrastructure expenditure over the average budget time. The road maintenance cost is determined by the number of kilometres of functioning roads. The cost of road maintenance is modelled as a stock, which grows over time, based on a 2% increase per year. The road infrastructure expenditure is determined based on historical data provided by the provincial budget and is then projected over time. The rate of road completion (rrc) is then simply the flow of roads under construction, and the average time it takes to complete a road, which was assumed to be five years, based on industry norms.
With the flow of road completion increasing the stock of functioning roads, road disruption (rd) acts as the output and is influenced by the effect of maintenance on road life, the average road longevity without maintenance, and the effects that motor vehicles and trucks have on pavement longevity. Determining the effects of increased numbers of motor vehicles on the roads is difficult, requiring a detailed calculation of the number of equivalent axle loads on the roads, and how they relate to the original design categories for each road. This process is specific to each road and section when construction is completed. It is thus outside the scope of this study and, instead, a simple percentage increase on road effects calibrated with data was assumed, to portray the effects of increased traffic density. An important variable in this sub-model is that of the condition of paved networks. This auxiliary is influenced by the total number of kilometres of functioning roads and the initial breakdown of the system into standardised categories. These categories range from very good, through good, fair, and poor, to very poor, and were compared with data accrued through road condition surveys conducted over the years. This variable is directly affected by the stock of functioning roads, based on the growing number of live vehicles that is included.
3.2. Live vehicles sub-module
This sub-module represents the live motor vehicles existing and operating in the Western Cape. The motor vehicles stock (MV) is the accumulation of privately used vehicles and includes the following actors: motor cars and motorcycles, minibuses, buses, light load vehicles, trucks, and other vehicles.
The MV is increased by vehicle sales (rvs) and decreased by vehicle disposal (rvd). Vehicle sales is directly influenced by the desired quantity of vehicles. This desired quantity is influenced by the population of the province, and the desired vehicle ownership per capita, which was taken to be the product of the percentage of population with access to vehicles and the relative real GDP. Vehicle disposal (rvd) is determined by the average lifespan of each vehicle group, which is disclosed in the study completed by Letshwiti et al. (Citation2003) on the analysis of vehicle ownership trends in South Africa. The MV was then calibrated against data collected from the provincial live vehicle population statistics from 2007 to 2014 (eNaTiS, Citation2014).
The various green economy investments in different modes of passenger transport were included as percentage decreases on the desired vehicle stock, and thus, when introduced, they are expected to reduce the growth of private motor vehicle ownership. The percentage decreases for the different investments were obtained from the infrastructure strategic framework of the Western Cape and the various desired modal splits that are envisioned by the government (Palmer & Graham, Citation2013).
3.3. Rail infrastructure sub-module
The rail infrastructure network of the Western Cape was modelled with a focus on three main systems: the Cape Town–Gauteng main line, the collection of intra-provincial branch lines, and the Cape Metro rail lines.
York (Citation2015) discusses the process of building the sub-module. In the modelling of the Cape Metro rail network operating in and around Cape Town Municipality, for example, two main stocks were involved: the rail tracks, named the Cape Metro Network (CMN), and the metro fleet (MF), or running train sets. The MF, made up of available functioning train sets defined by the different train types is being increased through fleet maintenance (rfm) and the new Prasa [Passenger Rail Agency of South Africa] rollout strategy (rpr), which began in 2016. The stock is depleted by through fleet deterioration (rfd), which is directly influenced by the design life of each of the different train sets and the MF.
The total MF in operation influences the scheduling of the train sets per service line, where a balance is met between passenger demands and available trains, resulting in the actual train trips scheduled. The effect of increased traffic on the rail lines is then factored in to represent the metro rail track deterioration (rmd) of the rail network stock (CMN). This stock is equally increased by the rail upgrades required to maintain service line tracks through the rate of rail maintenance and renewal (rrmr). The costs incurred in the maintenance and renewal of the service lines are accumulated in the stock of rail maintenance and renewal, which comprises the different types of maintenance measures and the related costs. The costs of the Prasa rollout strategy are equally accrued over time in another stock, and both of these are then introduced into the green economy investment sub-model.
3.4. Freight transport sub-module
The freight transport sub-model represents the movement of freight, in tonnage, in the Western Cape by road and rail. The reason for this is that the strategies included in a green economy transition are primarily focused around these specific sub-sectors. The other transport infrastructure areas, such as airports and harbours, have strategic importance more at a national planning level, and inherently have specific strategies and frameworks relating to future developments. It is for this reason that the scope for modelling freight demand and transport was limited to road and rail.
Modelling freight demand is challenging and the techniques used may differ significantly from case to case. A major determining factor in how a specific freight system is modelled is the level of aggregation at which the scenario is investigated. ‘Traditionally, the relationship between economic activity and freight transport was used to make forecasts of future aggregate freight flows and volumes’, write Ben-Akiva et al. (Citation2013). They go further to explain that although GDP is the main indicator of economic activity at a regional or country level, it is too general to be used in most aggregate freight models. The reason is that it consists in large part of value added generated in the services sector. The authors suggest the use of more relevant indicators, which can differ, for example, by country, by goods category, and by mode. Additionally, it would be good to include indicators that capture the reasons for changes in transport intensity. The factors affecting the movements of goods are wide-ranging and often specific to the value chain and again the scope of aggregation. Ortúzar et al. (Citation1994) identified many of these factors as: locational, physical, operational, geographical, dynamic, and price orientated. Due to the high level of aggregation in this model, freight demand was still dependent on economic activity. However, variables, such as agricultural production growth and the functionality of the road network were introduced from other sub-models in order to diversify the effects in the model. The geographic and locational factors were characterised by the splitting of freight transport into subscripts; for example, road freight consisted of: rural, metropolitan, the N1 corridor, the N7 corridor, and the N2 corridor. This, in conjunction with various elasticities used to correlate the model with historical data, enabled relatively accurate predictions of freight flows along these corridors. Once accumulated to provide the provincial freight movements, indicators such as fuel/energy demand and CO2 emissions could be determined.
3.5. Passenger transport sub-module
The passenger transport sub-module represents the bus rapid transit (BRT), or MyCiti bus service, in Cape Town and was modelled based on information obtained from various progress reports and business plans that were made available. The fleet stock (BRTF) reflects the vehicle fleet growth throughout the MyCiti project phase cycle. Growth is realised through BRTF investment (rBRTinv), which basically represents vehicle acquisition, and is decreased by BRT bus disruption (rBRTd).
Although it would be more realistic to model the various infrastructural aspects of the entire MyCiti project, plans and strategies already exist for this and are entirely project specific. This is the reason for only simulating the BRTF and not the accompanying stations and infrastructure. Due to the aggregate scope of this model it was more important to investigate the effects on total road infrastructure that would have been developed over the simulated period. It is, however, important to know the costs incurred in this project. This stock (BRTEXP) reflects the total capital, operational, government funding, and generated revenue over the life cycle of the project. The rates of capital, operational, and government expenditure increase the stock, with revenue created decreasing the stock. From this stock the annual capital expenditure on vehicle acquisition is determined and gets translated into the fleet investment rate as mentioned above.
The total project expenditure is an important input into the green economy investment sub-module. It can also be noted that the conventional approach to transport infrastructure modelling includes the estimation of vehicle distance travelled. In conventional transport models this involves the estimation of what travel mode should be used to satisfy the required distance to be travelled. Whilst this need was recognised, the modelling approach in this case was slightly different. For example, variables such as rail passengers’ journeys demand and passengers carried per year both lead to the variable annual modal passenger travel distance, which goes on to affect fuel demand and carbon emissions. This did not quite follow the traditional approach, whereby an over-arching passenger demand is realised, and subsequently estimating which modes of transport should represent the required vehicle distance travelled. Instead, based on the nature of the data acquired for the various transport modes, the model was constructed in the abovementioned manner. This still incorporated the various important aspects of travel distance and passenger demand, but all according to the specific modes that were included as subscripts in the model structure. Again the fact that the scope of the research topic sat at a provincial level resulted in a focus on the overall volume of traffic on the different infrastructure systems, which then had an influence on their life cycles.
3.6. Emissions sub-module
This sub-model represents the CO2 emissions resulting from transport activities in the Western Cape, for: road freight, road passenger transport, rail freight, and passenger transport. The annual emissions from the different transport modes were accumulated as the input rate for the stock of air emissions (AE) for the Western Cape. This stock is decreased by the annual natural decomposition rate of atmospheric CO2.
It is important to note the manner in which the emission factors were calculated for the different transport modes, as there is surprisingly little data on actual air emission measurements for these sectors on a provincial scale. Instead in many cases the data were merely estimations based on other driving factors. In this regard the most practised process for determining air emissions was utilised with respect to the available variables in the model. In terms of passenger transport, for example, annual travel distances, based on passenger demand and road functionality, result in the total fuel demand per transport mode, determined by the average fuel consumption per vehicle type. The CO2 emissions factors, obtained from sources such as the US Environmental Protection Agency (EPA) (Citation2008) were then used to calculate the kilograms of CO2 based on the annual fuel demands per travel mode. For rail and road freight studies undertaken by the Carbon Fund (Citation2014) organisation provide the kilograms of CO2 per tonne kilometre travelled annually. Passenger rail was addressed slightly differently, as the system is predominantly electrified, and the carbon footprint results from electricity generation, and thus factors for emissions per power output unit were utilised.
3.7. Other important indicators and sub-modules
The sub-modules population, GDP, total road accidents, and fuel demand, which were essential in the model in influencing the transport-related sub-modules in this study, are discussed in detail in York (Citation2015).
3.8. Green economy transport investment sub-module
This sub-module examines the expenditure and costs required to meet the transition to a green economy in the transport sector. The stock of green economy investment (GEI) is increased by both operational budgets for green investments (rGEopex) and capital investments at certain times throughout the simulation period (rGEcapex). There exists no output for this stock, since the sub-module acts only as an accumulation of the costs to be incurred in a green economy transition.
3.9. Model validation and testing
Model verification, validation, and legitimisation tests are essential to show that the model is robustly representative of the real system (York, Citation2015). These tests are further categorised under the core confidence-building tests outlined by Maani and Cavana (Citation2012) include model structure, model behaviour, and policy implications (York, Citation2015). In terms of the latter, the implications of changes in policy, or in this case various scenario analyses, demand a more conceptual assessment for model validation. In this regard the scenario outputs were assessed on basis of the expected outcomes of the policy changes, and whether the observed model behaviour represents the real situation: this was an iterative process. The green economy transport infrastructure investment was a stock that was influenced by all scenario changes; hence its sensitivity to policy change was analysed.
The sensitivity analysis examined checks the extent to which the transport scenario outputs were influenced by change in the following parameters: annual operating subsidy for bus services, elasticity of BRT expenditure on vehicle acquisition, predicted Prasa train-set rollout, and expected expenditure on freight rail.
Both sensitivity analyses indicated adequate confidence bands for the effects that the input variables mentioned would have on the overall stock. In both cases the business-as-usual (BAU) scenario was included to provide a reference point as to the costs incurred due to green economy investment in transport infrastructure.
4. Scenarios
Scenarios were chosen in line with the Western Cape infrastructure strategic framework, and used to create an indication of the implications of in a green economy transition. In developing the different scenarios it is important to include a BAU case, acting as the baseline from which to compare the effects of the policy changes included in the other scenarios (see ). The different policy changes implemented in the scenarios were based on initiatives that were already earmarked as future investment options through the Green Is Smart strategy and other such documents.
Table 3. Description of scenarios for green economy infrastructure in the Western Cape.
The BAU scenario is characterised by a growing population and hence a greater transport demand. Based on current and expected levels of growth and expenditure, this scenario influences the dynamics of transport infrastructure over the simulation period. The policy changes within the scenarios, as defined in , indicate the variables that have changed over time in accordance with specific transition strategies that were defined in the Western Cape infrastructure framework (Palmer & Graham, Citation2013).
5. Results
York (Citation2015) discusses the important stocks and key indicator variables of the various sub-modules with regard to the defined simulation outputs. Only the main findings, pertaining to the scenario analyses, are discussed here.
5.1. Results from the BAU scenario
The BAU scenario provides the baseline with which all other scenarios are compared, whereby the dynamics of the current real system being modelled are identified. The intention of this baseline is to simulate historical trends relating to captured data provided in the model parameters. The important stocks for this paper include the paved road and rail networks of the Western Cape, as well as the traffic densities on these networks, currently and predicted over the simulation period.
The paved road network consisting of the stock of functioning roads indicates that, in the BAU case, the stock of roads is deemed to increase over time based on a constant budget provided by government. It must be noted that the budget for road expenditure varies significantly on an annual basis, and that the model output is based on an average relationship to GDP growth, thereby limiting the effects of unexpected expenditure. Budget gaps and lack of expenditure, which are bound to occur in the future based given the relative economic stability of the country (and the province), are thus impossible to include in the model and may give a false representation of the paved network over time. For example, the BAU scenario for the paved road network may in fact not experience such growth in reality. It does, however, provide a good account of the system if a certain budget is aimed for and achieved.
The BAU scenario for the existing rail networks is not as positive and instead shows a gradual decline in all rail systems, based on current expenditure. This should raise concerns within the management structures of the operating organisations. Based on expected freight movements and traffic on the Cape Town–Gauteng main line, the number of kilometres of functioning rail track in the province is predicted to decrease slightly, but will remain in adequate working condition if the current under-utilisation of the line continues. The same is apparent in the branch-line network, which is expected to remain constant due to the lack of traffic on the lines. It must be noted here that other components of the system, such as signalling and power distribution lines, not included in the model, are expected to deteriorate over time.
The Cape Metro rail network faces a more substantial decrease in functioning rail track over the simulation period of up to three kilometres in annual servicing backlog. Such behaviour is not entirely unexpected, as this system, compared with the freight lines, is being used more regularly and with much greater traffic demands, resulting in more rail maintenance and renewal being required. Related to this is the constantly required train scheduling, based on the current working train fleet and the demand for public transport from a growing populace.
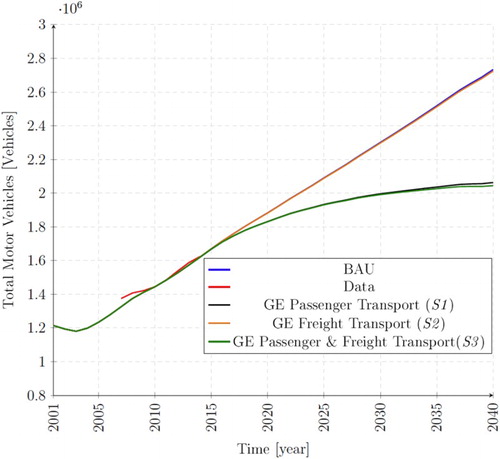
A challenge revealed by this scenario, which is of concern, is the steady increase in live vehicles on the roads, which is expected to more than double by 2040 (see ). This trend has many negative connotations with regard to road safety, CO2 emissions, fuel demand, and pavement conditions, which all act as important drivers working against the aim of a green economy. The BAU scenario, which describes the real system if it the existing trends were to continue, simulates a transport sector that will ultimately become characterised by road-based private transportation, which is not (i) economically, (ii) socially, or (iii) environmentally sustainable.
Figure 3. Total motor vehicles on Western Cape roads.
5.2. Results from the passenger transport (S1) scenario
The passenger transport scenario introduced the policy changes and shifts in certain variables in an attempt to simulate the various strategies outlined in the corresponding green economy frameworks. These changes involved a focused increase in public transport modes within the province, resulting in conclusive indications of the infrastructure implications. One such indication is that of the condition of the paved network, the percentage of very good and good roads increasing by more than 4.6% and the percentage of poor roads reducing by 2.6%. This comes as a consequence of the significant decrease in live vehicles of 670 000 vehicles by the year 2040 when compared with the BAU scenario, as a result of the increased availability of public transport services.
The implications, however, of increasing the public transport services within the rail system have a greater impact on the infrastructure than those of the road networks. In this case the main influencing factor is the desired rollout of train sets from 2016 identified by Prasa. This strategy aims to meet the demands of passenger transport with respect to the numbers of scheduled trains operating per line annually. However, the results from the simulation indicate that increased pressure on the already ageing and deteriorating rail network may result in the stock of functioning rail track decreasing by up to 7.8 km. This comes as a consequence of an increase in traffic on the various service lines requiring a R28.94 million increase in rail maintenance and renewal by 2040. This amount will still not be enough to bring the rail stock up to 100% functionality, and it is expected that substantial rail upgrades will be required to do so. This is not to mention the necessary improvements to the signalling systems, and other system components, that will be required to provide a modern rail service.
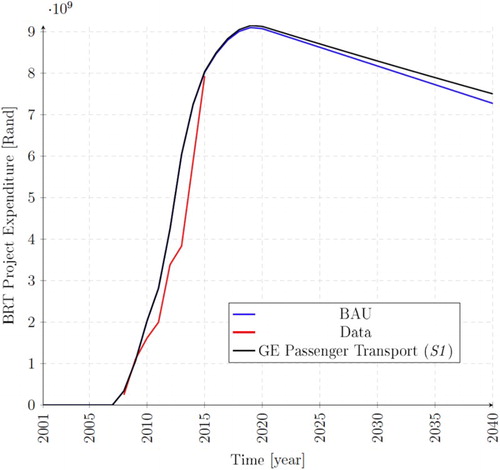
The BRT system developed in and around the Cape Town indicated that the majority of its growth would relate to the years of project execution, ending in 2020. From this year forward it is envisioned that no more capital expenditure will be required besides that of vehicle acquisition (see ). Instead it is believed that the revenue generated will in fact outweigh the operational costs of the system. The requirements of implementing a green economy would result in maintaining and expanding where possible this system which is already in successful operation, and creating links with the various other modes of transport, especially the rail network.
Figure 4. BRT project expenditure.
The BRT is expected to service a maximum of 6.8 million passengers annually by 2040, and the results for 2012 match the Provincial Land Transport Framework statistics at around 3.5 million passengers for the year, indicating substantial growth in this transport system. The parameter determining the number of passengers carried annually is the existing operating bus stock per annum (), which is expected to increase substantially as the project reaches its predetermined goals.
Figure 5. BRT fleet size.
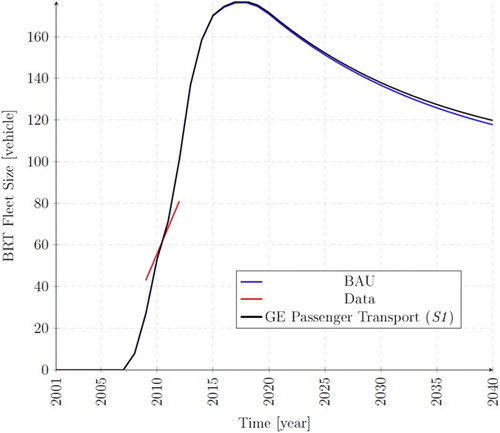
It is evident that a limit will be reached in the BRT fleet size at nearly 180 vehicles by 2020. However, based on the expected budget for vehicle acquisition, the BRT fleet will slightly contract over time if no further investment is forthcoming.
The best indicator of the health of the public transport system is evident in the modal splits of passenger transport. The results shown in indicate that the modal split between private and public transport will reach a 60:40 ratio by 2040. Whilst this is still not the desired 50:50 split envisioned by the various frameworks, the outcomes of the model were based on more conservative assumptions. What this implies for government is that aggressive measures and strategies on public transport will be required to meet this goal. The BAU scenario predicts a ratio of 72:28 private to public transport by 2040; this puts the results of scenario S1 into context and reveals that achieving a modal split of 60:40 would be in fact a considerable accomplishment.
Table 4. Modal splits of passenger transport modes.
5.3. Results from the freight transport (S2) scenario
The basis for strategic intervention for S2 involved a shift in freight movements onto the rail network of up to 20%. A substantial impact on the ageing rail infrastructure occurred, resulting in a 2 km annual backlog in functioning rail track on the branch lines that feed into the Cape Town–Gauteng main line, resulting in a R71.6 million increase in normal rail maintenance and renewal measures being required by 2040. The results indicated that a brief window period exists between 2015 and 2030 whe strategic rail infrastructure investment can be undertaken in order to rein in the maintenance costs involving system upgrades, along with substantial track renewal, signalling, and power distribution improvements.
Similar results are apparent for the Cape Town–Gauteng main line. However, expenditure on maintenance and rail renewal brings the track back to 100% functionality. This is most likely due to the simplicity of the system compared with the branch-line network, as a single line of track is the point of focus instead of many different branches. Again the costs incurred in order to reach 100% functionality are substantial, but in this case a plateau is reached in the last five years of the simulation period representing the time when the rail track is fully functional. The same conclusion, however, applies to this network as it did for the branch-line network, that system upgrades and track renewal beginning as soon as possible, instead of attempting to salvage the system at the end of its design life, will mitigate the costs expected in the future.
Such improvements will result in positive economic benefits, with a potential reduction of ten cents per tonne kilometre per route kilometre. This means that the ‘cent per tonne-km cost of a rail-road will decrease with each additional tonne-km activity over the same track length’ (De Bod and Havenga, Citation2010). This dynamic is a result of the rail system having a high level of fixed costs due to the permanent nature of the infrastructure, the average cost per tonne kilometre and the profitability consequently being related to the traffic density.
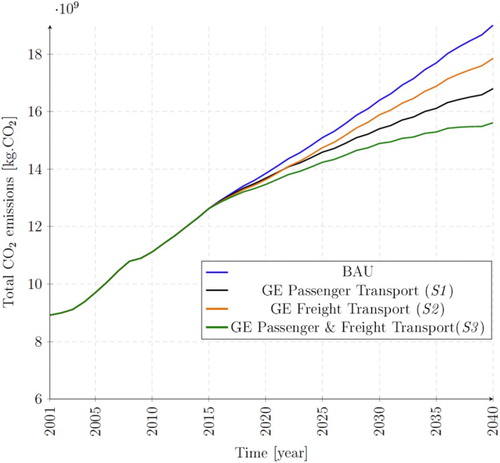
Additional to the cost benefit of rail costs are the reduced truck numbers on the roads, resulting in better road conditions, lower traffic densities, lower CO2 emissions (see ), and reduced diesel demand within the province. These changes would support the social and environmental goals set out by the different strategies for a sustainable transition towards a green economy.
Figure 6. Total CO2 emissions resulting from the transport sector.
5.4. Results from passenger and freight transport (S3) scenario
Scenario 3 combined the shift in both passenger and freight transport in response to the overarching goals set out for a green economy transition. The greatest impacts expected on the road infrastructure network include: reduced truck and private vehicle numbers on the roads, resulting in better road conditions; lower traffic densities, lower CO2 emissions (by 17.89%); and reduced diesel and petrol demand within the province. Indicators such as access to public transport, and road safety, improved due to the alleviation of the pressure on the road network.
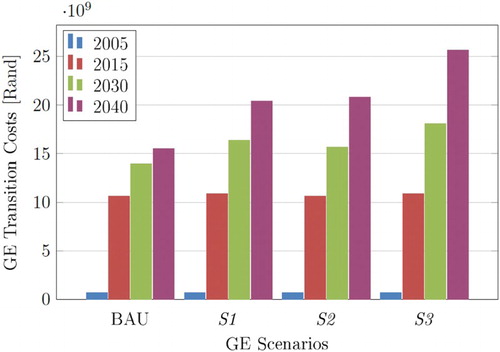
The culmination of S3 having combined all aspects of a green economy transition, provides the most discerning costs incurred and investments required in order to reach the goals set out by the various strategies. illustrates the costs involved in the transition for specific years within the simulation period, according to each scenario. The comparisons that can be drawn from this make it possible to weigh up the cost benefits of implementing the various policy changes. Here it is evident that scenarios S1 and S2 will incur similar costs over the time horizon in question, S3 requiring a total of R25.5 billion by 2040, compared with the R20.2 billion and R20.8 billion of S1 and S2, respectively.
Figure 7. Green economy transport infrastructure investment.
5.5. Recommendations to stakeholders
The challenge of improving the commuter rail system in the province is considerable, and the process by which these changes are made will be crucial to the overall success of the system. As is the case for the modernisation of the rail system, the results from the model simulation suggest that the envisioned strategy of rolling out new train sets cannot be implemented without upgrading the network itself. The planned introduction of new modern train sets onto infrastructure already past its design life, operating in combination with an ageing train fleet, will result in service bottlenecks and further degradation of the existing rail track. Other recommendations include the standardising of public transport in terms of the service provided, ultimately leading to a safer and more efficient system.
With regard to freight transportation, there exist substantial volume opportunities on the branch lines throughout the Western Cape rail network. If carried out correctly, the utilisation of these lines could reduce direct transport costs and external charges for the economy as described by Simpson and Havenga (Citation2010). The most suitable market space is that of heavy inter-modal container transport predominantly on the Cape Town–Gauteng main line. The majority of freight being moved on this corridor is container based and destined for the major city of Johannesburg, meaning that inter-modal solutions are possible and arguably the most sustainable way of moving freight over this distance. It must be reiterated that these recommendations cannot be considered in isolation from the impacts that increased freight and passenger traffic will have on the rail infrastructure. It should be noted that significant investment will be required for the upgrading and maintenance of the rail track and accompanying components during the transitional phase.
6. Conclusions
This paper demonstrates the usefulness of simulation and modelling in facilitating analysis and understanding of the transport infrastructure implications of a green economy transition in the Western Cape. Looking at the problem from a managerial point of view, with the aim of supporting policy formulation and decision-making platforms, the use of system dynamics provided a robust means of representing complex issues pertaining to the infrastructure implications of a green economy transition.
The model developed examined the dynamic interactions within the transport sector of the Western Cape Province in light of various potential strategic interventions. This enabled the analysis of the state of infrastructure systems within the transport sector using a timeframe relevant to the development strategies set out by government. The key findings indicate that through the investment into public transport system, as well as shifting the movement of freight onto the rail network, long-term positive effects in economy, society, and environment can be achieved. The outcomes pertaining to the infrastructure implications led to the recommendation of exploring a standardised system that would link all modes of public transport, in terms of the service provided and in the manner of payment and operation. With regard to freight, an inter-modal imperative is arguably the most sustainable intervention throughout the province. The benefits of this shift would include the reduction of trucks using the road network, resulting in better pavement conditions and road safety. It is, however, highlighted that such a transition will require significant investment; in the order of 10 to 25 times that of a BAU scenario.
This study formed part of a greater research effort aiming to create a cross-sectoral model able to accurately simulate the economy of the Western Cape. The next step for future research efforts is to incorporate the various models for each sector into one dynamic model, from which policy changes and strategies can be tested, producing a holistic view of the green economy transition across all sectors. At this stage it can be concluded that it is possible to achieve a sustainable green economy in the Western Cape, and the implications of such a transition for transport infrastructure are manageable and achievable through strategic development. With the aid of policy simulation, and decision-making based on accurate representations of the future effects of various green economy strategies, such a goal would be both possible and beneficial.
Disclosure statement
No potential conflict of interest was reported by the authors.
Additional information
Funding
References
- Balestrini-Robinson, S, 2009. A modeling process to understand complex system architectures. PhD thesis, School of Aerospace Engineering, Georgia Institute of Technology.
- Ben-Akiva, M, Meersman, H & Van De Voorde, E, 2013. Freight transport modelling. Emerald Group Publishing, Bingley.
- Borshchev, A, & Filippov, A, 2004. From system dynamics and discrete event to practical agent based modelling: Reasons, techniques, tools. Proceedings of the 22nd International Conference of the System Dynamics Society, 25-29 July, Oxford, England.
- Carbon Fund, 2014. How we calculate. http://www.carbonfund.org/how-we-calculate Accessed 14 February 2017.
- City of Cape Town, 2009. Integrated transport plan for the city of Cape Town: 2006–2011. https://www.capetown.gov.za/en/IDP/ Accessed 4 February 2016.
- Costanza, R, Wainger, L, Folke, C & Maler, K, 1993. Modeling complex ecological economic systems: Towards an evolutionary, dynamic understanding of people and nature. BioScience 43(8), 545–5. doi: 10.2307/1311949
- De Bod, A & Havenga, JH, 2010. Sub-Saharan Africa’s rail freight transport system: Potential impact of densification on cost. Journal of Transport and Supply Chain Management 4(1), 89–101. doi: 10.4102/jtscm.v4i1.13
- eNaTiS, 2014. Live vehicle population as per the national traffic information system. http://www.enatis.com/index.php/statistics/13-live-vehicle-population?start=20 Accessed 13 February 2017.
- Kane, L, 2010. Sustainable transport indicators for Cape Town, South Africa: Advocacy, negotiation and partnership in transport planning practice. Natural Resources Forum 34(4), 289–302. doi: 10.1111/j.1477-8947.2010.01313.x
- Letshwiti, V, Stanway, R & Mokonyama, M, 2003. Strategic overview and analysis of vehicle ownership trends in South Africa with emphasis on light passenger vehicles. Proceedings of the 22nd Annual South African Transport Conference, 14-16 July, Pretoria, South Africa.
- Maani, KE & Cavana, RY, 2012. Systems thinking, system dynamics: Managing change and complexity. 2nd edn. Pearson, Auckland, New Zealand.
- Ortúzar, S, Juan de Dios, WLG, 1994. Modelling transport. Wiley, Chichester, New York.
- Ouyang, M, 2014. Review on modeling and simulation of interdependent critical infrastructure systems. Reliability Engineering & System Safety 121(0), 43–60. doi: 10.1016/j.ress.2013.06.040
- Palmer, I & Graham, N, 2013. Western Cape infrastructure framework. Tech Rep., Western Cape Government, Kenilworth, Cape Town.
- Pruyt, E, 2013. Small system dynamics models for big issues: Triple jump towards real-world complexity. 1st edn. TU Delft Library, Delft, The Netherlands.
- Qudrat-Ullah, H, 2005. Structural validation of system dynamics and agent-based simulation models. Proceedings of the 19th European Conference on Modelling and Simulation, June 1-4, 2005, Riga, Latvia.
- Richardson, BC, 2005. Sustainable transport: Analysis frameworks. Journal of Transport Geography 13(1), 29–39. doi: 10.1016/j.jtrangeo.2004.11.005
- Rotmans, J, Kemp, R & Van Asselt, M, 2001. More evolution than revolution: Transition management in public policy. Foresight 3(1), 15–31. doi: 10.1108/14636680110803003
- Sterman, JD, 2000. Business dynamics: Systems thinking and modeling for a complex world. Irwin McGraw-Hill, Boston.
- Simpson, Z & Havenga, JH, 2010. Revitalisation of branch lines in South Africa: A long-term view for sustainability. Stellenbosch University, Stellenbosch. http://hdl.handle.net/10019.1/16306 Accessed 4 February 2016.
- UNEP, 2013. What is GEI? United Nations Environment Programme, Nairobi. http://unep.org/greeneconomy/AboutGEI/WhatisGEI/tabid/29784/Default.aspx Accessed 4 February 2016.
- United States Environmental Protection Agency (US EPA), 2008. Average annual emissions and fuel consumption for gasoline-fueled passenger cars and light trucks. http://www.epa.gov/otaq/consumer/420f08024.pdf Accessed 14 February 2017.
- Western Cape Government, 2013. Green is smart: Western Cape green economy strategy framework. http://led.co.za/topic/green-economy Accessed 4 February 2016.
- York, TA, 2015. Infrastructure implications of a green economy transition in the western cape province of South Africa: A system dynamics modelling approach. Masters thesis, Stellenbosch University. http://hdl.handle.net/10019.1/97849 Accessed 13 February 2017.