
ABSTRACT
This study examines employment discrimination by race and gender in 1997–2016 by employing a sample that represents the labour force (excluding informal sector workers, agricultural workers, domestic workers, self-employed and employers) aged between 15 and 65 years. Probit models are conducted to estimate labour force participation, employment and occupational attainment likelihoods. This is followed by the Oaxaca–Blinder decomposition, and the results indicate that the unexplained component of the white–African employment probability gap reveals a downward trend in absolute terms in 2002–2014, but in relative terms it still accounts for about 50% of the gap in 2016. The unexplained component is most dominant in the male–female employment gap decomposition. While these results suggest that employment discrimination (unexplained component) against Africans and females remains serious, the improvement of education and skills level of the workseekers (explained component) from the previously disadvantaged groups remain crucial to improve their employment prospects.
JEL CLASSIFICATION:
1. Introduction
The South African labour market was subject to various types of employment discrimination during the apartheid era. Numerous legislations (amongst others, the Group Areas Act 41 of 1950 and the Industrial Conciliation Act 28 of 1956) were enacted to deny Africans access to high-skilled and highly paid work, and prevent them from finding work in the urban areas (Venter et al., Citation2009:39). To correct for these imbalances, new legislations have been enacted since 1994, such as the Labour Relations Act 66 of 1995 (LRA), the Basic Conditions of Employment Act 75 of 1997 (BCEA), Employment Equity Act 55 of 1998 (EEA) and Broad-based Black Economic Employment Act (BBBEE) Act 53 of 2003.
The LRA promotes sectoral collective bargaining, simplifies dispute resolution procedures and codifies dismissal procedures. It also entrenches the constitutional right to strike and organisation rights for trade unions. Bargaining Councils (BCs) and the Commission for Conciliation, Mediation and Arbitration (CCMA) are established to improve bilateral negotiations between trade unions and employers (Bhorat et al., Citation2002:43). The BCEA primarily aims to cover the employment conditions of workers, giving effect to and regulating the right to fair labour practices. This is done ‘by establishing and enforcing basic conditions of employment and by regulating the variation of basic conditions of employment’ (Republic of South Africa, Citation1997:6). The act also seeks to improve the working conditions of vulnerable employees by addressing issues like work hours, overtime pay, employment contracts and employment termination. The BCEA was revised in 2002 to make provisions for the improvement of minimum wages and working conditions of 11 vulnerable sectors, including domestic and farm workers (Bhorat et al., Citation2002:43; Finnemore, Citation2009:187).
The EEA addresses labour market discrimination, and correct gender and racial imbalance. Since removing discriminatory laws alone will not be sufficient to overcome disparities in the labour market, various measures are recommended to promote the previously advantaged groups (i.e. females, blacks, disabled). In particular, the EEA ensures that a designated employer hiring more than 50 workers or whose total annual turnover exceeds the amount specified in the act is required to prepare and implement a plan to achieve employment equity, with numeric goals for the hiring and advancement of designated groups, and narrowing earnings differentials across occupational groups (Republic of South Africa, Citation1998; Bhorat et al., Citation2002:43; Clarke, Citation2004:563).
Finally, the BBBEE Act aims at the economic empowerment of all black people (including, amongst other, women, youth, disabled and rural residents). The Codes of Good Practice, which were established to provide guidelines for the process of BEE, consist of various elements, ranging from ownership, management control, skills development and employment equity, to enterprise development and socio-economic development (Burger & Jafta, Citation2010:7–9; Department: Trade and Industry, Citation2014).
Surprisingly, nearly all existing local studies on labour market discrimination focused on wage discrimination. Only two local studies examined employment discrimination, but the analysis was conducted up to 2006 only. There is thus a clear research gap on employment discrimination, which this study aims to fill. Hence, this study aims to examine the extent of employment discrimination by race and gender in 1997–2016. Section 2 reviews the recent local studies on labour market discrimination; Section 3 discusses the methodology and data, before Section 4 presents the empirical findings. Section 5 concludes the study.
2. Literature review
The studies conducted by Burger & Jafta (Citation2006, Citation2010) were the rare ones that thoroughly investigated post-apartheid employment discrimination in South Africa. Their 2006 study conducted the Oaxaca–Blinder decomposition to examine employment discrimination by race in 1995–2004. They found that the white–African employment probability gap increased significantly between 1995 and 2000, before stabilising in 2001–2004. No clear evidence of any strong downward trend of the unexplained component was found. The authors also derived the differential in the probability of the labour force (LF) attaining high-skilled employment by race, and found an increasing occupational attainment probability gap between whites and Africans. This gap was driven in part by an increase in the unexplained component. The authors concluded that Affirmative Action did not significantly reduce employment and high-skilled occupational attainment probability gaps by race.
The second study by Burger & Jafta (Citation2010) extended their 2006 analysis by examining employment and wage discrimination by race and gender in 1995–2006. The authors focused on whites and Africans with at least incomplete secondary education. The employment probability gap between white and African males increased from 0.32 in 1997 to 0.38 in 2003, before declining to 0.28 in 2006. The unexplained component remained fairly constant at 0.04 in 1997–2003 before dropping to 0.01 in 2006. This decline could be attributed to the implementation of Affirmative Action policies in 2003; however, the reduction in the employment probability gap caused by improving the skills of Africans had a stronger influence. The difference in employment probabilities between African and white women was higher when compared to what happened between African and white men. In particular, the unexplained component for the former was much larger.
In the case of gender discrimination in each race, Burger & Jafta (Citation2010) found that for Africans, men were approximately 15 percentage points more likely to find employment than women, and about half of this difference was explained by differences in characteristics. The unexplained component of the male–female employment probability gap increased between 2000 and 2006 for both Africans and whites. They concluded that Affirmative Action did not rapidly reduce employment discrimination by race and gender.
There is rather an abundance of local empirical studies on wage discrimination and they can be categorised into four groups. Firstly, Winter (Citation1999), Hinks (Citation2002), Grun (Citation2004, Citation2009), Ntuli (Citation2007), Shepherd (Citation2008), Muller (Citation2009) as well as Bhorat & Goga (Citation2012) investigated wage discrimination by gender. With the exception of Muller (Citation2009), these studies concluded in general that there is no significant decline in the male–female mean log real wage gap in the 1990s and 2000s. Secondly, Burger & Jafta (Citation2006, Citation2010) examined wage discrimination by race and found that there is no clear downward trend of the white–African mean real wage gap over time. In particular, their 2010 study found a continuous increase in the unexplained component. Thirdly, Armstrong & Steenkamp (Citation2008) as well as Ntuli & Kwenda (Citation2014) looked at wage discrimination by trade union membership status, and it was found that unionised workers enjoyed a wage premium compared to non-unionised workers even after controlling for differences in characteristics. Lastly, Chamberlain & Van der Berg (Citation2002) as well as Burger & Van der Berg (Citation2011) examined wage discrimination by gender and race before and after controlling for differences in quality of education, and they found that the unexplained component was smaller afterwards. For all four groups of studies, Oaxaca–Blinder decomposition was adopted, except that additional techniques were used in some studies, such as the Brown–Moon–Zoolth and Juhn–Murphy–Pierce decompositions (e.g. Burger & Jafta, Citation2006; Shepherd, Citation2008) as well as Monte-Carlo-like simulations (e.g. Burger & Van der Berg, Citation2011), but these techniques are not discussed in the methodology section since they are not used in this study.
3. Methodology and data
3.1. Methodology: Oaxaca–Blinder decomposition
This study, just like those reviewed in the previous section, adopts the Oaxaca–Blinder decomposition approach to examine the extent of employment discrimination in post-apartheid South Africa. This approach enables the average gender or racial wage differential (or the gender or racial gap for other labour market outcomes, such as employment probability gap that is the focus of this study) to be decomposed into two parts: the explained component which is attributed to differences in productive characteristics between groups; and the unexplained component which remains even after controlling for the above differences. As a starting point, a wage earnings function is estimated, with the log of wages dependent on a set of distinct characteristics. The function is given as:(1)
W represents the average wage, X stands for the average productive characteristics and
is the vector of coefficients demonstrating the markets valuation of the productive characteristics X, such as years of education, province, age and marital status. While w and b represent the white and African population groups respectively, the difference between white and African mean log of wages can be stated as:
(2) The equation can be rewritten as:
(3) where
represents the vector of coefficients that would remain when no discrimination is present. The mean wage gap can now be split into three different categories. The first category is the wage differential that comes from the difference in the average productive characteristics between the white and African population,
. The second category is the difference between what white employees are being paid and what they would have earned in a labour market without discrimination,
. The last category represents the difference between what African employees would have earned in a labour market without discrimination and what they are actually being paid,
. The last two categories are combined and referred to as the unexplained component of the wage gap, reflecting the white and African disadvantages respectively (Burger & Jafta, Citation2006:9–11; Shepherd, Citation2008:12–13).
Assuming =
, i.e. the vector of coefficients in the non-discriminating scenario is equivalent to the white wage structure, Equation (3) becomes:
(4) Burger & Jafta (Citation2006:11) extended the Oaxaca–Blinder decomposition to binary econometric models; they followed Gomulka & Stern (Citation1990:174–175) by expressing Equation (3) as:
(5) where
is a probit function. This function determines the probability of a labour market outcome. The average of the values of the function is indicated by
and given as:
.
Burger & Jafta (Citation2006:11–12) note two complications in empirically estimating Equations (3) and (5). The first difficulty is data restriction and the immeasurability of certain productive characteristics, for example school quality and ability. This implies that empirical studies reluctantly omit some explanatory variables. If these variables are omitted, it could result in an overestimation of labour market discrimination. The unexplained component of the wage gap is often referred to as the ‘upper limit to discrimination’ (Burger & Jafta, Citation2006:11; Shepherd, Citation2008:13–14). It is also possible for the unexplained component to be downwardly biased if one were to consider pre-labour market discrimination. In this case, part of the explained component of the wage gap could be due to pre-labour market discrimination, such as human capital investment decision (Burger & Jafta, Citation2006:11). It should be noted that for this study the unexplained component is restricted to discrimination that took place after the person entered the job market.
The second complication is selection bias: inconsistent estimates of the regression coefficients could result from regular single equation techniques. There are however procedures that can be used to remedy this problem. In the case of the wage gap and employment likelihood gaps, the Heckman and Heckprobit procedures can be used respectively. Both procedures begin by estimating a model of selection into the relevant sample. The explanation is done for the Heckman procedure, which is very similar to the Heckprobit procedure. The two-step model selection equation is given as:where
stands for the employment status of the individual. If the individual is employed,
; if the individual is unemployed,
. This can be modelled by using a probit specification. An artificial regressor, which is the Inverse Mills ratio, may be added to the wage equation to consistently estimate the
from the wage regression specified previously. The artificial regressor is given as:
where stands for the normal probability density function and
represents the normal cumulative distribution function. By estimating:
The next step is to subtract the Inverse Mills ratio from each side of the equation. This is done to allow the racial wage gap to be decomposed into different components. The Heckprobit model works in a similar way: the sample of individuals in the LF is not a random sample but has already undergone a selection process whereby some people in the working-age population decided to enter the labour market while others opted not to seek work. Hence, the LF participants are likely to differ from the non-participants (or inactive), the simple employment probit results would suffer from sample selection bias. Hence, the Inverse Mills ratio is derived from the participation probit, before being included as an explanatory variable in the employment probit, making it conditional on labour force participation (Oosthuizen, Citation2006:53).
Nonetheless, Burger & Jafta (Citation2006:18) did not take the issue of sample selection bias into consideration in their empirical study, because including selection equations resulted in unstable racial gaps in wages. This is also the approach adopted by Hinks (Citation2002), Shepherd (Citation2008) and this study.
3.2. Data
Data from the 1997–1999 OHS, 2000–2007 LFS and 2008–2016 QLFS conducted by Statistics South Africa would be used. The sample includes individuals aged 15–65 years at the time of the survey. Self-employed, employers, informal sector employees, agricultural employees and domestic workers are excluded as the post-apartheid labour market legislations and policies are unlikely to have a large impact on these workers (Burger & Jafta Citation2006:18). The OHS 1995–1996 data are not included as employees were not asked to declare whether they worked in the formal or informal sector (Essop & Yu, Citation2008:7–8). Hence, the empirical analysis would cover the period 1997 to 2016, unless specified otherwise. Since the methodology to derive the labour market status under the expanded definition has drastically changed since the introduction of the QLFS and this methodology is not comparable to the OHS/LFS methodology (Yu, Citation2013:705–710), the narrow definition will be adopted for the empirical part of the study.
While Chamberlain and Van der Berg used the 1993 Project for Statistics on Living Standards and Development (PSLSD) data to predict the education quality-adjusted literacy and numeracy test scores in OHS 1995,Footnote1 before including these scores as explanatory variables to derive the explained and unexplained components more precisely, this approach is not adopted in this study due to the too long time gap between PSLSD 1993 and the LFSs and QLFSs. Although the numeracy test scores in the 2008 National Income Dynamics Study (NIDS) data could be a potential data source (to predict the quality-adjusted test scores of individuals in the labour surveys taking place around 2008), unfortunately only about 20% of the adult sample took part in the numeracy test in the NIDS. This too-small and biased sample would lead to the derivation of unreliable predicted test scores.
4. Empirical findings
4.1. Descriptive analysis
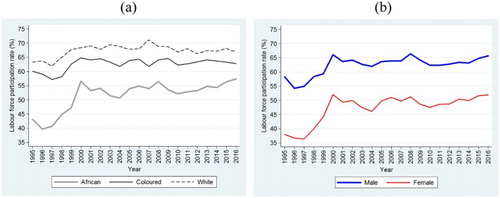
(a) and 1(b) shows that the LFPR increased rapidly in the OHSs for all racial groups considered (especially Africans), after which a slight downward trend was observed between 2000 and 2004. Following a slight upward trend in 2005–2008, a relatively stable pattern took place in 2009–2016. Africans were associated with the highest LFPR during the 22-year period. Similar trends could be observed for the two genders ((b)), but the males were more likely to participate in the labour market than females.
Figure 1. Labour force participation rates by population group and gender, 1995–2016: (a) by population group; (b) by gender. Source: Own calculations using OHS 1995–1999, LFS 2000–2007 September, QLFS 2008–2015 Q4 and QLFS 2016 Q3 data.
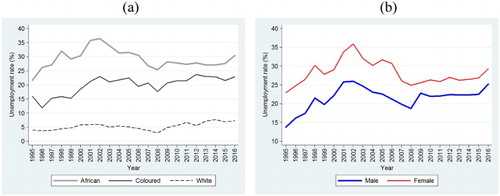
The sharp increase in the LFPR in the OHSs may have contributed in some way towards the upward trend of the unemployment rates during the same period (see (a) and 2(b)), as the extent of job creation was not rapid enough to absorb the net labour force entrants during the 1990s. A general upward trend was observed between 1996 and 2003, followed by a downward trend in 2005–2008 and a slight upward trend afterwards. Unemployment rate was always lower for males and whites, compared to their respective counterparts.
Figure 2. Unemployment rates by population group and gender, 1995–2016: (a) by population group; (b) by gender. Source: Own calculations using OHS 1997–1999, LFS 2000–2007 September, QLFS 2008–2015 Q4 and QLFS 2016 Q3 data.
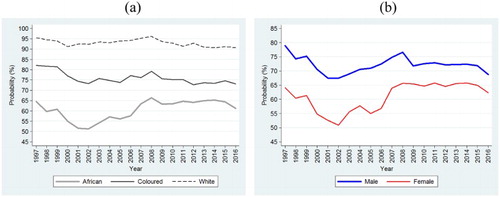
(a) and 3(b) present the probability of each racial and gender group of labour force finding employment in the formal non-agricultural sector.Footnote2 (a) shows that this probability was the highest for the whites (above 90%). For the Africans, a downward trend first took place in 1997–2002, followed by an upward trend in 2002–2008 (this probability peaked at 66.3% in 2008), before stabilising in 2009–2014. In contrast, (b) shows that the employment probability was always higher for the males, but the male–female probability gap narrowed from 14.8 to 6.4 percentage points between 1997 and 2016.
Figure 3. Probability of finding employment in formal non-agricultural sector, 1997–2016: (a) by population group; (b) by gender. Source: Own calculations using OHS 1997–1999, LFS 2000–2007 September, QLFS 2008–2015 Q4 and QLFS 2016 Q3 data.
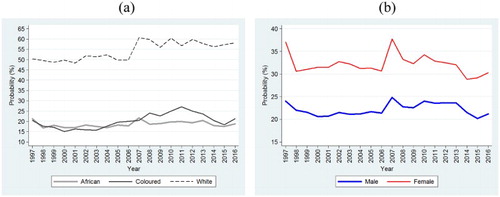
(a) shows that the probability of labour force participants finding employment in high-skilled occupations was higher for whites (about 55%) compared to Africans and coloureds (about 20%). This probability was approximately 10 percentage points higher for females during the 20-year period, as evidenced in (b). In 2016, this probability was about 30% and 20% for females and males respectively.
Figure 4. Probability of finding employment in high-skilled occupations, 1997–2016: (a) by population group; (b) by gender. Source: Own calculations using OHS 1997–1999, LFS 2000–2007 September, QLFS 2008–2015 Q4 and QLFS 2016 Q3 data.
in the Appendix presents the characteristics of the employed by race and gender in selected surveys and the key findings are as follows: the proportion of male employees declined for all race groups, yet the male share remained more dominant; the African share increased steadily over the years for both gender groups; the Gauteng share was most dominant for Africans and whites, but the Western Cape share was the highest for coloureds; the proportion of workers residing in Gauteng was most dominant (30%) for both genders; the mean years of educational attainment experienced an upward trend over the years for all gender and race groups, but the whites were significantly more educated (by about three years), while the females were significantly more educated than males by one year.
The composition of high-skilled employed by race and gender is presented in in the Appendix. The male share was significantly higher for whites. Most Africans and whites worked in Gauteng, but a higher proportion of coloureds worked in Western Cape. The African share increased between 1997 and 2015 for both genders, but it was significantly higher for females. Lastly, the high-skilled workers became more educated over the years, but whites and females were relatively more educated on average.
4.2. Multivariate analysis and Oaxaca–Blinder decomposition
While not the main focus of this study, the probit regressions on participation likelihood are shown in and of the Appendix. The probits on employment likelihood is what follows next in this section. This section also includes the Oaxaca–Blinder decompositions for the employment probits and high-skilled employment probits. For the econometric analysis, the focus would be on OHS 1995, LFS 2003, QLFS 2009 and QLFS 2015 (an equal 6-year interval between each two surveys).
4.2.1. The employment probability gap
presents the probit regressions on employment likelihood by race. Male Africans were significantly more likely to be employed, albeit a declining trend on the marginal effect (from 15.4 to 5.1 percentage points between 1997 and 2015). In general, as educational attainment increased there was a significant increase in employment likelihood for the Africans and Coloureds. Also, Africans residing in KwaZulu-Natal were significantly more likely to be employed compared with the reference group (Eastern Cape). Finally, being married and the head of household increased the likelihood of working while the increase of the number of children in a household reduced the African employment likelihood.
Table 1. Probit regressions on employment likelihood of labour force by population group, selected surveys.
The employment probits by gender are captured in . The results indicate that coloured, Indian and white were significantly more likely to be employed in both gender groups, with the marginal effects first increasing significantly between 1997 and 2003, before declining in 2009 and 2015. An increase in educational attainment is generally associated with an increase in employment likelihood for both genders. Furthermore, males residing in the Western Cape, KwaZulu-Natal, North West and Mpumalanga provinces were significantly more likely to be employed, while this was only true for females residing in Mpumalanga. Lastly, being a married head and having fewer children in the household significantly increased employment likelihood both genders.
Table 2. Probit regressions on employment likelihood of labour force by gender, selected surveys.
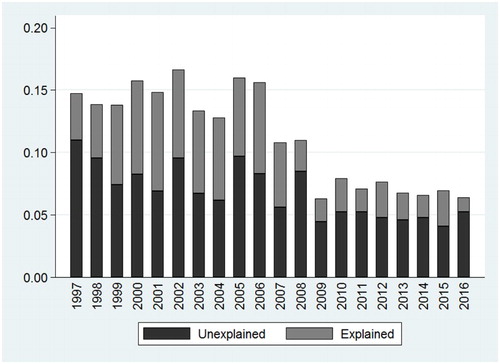
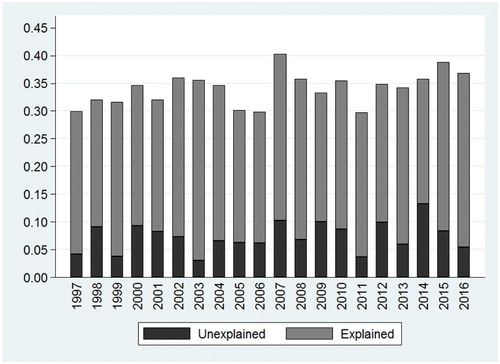
and in the Appendix show the white–African employment probability gap increased between 1997 and 2002, before a steady downward trend took place in 2002–2014. This gap was the lowest at 0.25 in 2014. The unexplained component as proportion of the employment probability gap increased slightly from 47.4% in 1997 to 52.3% in 2016, despite showing some fluctuations during the period under study (this proportion was the lowest at 40.4% in 2007). There is also no clear indication of a downward trend of this proportion. Looking at the white–coloured employment probability gap (), it increased between 1997 and 2005, after which it declined. The unexplained component fluctuated, and this component as proportion of total employment probability gap decreased from 69% in 1997 to a very low 29% in 2014, before abruptly rising to 83% in 2016 (see ).
Figure 5. Decomposition of average white–African employment probability gap, 1997–2016. Source: Own calculations using OHS 1997–1999, LFS 2000–2007 September, QLFS 2008–2015 Q4 and QLFS 2016 Q3 data.
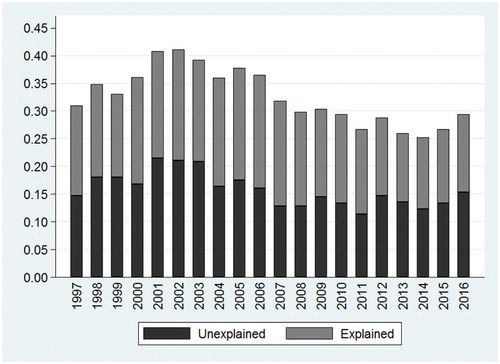
Figure 6. Decomposition of average white–coloured employment probability gap, 1997–2016. Source: Own calculations using OHS 1997–1999, LFS 2000–2007 September, QLFS 2008–2015 Q4 and QLFS 2016 Q3 data.
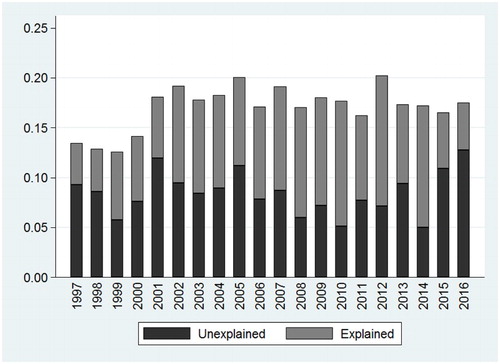
The male–female employment probability gap hovered around 0.15 in 1997–2006, then declined abruptly from 0.16 in 2006 to 0.06 in 2009, before it stabilised at the 0.06–0.08 range in 2010–2016 (). The unexplained component accounted for more than half of this gap in all years under study, except 2001 and 2004 (see ). The unexplained component was greater when compared to the findings by Burger & Jafta (Citation2010), but keep in mind that the latter study excluded those with less than incomplete secondary education.Footnote3
Figure 7. Decomposition of average male–female employment probability gap, 1997–2016. Source: Own calculations using OHS 1997–1999, LFS 2000–2007 September, QLFS 2008–2015 Q4 and QLFS 2016 Q3 data.
4.2.2. Occupational attainment differential
The probit regressions on the likelihood of formal sector employees involved in high-skilled occupations by race are presented in . Males were significantly less likely to be employed in high-skilled occupations for African workers. As expected, this likelihood increased as educational attainment increased. In particular, the Degree spline variable was statistically significant except for whites in 2009.
Table 3. Probit regressions on likelihood of employed involved in high-skilled occupations by population group, selected surveys.
shows the probit estimates by gender. Coloured, Indian and white males were significantly more likely to be employed in these occupations than African males in all four surveys, with the marginal effect being the greatest for whites. Generally, an increase in educational attainment is associated with a significant increase in the likelihood of involving in high-skilled occupations, except for the primary education spline variable. This likelihood was significantly higher for female married household heads in 1997 and 2015, while the results on the provincial dummies were somewhat mixed.
Table 4. Probit regressions on likelihood of employed involved in high-skilled occupations by gender, selected surveys.
and show an increasing high-skilled occupational attainment probability gap between whites and Africans. This gap was driven partially by an increase in the unexplained component, which is in line with the results found in Burger & Jafta (Citation2006). In fact, the share of the unexplained component increased from 25.1% in 1997 to 45.4% in 2016. In contrast, indicates that the total gap of the white–coloured occupational attainment likelihood increased between 1997 (0.30) and 2016 (0.37). Despite fluctuations over the years, the unexplained component share only accounted for about 20% of the total gap, on average, during the 20-year period.
Figure 8. Decomposition of average white–African high-skilled occupational attainment differential, 1997–2016. Source: Own calculations using OHS 1997–1999, LFS 2000–2007 September, QLFS 2008–2015 Q4 and QLFS 2016 Q3 data.
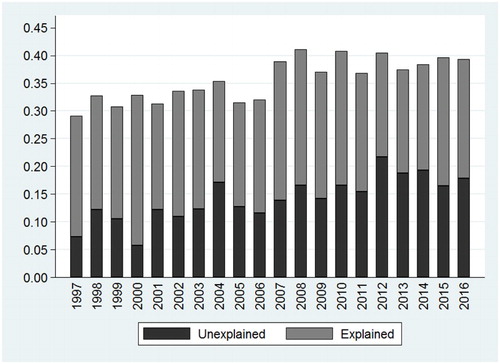
Figure 9. Decomposition of average white–coloured high-skilled occupational attainment differential, 1997–2016. Source: Own calculations using OHS 1997–1999, LFS 2000–2007 September, QLFS 2008–2015 Q4 and QLFS 2016 Q3 data.
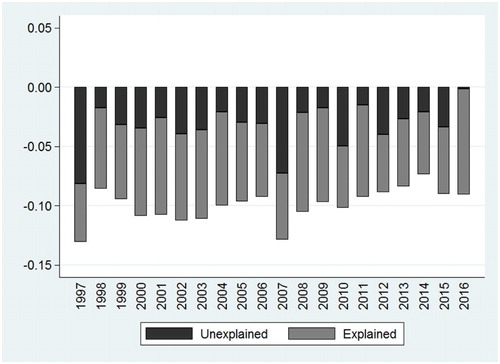
Finally, shows that females were more likely to find high-skilled work as they possessed stronger characteristics (negative explained components in all years). The unexplained component was also negative, but the share of explained component was more dominant in all but two years. These results imply that female workers were less likely to be discriminated against in attaining highly paid, higher-level positions.Footnote4
Figure 10. Decomposition of average male–female high-skilled occupational attainment differential, 1997–2016. Source: Own calculations using OHS 1997–1999, LFS 2000–2007 September, QLFS 2008–2015 Q4 and QLFS 2016 Q3 data.
5. Conclusion and recommendations
This study examined the impact of Affirmative Action on employment discrimination by gender and race. The study first estimated probit models, describing the labour force participation, employment and occupational attainment, followed by the Oaxaca–Blinder decomposition, using the 1997–2016 Stats SA labour survey data.
There was a downward trend in the white–African employment probability gap between 2002 and 2011. The unexplained component, despite showing a downward trend during the same period, still accounted for nearly half of the total gap. This suggests that employment discrimination against Africans remained prevalent. The unexplained component was also dominant when it comes to the decomposition of the white–coloured employment probability gap. Furthermore, the unexplained component was most dominant in the male–female employment gap, implying that employment discrimination against females was still serious. There was also an increasing occupational attainment gap between whites and Africans which was partially driven by an increase in the unexplained component. Finally, the econometric analysis showed clearly that a higher educational attainment was associated with significantly greater employment likelihood.
These findings, particularly the fact that race and gender still played an important role in determining employment likelihood, are in line with a recent statement made by the Chairperson of the Employment Equity Commission (EEC), Tabea Kabinda; she stated that historical stereotypes still existed, meaning white men still remain in the most powerful employment positions (Giokos & Mtyala Citation2016). Nonetheless, two positive findings emerged from this study: first, the unexplained component only accounted for about 20% of the white–coloured high-skilled occupational attainment differential; secondly, females were associated with a greater likelihood of finding employment in these occupations, and this result was mainly attributed by their stronger endowment of characteristics.
While reducing employment discrimination by gender and race via various labour market policies and legislations (such as Affirmative Action and BBBEE, as well as reduction of various types of labour market rigidities) remains important, great attention should also be given to improve not only the educational attainment (i.e. quantity) of the jobseekers, but the government needs to continue to improve the quality of education, particularly in the former black schools. Altman (Citation2005:7) as well as Festus et al. (Citation2015:2) both state that the disparities in the quality and access of educational attainment continue to negatively affect labour market prospects for most black South Africans.
Further policy recommendations include improving the ability and skills levels of workers. Considering the economy has shifted towards becoming more capital- and skills-intensive, the labour force in the economy needs to develop more appropriate skills to improve their employment likelihood. The implementation of the Expanded Public Works Programme (EPWP) contributes towards the skills acquisition of the workforce; however, further skills development policies are needed, for example, the integrated skills transfer suggestion by Festus et al. (Citation2015:21) in which the older generation passes on skills to the newer generations. Also, as poverty negatively impacts the ability of individuals to seek employment and even accept job offers, policies that aim at simplifying the job-seeking process for poor individuals are greatly encouraged. For instance, Bhorat (Citation2012:7–9) proposes a transport subsidy for unemployed youth in non-urban areas.
To conclude, while reducing employment discrimination remains crucial, great attention should still be given to improve the quality-adjusted education and skills level of the workseekers of the previously disadvantaged groups. In other words, reducing employment discrimination alone is not sufficient, but both the explained and unexplained components need to decline simultaneously, before there would be more speedy improvement of the previously disadvantaged groups’ employment prospects.
Disclosure statement
No potential conflict of interest was reported by the authors.
Notes
1 In all OHSs, LFSs and QLFSs, there are no questions asked to derive the test scores of the individuals.
2 From this point onwards, self-employed, employers, informal sector employees, agricultural employees and domestic workers are excluded from the analysis, as mentioned in Section 3.2.
3 Upon analysing the data, the proportion of labour force with less than incomplete secondary education was as low as 9% in 2015 but as high as 25% in 1998.
4 These results need to be interpreted by keeping in mind about the five groups of workers being excluded from the analysis (see Section 3.2). For instance, about 80% of domestic workers were females, whilst approximately 55% of employers and self-employed were females.
References
- Altman, M, 2005. A review of labour markets in South Africa: Research gaps-labour market function and policy in South Africa. HSRC employment and economic policy research programme. Human Science Research Council, Pretoria.
- Armstrong, P & Steenkamp, J, 2008. South African Trade Unions: An overview for 1995 to 2005. Stellenbosch Economic Working Papers: 10/08. Stellenbosch University, Stellenbosch.
- Bhorat, H, 2012. A nation in search of jobs: Six possible policy suggestions for employment creation in South Africa. DPRU Working Paper 12/50. Development Policy Research Unit, Cape Town.
- Bhorat, H & Goga, S, 2012. The gender wage gap in the post-apartheid South African labour market. DPRU Working Paper 12/148. Cape Town: Development Policy Research Unit, Cape Town.
- Bhorat, H, Lundall, P & Rospabe, S, 2002. The South African labour market in a globalising world: Economic and legislative considerations. ILO Employment Paper: 2002/32. International Labour Organisation, Geneva.
- Burger, R & Jafta, R, 2006. Returns to race: Labour market discrimination in post-apartheid South Africa. Stellenbosch Economic Working Paper: WP04/06. Stellenbosch University, Stellenbosch.
- Burger, R & Jafta, R, 2010. Affirmative action in South Africa: an empirical assessment of the impact on labour market outcomes. CRISE Working Paper 76. Centre for Research on Inequality, Human Security and Ethnicity, Oxford.
- Burger, C & Van der Berg, S, 2011. Modelling cognitive skills, ability and school quality to explain labour market earnings differentials. Stellenbosch Economic Working Paper: WP08/11. Stellenbosch University, Stellenbosch.
- Chamberlain, D & Van der Berg, S, 2002. Earnings functions, labour market discrimination and quality of education in South Africa. Stellenbosch Economic Working Paper: WP02/02. Stellenbosch University, Stellenbosch.
- Clarke, M, 2004. Ten years of labour market reform in South Africa: Real gains for workers? Canadian Journal of African Studies 38(3), 558–74.
- Department: Trade and Industry. 2014. Broad-based black economic empowerment. http://www.dti.gov.za/economic_empowerment/bee.jsp Accessed 12 July 2017.
- Essop, H & Yu, D, 2008. The South African informal sector (1997–2006). Stellenbosch Economic Working Papers 03/08. Stellenbosch University, Stellenbosch.
- Festus, L, Kasongo, A, Moses, M & Yu, 2015. The South African labour market, 1995–2013. ERSA Working Paper 493. Economic Research Southern Africa, Cape Town.
- Finnemore, M, 2009. Introduction to labour relations in South Africa. LexisNexis Butterworths, Durban.
- Giokos, H & Mtyala, Q, 2016. White males still baas. Cape Times. 24th April. Available: mini.iol.co.za/capetimes/white-males-still-baas-2013794 [Accessed 21 July 2016].
- Gomulka, J & Stern, N, 1990. The employment of married women in the United Kingdom 1970–1983. Economica 57(226), 171–99. doi: 10.2307/2554159
- Grün, C, 2004. Direct and indirect gender discrimination in the South African labour market. International Journal of Manpower 25(3–4), 321–42. doi: 10.1108/01437720410541425
- Grun, C, 2009. Racial and gender wage differentials in South Africa: What can cohort data tell? Proceedings of the German Development Economics Conference, Frankfurt.
- Hinks, T, 2002. Gender wage differentials and discrimination in the New South Africa. Applied Economics 34(16), 2043–52. doi: 10.1080/00036840210124991
- Muller, C, 2009. Trends in the gender wage gap and gender discrimination among part-time and full-time workers in post-apartheid South Africa. School of Economics and Finance Working Paper 124. University of KwaZulu-Natal, Durban.
- Ntuli, M, 2007. Exploring gender wage discrimination in South Africa, 1995–2004: A quintile regression approach. IPC Working Paper 56. International Policy Center, Michigan.
- Ntuli, M & Kwenda, P, 2014. Labour unions and wage inequality among African men in South Africa. Development Southern Africa 31(2), 322–46. doi: 10.1080/0376835X.2013.872984
- Oosthuizen, M, 2006. The post-apartheid labour market: 1995–2004. DPRU Working Paper 06/103. Development Policy Research Unit, Cape Town.
- Republic of South Africa, 1997. Basic conditions of employment Act 75 of 1997. Government Printer, Pretoria.
- Republic of South Africa, 1998. Employment equity Act 55 of 1998. Government Printer, Pretoria.
- Shepherd, D, 2008. Post-apartheid trends in gender discrimination in South Africa: Analysis through Decomposition Techniques. Stellenbosch Economic Working Papers 06/08. Stellenbosch University, Stellenbosch.
- Venter, R, Levy, A, Conradie, M & Holtzhausen, M, 2009. Labour relations in South Africa. Oxford University Press, Cape Town.
- Winter, C, 1999. Women workers in South Africa: participation, pay and prejudice in the formal labour market. South Africa: Poverty and Inequality Informal Discussion Paper Series 19752. The World Bank, Washington DC.
- Yu, D, 2013. Revisiting unemployment levels and trends in South Africa since the transition. Development Southern Africa 30(6), 701–23. doi: 10.1080/0376835X.2013.830242