ABSTRACT
The present study examines the public-private sector wage gap in South Africa using individual cross-sectional data for 2000–14. Results from unconditional quantile regressions and generalised Oaxaca–Blinder type decompositions show that the wage gap is an inverted-U shape across the wage distribution. The ‘composition effect’ is more important than the ‘price effect’ at the bottom of the distribution while the opposite applies at the top. Key factors underpinning the ‘composition effect’ are unionisation, industry of employment and education, while those associated with the ‘price effect’ are education, race and occupation.
1. Introduction
The peculiarly large burden of income inequality in post-apartheid South Africa has been met with the ‘one-handed’ finding that less wage dispersion is central in its reduction. Naturally, many research efforts have been expended towards understanding the role of apartheid-engineered wage dispersion factors. These encompass: wage discrimination; distribution of, and returns to, education (Branson et al., Citation2012); and labour unions (Schultz & Mwabu, Citation1998). Generally, these factors have been found to play a non-trivial role in current wage dispersion, though discrimination and institutions are waning in influence (Ntuli & Kwenda, Citation2014). Despite being educative, this literature largely overlooks the intricate link between the aforementioned factors and the South African government’s dominant role in employment; the public-sector is the largest single employer in the country (Woolard, Citation2002). Thus, South African studies of wage differentials need to be sensitive that the labour market is segmented into public- and private-sectors, inter alia. The importance of this divide is evident as the sectoral wage differential has been intensively (somewhat) explored for developed (developing) countries.Footnote1 While there is no outright consensus in the literature, many studies find a public-sector wage premium; albeit with some heterogeneity across demographic groups and percentiles of the wage distribution (e.g. Nielsen & Rosholm, Citation2001; Melly, Citation2005).
Only a few studies have investigated public-private sector wage differentials in South Africa; Woolard (Citation2002), Bosch (Citation2006) and Kerr and Teal (Citation2015). In line with international literature, these studies found evidence suggesting that the government has distributive effects on wages. This ensues through a wage premium, which tends to be largest in the middle of the wage distribution (Woolard, Citation2002). While these studies span recent methodological advancements in the literature; mean-based to distributive estimators, some methodological flaws are evident. For instance, Kerr and Teal (Citation2015) apply a mean-based fixed effects estimator to a panel dataset with a small number of movers across public- and private-sectors. This brings to question the study’s conclusion that the public-sector premium is an artefact of movers into, rather than out of, the sector. Woolard’s (Citation2002) distributive analysis uncovers interesting heterogeneities in the premium across the wage distribution. However, the study broadly attributes the premium to inferior endowments of productive characteristics among private-sector workers and returns thereof. This leaves us uninformed about the relative importance of each factor in explaining the premium. Yet, identifying the overall and each factor’s contribution to ‘composition’ and ‘price effects’ (sectoral wage differences due to observable characteristics and returns thereof, respectively) provides deeper insights into the mechanisms underpinning the sectoral wage gap. Moreover, due to data constraints, previous studies fail to provide concrete evidence on the temporal evolution of the sectoral wage gap.Footnote2 Given the possibility of different cyclical responsiveness of wages in the two sectors, a static analysis is quite restrictive (c.f. Borjas, Citation1984; Melly, Citation2005).
Against this backdrop, this study investigates the public-private sector wage gap in post-apartheid South Africa using a decomposition technique based on Firpo et al.’s (Citation2009) recentred influence function (RIF) regressions, and individual cross-sectional data for the period 2000–14. Our study is closest in spirit to Woolard (Citation2002) who provided a distributional analysis of the public-sector wage premium. Nevertheless, there are notable differences in respect to two aspects. First, using detailed decomposition techniques, the present study identifies the role played by a rich set of demographic, human capital and job characteristics in explaining the sectoral wage gap. We establish the overall, and each factor’s ‘composition’ and ‘price effects’ across the wage distribution. To some extent, the ‘composition effect’ indicates a sectoral difference in non-discriminatory characteristics, which propel the sectoral wage gap whereas the ‘price effect’ alludes to a discriminatory pay structure for a given characteristic. As such, the sectoral wage gap could be distortionary if the ‘price effect’ outweighs the ‘composition effect’. This is more so in South Africa given the history of labour market discrimination. Second, this study benefits from the use of comparable cross-sectional data spanning the period 2000–14. This allows exploring temporal developments in the sectoral wage gap – a less-well-known issue within the South African context. Overall, the present study provides an extensive analysis of the public-private sector wage gap, which is useful for understanding wage inequality in South Africa.
This article is organised as follows. In section 2, we provide a brief review of the public-sector and its link to wages in South Africa. The data and methodology are presented in section 3, while section 4 discusses the empirical results. Section 5 concludes.
2. The public-sector and wages in South Africa
In 1994, the post-apartheid South African government inherited an economy that was replete with race-based socioeconomic inequalities. Access to basic services, economic, and labour market opportunities were skewed along racial lines; with whites being more privileged followed by Indians, coloureds and blacks, respectively. The Gini coefficient of household income per capita was around 0.57 (Hoogeveen & Ozler, Citation2005). In addition, the public service was marred by policies and practices that could undermine the new government’s effectiveness. It was characterised by a lack of representativeness of all South Africans, conflicting labour relations, poorly paid and demotivated workers (Ministry for the Public Service and Administration, Citation1995). The dismal pay was partly due to an absence of formal wage negotiations in the public-sector pre-1994. Thus, transforming the public service for an effective service delivery to many, in quantity and quality, was an imperative for the country’s socioeconomic transformation. This was underpinned by policies and guidelines as per the Constitution of the Republic of South Africa (1996), the 1995 White Paper on the Transformation of the Public Service, the Code of Conduct for Public Servants, and the 1997 ‘Batho Pele’ (People First) initiative (Schwella, Citation2001).
As a response to the above measures, the government has since recruited many workers in priority areas across the skills spectrum, especially from previously disadvantaged groups. In line with the Employment Equity (1998) Act, skilled labour, recruited consciously for closing gender and racial imbalances in society, serves to strengthen the service-delivery process. It is also notable that effective service delivery required that the government embark on a ‘rightsizing’ programme, from 1996, to create a leaner and cost-effective public service (Schwella, Citation2001). Naturally, this reduced the size of the public service, especially among unskilled workers. This partly fuelled the unemployment problem in the country hence, the government embarked on job-creation programmes such as the Expanded Public Works, which has led to an increase in the public service around 2004; see (a). Thus, the government has become a dominant player in the labour market; accounting for around 20% of formal-sector employment and around 10% of total employment, see (b).
Figure 1: Evolution of employment, unionisation and wages in the public/private-sector. Notes: For graphs (a) and (b) 1995–2004 data is based on authors’ compilation from South Africa Department of Public Service Administration annual reports. For graphs (a) and (b), the public-sector comprises the national and provincial government only. Data for graphs (c) and (d) are based on authors’ calculations using the 2000–7 Labour Force Survey data and the 2010–14 Quarterly Labour Force Survey data. The public-sector comprises national-, provincial-, and local government as well as public enterprises.
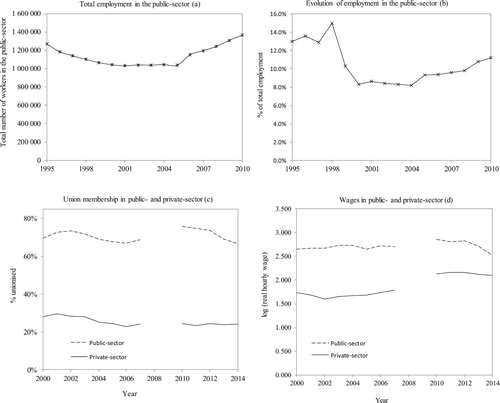
To complement the Employment Equity Act, the 1995 Labour Relations Act provides a framework for collective bargaining. This enables labour unions and employer organisations to bargain for wages and employment conditions, regardless of sector. However, union density is disproportionately higher in the public- (around 70%) than the private-sector (around 30%), see (c). Consequently, public-sector wages are mainly set through the collective bargaining process. This entails the Minister of Public Service and Administration setting the wage, which will then be negotiated by the relevant unions, at the Public Service Coordinating Bargaining Council (Clarke, Citation2007). It is worth mentioning that the South African labour unions movement is intricately linked to the ruling party due to complementarity of their efforts in resisting the apartheid regime. Hence, the unions are labelled as too powerful for the country’s level of income (Schultz & Mwabu, Citation1998). Unsurprisingly, wages are higher in the public- than the private-sector.
The given wage-setting process has several implications for the origins of the sectoral wage gap in South Africa. As an employer, the government succumbs to political pressure from labour unions – these are fundamental for increasing its electorate (Gunderson, Citation1979). Additional pressure emanates from equity concerns since it should be exemplary in the country’s pursuit of wage equality (Woolard, Citation2002; Altman, Citation2006). To some extent, this constrained position has a setback in terms of the foregone opportunity to pursue competitive or profit-based wage-setting procedures as in the private-sector (Gunderson, Citation1979). Consequently, the public-sector consistently pays more than the private-sector, see (d). This has raised concerns that the public-sector’s wage bill is too high and unsustainable, which poses serious threats to the national fiscus, labour-market efficiency and overall economic performance (International Monetary Fund, Citation2012; Rossouw et al., Citation2014). Taken together, it is vital that a rigorous evaluation of the underlying sources of the public-private sector wage gap in South Africa be undertaken.
3. Data and methodology
3.1. Methodology
This study utilises an Oaxaca (Citation1973) and Blinder (Citation1973) type detailed decomposition method based on Firpo et al.’s (Citation2009) recentred influence function (RIF) regressions to carry out a distributional analysis of the public-private sector wage gap. In RIF regressions, the outcome variable W (log of hourly wages for public- and private-sectors) is replaced by the RIF; whereby the influence function (IF) for the unconditional quantile of W
is expressed as:
(1) where
and I(.) represent the marginal density function of the wage distribution and an indicator function, respectively. A summation of the IF and
yields the RIF:
(2) The conditional expectation of the RIF can be modelled as a linear function of predictor variables, and the regression coefficients present marginal effects of the variables on quantiles of the wage distribution (Firpo et al., Citation2009), i.e.
. Given that the true RIF is unobservable, its sample analogy is utilised in empirical studies, i.e.
. An important theoretical property of the RIF is that its mean at the
quantile equals the unconditional quantile
(Firpo et al., Citation2009). This enables us to apply a generalised Oaxaca (Citation1973) and Blinder (Citation1973) decomposition across similar quantiles of public- and private-sector wage distributions (Fortin et al., Citation2011) as follows:
(3) where
and
are
quantiles of the marginal distributions of wages for public (P) and private (N) sectors, respectively.
and
are
quantile regression coefficients from RIF regressions for each sector.
and
are average characteristics for each sector. In (3), a and b represent components of the public-private sector wage differential
due to different endowments of observable characteristics ‘composition effect’ and different wage structures (coeffients) across the sectors ‘price effect’, respectively.Footnote3 These components can be further decomposed as follows to give partial contributions of the kth predictor variable:
(4) The detailed decomposition of the ‘price effect’ (b) has been controlled for the parameter invariace problem as per Yun (Citation2005). It is notable that the sectoral wage gap estimated herein might be biased by non-random selection of workers across sectors. As discussed earlier, the public-sector in South Africa potentially attracts workers with high ability or productivity relative to the private-sector. Thus, our sectoral wage gap estimates could be biased upwards. In this context, correcting for potential endogeneity of sector choice is important for estimating ‘true’ sectoral wage differences. However, this is a non-trivial exercise. Beyond the technical challenges of combining distributional analysis and correction for endogeneity, it is difficult to find valid instruments to explicitly model sector choice (Melly, Citation2005; Casale & Posel, Citation2011). Accordingly, the present study does not account for potential endogeneity of sector choice – our results do not have a causal interpretation, rather they provide a descriptive analysis of the sectoral wage gap.
3.2. Data
Our study uses the Post-Apartheid Labour Market Series (PALMS) dataset for the period 2000–14. This pooled dataset was developed by Kerr et al. (Citation2016) based on the Labour Force Surveys (LFS) and Quarterly Labour Force Surveys (QLFS) conducted by Statistics South Africa. The LFS is a bi-annual survey while the QLFS is a quarterly survey. These surveys are designed to collect detailed labour market information on a nationally representative sample. However, as highlighted by Branson and Wittenberg (Citation2014), the LFS and QLFS data are not directly comparable over time. Thus, the PALMS data harmonises the cross-sectional data using cross-entropy weights.
We restrict our sample of analysis to workers aged 16–59 years in paid employment. The lower bound age coincides with the age required to complete compulsory (junior secondary) education while the upper bound is consistent with the retirement age in South Africa. Self-employed workers are excluded to avoid potential biases due to self-selection and the usual difficulties in evaluating their wage. In the period 2008–9 the question on individual earnings was not asked, hence data for this period are excluded from the analysis. The earnings data are trimmed by dropping individuals with earnings that fall in the bottom and top 1% of the distribution to deal with the problem of reporting errors. We also exclude individuals with missing information on any of our key variables. Notably, for 2010 quarter 1 and 2 there is no information on union membership. Consequently, these periods are excluded from our analysis. Thus, our data spans the period 2000–7 (LFS) and 2010 quarter 2–2014 quarter 4 (QLFS). After cleaning the data, we are left with a final sample of 385 032 workers with 91 164 (24%) in the public-sector and 293 868 (76%) in the private-sector. A public-sector employee is defined as one employed in a parastatal, or national-, provincial- and local-government, while a private-sector employee is one in a private business; this excludes organisations such as business leagues, cooperatives and non-governmental organisations.
The LFS and QLFS provide detailed information on an individual’s gross earnings in the primary job and the corresponding hours worked per week. This is used to construct gross hourly wages deflated to 2000 values using the consumer price index. Due to data constraints, we only use information on individuals who report earnings in point form rather than brackets. We reweight the wages to account for the non-randomness of bracket responses, using weights published in PALMS data. in the Appendix provides a detailed description of the other variables used in our estimations, while presents descriptive statistics of the sample. On average, wages are significantly higher in the public- than private-sector by 0.693 log points. Surprisingly, the public-sector wage advantage is higher for men than it is for women.
Table 1. Descriptive (average) statistics.
To fully describe the public- and private-sector wages, Panels (a) and (b) in depict the kernel density estimates of the public- and private-sector wage distributions in aggregate and for selected years. Panel (a) shows that the wage distributions in the two sectors are fundamentally different. In particular, the mass of the public-sector distribution lies to the right of the private-sector’s and is more peaked than the private-sector’s. Clearly, wages are higher in the public- than in the private-sector; regardless of gender. This conclusion holds when the wage distributions are estimated for selected years; 2000, 2007 and 2014. However, the variance in public-sector wages has been increasing over time, which alludes to less wage compression over time. This could be due to a temporal increase in the outsourcing of workers by the public-sector such that some private-sector workers misreport themselves as public servants.
Figure 2: Kernel density estimates of public- and private-sector wage distributions.
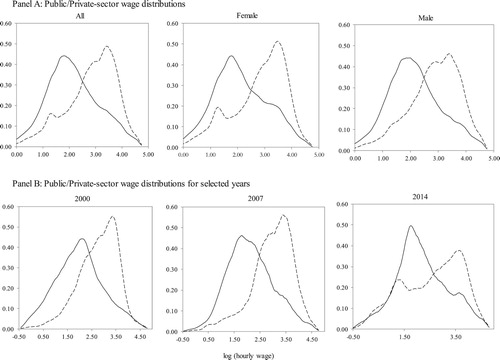
The disparities exhibited in are potentially due to differences in workers’ characteristics across sectors. Indeed, shows that a higher proportion of public-sector workers are women, black, older and married compared to those in the private-sector. In addition, the education distribution is skewed in favour of the public-sector. For instance, 43% of workers in the public-sector have a diploma or a degree compared to 13% in the private-sector. Consistent with the education distribution, the public-sector has a higher proportion of workers in white-collar occupations (i.e. professionals, technical and clerical) while private-sector workers are mainly in blue-collar occupations (i.e. crafts and related trades, machine operation and elementary work).
Further, workers in the public-sector are more likely to be unionised, have longer job tenure and be more concentrated in larger establishments than private-sector workers. Marked differences also exist in economic activities across sectors. For example, the dominant employer in the public-sector is social and community services, while that in the private-sector is wholesale, retail and trade. Evidently, the demographic, skill and occupational profiles differ considerably across the two sectors.
4. Empirical results
4.1. Unconditional quantile regression results
and present estimates from OLS and RIF regressions for the public- and private-sectors, respectively. To streamline the discussion, we focus on the results for the mean, bottom (10th percentile), middle (50th percentile) and top (90th percentile) of the wage distribution. Generally, after controlling for observable characteristics there is a gender wage penalty to the disadvantage of women; this tends to be larger in the private- than the public-sector, except at the bottom. This result is consistent with findings in previous studies (Gregory & Borland, Citation1999; Woolard, Citation2002). The results for age show the usual positive but declining effect on wages; this strengthens with percentiles of the distribution. The findings for race harmonise with South Africa’s racial wage hierarchy. Across the distribution, the racial wage disparities are higher in the private- than the public-sector, especially at the top.
Table 2. OLS and unconditional quantile regression results for the public-sector.
Table 3. OLS and unconditional quantile regression results for the private-sector.
For education, the returns are generally positively correlated to the echelons, in line with human capital theory. However, the magnitudes tend to vary within and across sectors. On average, returns to all levels of education tend to be higher in the private- relative to the public-sector. However, at the bottom of the distribution, returns to higher levels of education are relatively higher in the public-sector while at the top, returns to all levels of education are higher in the private-sector. Within the public-sector, all levels’ returns tend decline as a function of percentiles of the wage distribution, while in the private-sector divergent patterns emerge for high and low education levels. Returns to low (high) levels of education tend to be negatively (positively) correlated with percentiles of the distribution. As such, the within-sector effect of education is to compress (disperse) wages in the public (private)-sector while the between-sector effect is to disequalise wages.
Logically, union membership yields a wage premium (penalty) on average and at the bottom (top) of the distribution in both sectors. In line with our descriptive analysis, the union premium is higher in the public- than in the private-sector. Overall, unions tend to reduce wage dispersion within sectors and at the same time induce sectoral wage disparities, particularly at the bottom.
Further, the results reveal an inverted U-shaped wage tenure profile, for both sectors. Also, we find that large firms pay more than smaller firms. We uncover considerable sectoral differences in returns to occupation and industry. The case for all occupations shows higher returns at the bottom of the public-sector distribution, while at the top, white-collar occupations have higher returns in the private-sector. For industry, the results are not robust. More generally, at the bottom, highest-paying industries in the public-sector are social services and utilities; this extends to mining and utilities in the private-sector.
4.2 Overall decomposition of the wage gap
As outlined in equation 3, we decompose the total wage gap into the ‘composition effect’ and the ‘price effect’. Results of the decomposition are presented in . and also provide a summary of the results for selected points of the wage distribution. As discussed earlier, the total wage gap exhibits an inverted U-shape. Figure 3 shows that at the 10–30th percentiles, the wage gap is entirely due to the ‘composition effect’ rather than the ‘price effect’. In fact, returns to workers’ characteristics serve to narrow the wage gap as indicated by the strong negative ‘price effect’. This finding is contrary to anecdotal evidence suggesting that high public-sector wages, particularly at the bottom of the distribution, are due to higher returns in the public-sector. We argue that the wage gap at the bottom is fully attributable to inferior endowments among private-sector workers. This compositional effect, however, declines across the distribution, although it remains the predominant driver of the wage gap up to the 60th percentile. Thereafter, the wage gap is largely due to the ‘price effect’; accounting for 65% of the total gap at the 90th percentile.
Figure 3: Decomposition of the public-private sector wage gap.
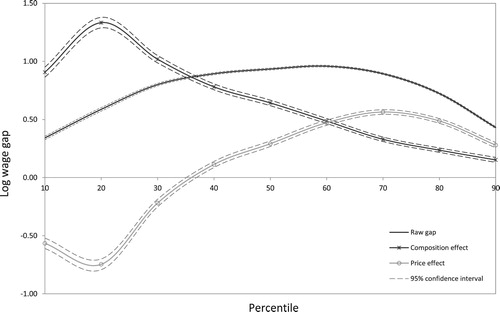
Table 4. Detailed decomposition of the sectoral wage gap: ‘composition effects’.
Table 5. Detailed decomposition of the sectoral wage gap: ‘price effects’.
The results for the wage gap uncovered here are quite different from those reported in previous South African studies. Bosch (Citation2006) reports an average public-sector wage premium of 35% while Kerr and Teal (Citation2015) find a premium of 52–62%. A considerably lower wage premium of 13–19% across the distribution is found by Woolard (Citation2002). In contrast, this study finds a substantial wage premium of 34–93% across the distribution. These vast differences are possibly due to differences in sample restriction and methodologies used.
4.3 Detailed decomposition of the wage gap
Based on equation 4, the ‘composition’ and ‘price’ effects, are further decomposed to show the contribution of each covariate. and , respectively, show results for these effects. The total effect of each covariate is presented in in the Appendix. Our discussion will consider the 10–30th percentiles as representing the lower end of the wage distribution while 70–90th percentiles represent the upper end.
Results show that, on average, the overrepresentation of women in the public-sector serves to narrow the wage gap by about 2.5% points. At the lower end, this effect ranges between 3% and 5% points while at the upper end it lies between 1% and 2% points. However, the gender ‘composition effect’ is weakened (reinforced) by the corresponding positive (negative) ‘price effect’ at the 70–90th (10–30th) percentiles. As a result, gender serves to narrow the wage gap at the bottom while its effect is negligible at the top (see in the Appendix).
For other demographic characteristics, we find that compositional effects linked to age, marital status and race have a trivial effect throughout the distribution – collectively accounting for less than a 1% point of the gap. Conversely, the ‘price effects’ associated with these covariates tend to be important. For instance, returns to age serve to reduce the gap by 21% points on average. The effect is much larger at the bottom compared to the top of the distribution. An opposite effect is uncovered at the 30–70th percentiles where returns to age tend to increase the wage gap by 4–23% points. In addition, returns to race mostly serve to widen the wage gap. The importance of race steadily increases across the wage distribution from 2–21% points. This suggests that, if the pay structure for race is equalised in both sectors, the wage gap would be considerably lower at the upper end of the wage distribution. We note that this result is mainly driven by the return associated with black South Africans.
Further, the results indicate that differences in educational endowments contribute positively to the wage gap at the mean and across the distribution. However, the effect is inversely related to percentiles of the distribution – accounting for 68% (29%) of the gap at the 10th (90th) percentile. This ‘composition effect’ is generally underpinned by endowment differences related to higher education (diploma and degree). Interestingly, at the lower (upper) end of the distribution, the ‘composition effect’ is partly counteracted (reinforced) by returns to education. The total effect of education hovers around 17% points for the first half of the wage distribution, but consistently increases (16–31% points) for the remainder of the distribution.
In the case of labour unions, both ‘composition’ and ‘price’ effects work to increase the gap on average and at the lower end of the distribution. Notably, the ‘composition effect’ outweighs the ‘price effect’. For instance, at the 10th percentile (on average) 89% (17%) of the total gap is due to underrepresentation of private-sector workers in unions, while 38% (4%) is due to sectoral differences in the union premium. However, demonstrates that the total effect of unions is attenuated at higher percentiles. The effect of tenure follows a similar pattern across the distribution, and in ‘composition’ and ‘price’ effects; albeit the union effect is relatively stronger.
Results also show that, for the first half of the distribution, sectoral differences in the industrial distribution of workers serve to increase the gap, however the ‘price effect’ is negligible. In particular, if the private-sector had a similar industrial configuration to that of the public-sector, the gap will be lower by 10% points, on average. This effect is much more pronounced at the bottom where the gap would be lower by 27–30% points. In contrast, the gap would be higher by 4–6% points at the top. As for occupation, compositional differences increase the gap throughout the distribution. If workers in the private-sector had a similar occupational distribution as their public-sector counterparts, the wage gap will be lower by 4–16% points.
The occupational wage structure counteracts the ‘composition effect’ in the first half of the distribution but strengthens it thereafter. Consequently, illustrates that the total effect of occupation enhances the wage gap, with the effect increasing across the wage distribution. Results also show a small positive (negative) compositional (‘price’) effect associated with firm size. Location serves to narrow the wage gap through the ‘price effect’, the ‘composition effect’ is, however, smaller and mixed. The total effect weakens from −2% points to −7% points from the top to the bottom of the distribution.
Concerning the relative importance of the covariates in explaining the wage gap, we find that unions, tenure and industry have a relatively large effect at the bottom of the distribution. This is largely driven by their ‘composition’ rather than their ‘price’ effects. Age emerges as the dominant driver of the gap at the middle of the distribution through its ‘price effect’. Race and occupation also play a crucial role through their ‘price’ and ‘composition’ effects, respectively. Lastly, at the top of the wage distribution, race and occupation are the dominant explanatory factors through their ‘price effects’. Notably, education propels the gap across the distribution; except for the 90th percentile the ‘composition effect’ dominates the ‘price effect’.
4.4 Temporal developments
In our preceding estimates, we simply control for time period. To explicitly trace out temporal developments in the wage gap and its underpinning factors, this section re-estimates the decompositions for each year, separately. Results of this exercise are presented in and .
Table 6. The public-private sector wage gap over time, 2000–14.
Table 7. Decomposition of the public-private sector wage gap over time, 2000–14.
Our results show that in 2000, the sectoral wage gap stood at 84%, on average. This increased significantly to 100% points in 2003, declining thereafter to 40% in 2014. A similar trend is observed for the 10th, 50th and 90th percentiles, though with slightly different dates at which the upward trend is reversed. The initial increase in the wage gap and its subsequent decrease is to some extent consistent with structural developments in the public-sector. For instance, in the early 2000s, the public-sector was geared towards attracting highly qualified workers – this possibly explains the increasing wage gap. The subsequent narrowing of the wage gap possibly reflects government’s attempts towards fiscal austerity.
Now turning to ‘composition’ and ‘price’ effects; we find that on average, the ‘composition effect’ tends to widen the wage gap across all time periods. Although punctuated with some fluctuations, the importance of the ‘composition effect’ in explaining the wage gap increased over time. In 2000, 80% of the wage gap was attributable to the ‘composition effect’, this increased to 125% in 2014. We also note that, although the ‘price effect’ waned in influence over the period; its effect between 2000 and 2011 (2012 and 2014) was to widen (reduce) the wage gap, on average. Remarkable in is the temporal increase in the influence of the ‘composition effect’ (‘price effect’) in explaining the wage gap at the bottom (top) of the wage distribution; barring 2013–14 for the ‘price effect’. In contrast, a lot of fluctuations characterise the evolution of ‘composition’ and ‘price’ effects at the median of the distribution. In light of the patterns uncovered here, we remark that it is challenging to clearly link our results to South Africa’s electoral and/or economic cycles.
4.5 Discussion of results
This paper has established that the total public-private sector wage gap in South Africa follows an inverted-U shape across quantiles of the wage distribution. Thus, the wage differential is highest in the middle of the distribution. Based on our baseline model, we find that the wage gap at the bottom of the distribution is fully explained by sectoral differences in observed characteristics, while that at the top is largely due to the ‘price effect’. On the one hand, it is noteworthy that the wage gap at the bottom of the distribution is due to better (inferior) characteristics among public (private)-sector workers. Inference can be drawn that the public-sector is able to attract workers with better endowments, in line with their mandate for improved service delivery – the ‘Batho Pele’ initiative. On the other hand, assuming that the private-sector sets competitive wages, our results suggest that the public-sector pay structure tends to penalise (reward) those at the bottom (top). This is contrary to the usual result of wage compression in the public-sector (c.f. Melly, Citation2005).
On a positive note, we find that the ‘composition effects’ of race and gender – dimensions historically used to sort workers into the labour market – play a trivial role in explaining the sectoral wage gap. To some extent, this shows that affirmative action policies have reduced gender and racial imbalances in the labour market. Nonetheless, education, unions, tenure and industry emerge as inequality enhancing characteristics in this context. This result implies that sectoral differences in employment stability, functions, and institutions underlie the gap at the lower end of the distribution. Based on these results, it can be inferred that the gap at the bottom of the distribution is an artefact of structural configurations of the sectors; hence, its existence raises little alarm. However, in the case of unions, the gap calls for an extension of coverage among private-sector workers; to strengthen their voice in wage negotiations. Similarly, the private-sector’s distribution of human capital can benefit from capacity-building initiatives to increase the pool of workers with better education.
In the middle of the distribution, age (‘price effect’), race (‘price effect’), and occupation (‘composition effect’) play a significant role in explaining the sectoral wage gap. An exceptional finding pertains to age whose ‘price effect’ is hump-shaped across the distribution; in line with the life-cycle hypothesis. The public-sector penalty at the tails of the distribution is possibly associated with younger and older workers’ timing of entry to the labour market. Arguably, younger workers lack experience, which is highly valued in the public-sector. As for older workers, they might have not benefitted significantly from post-apartheid interventionist policies as these were instituted later in their career trajectories. However, the positive ‘price effect’ for their private-sector counterparts could possibly be due to selection effects; they managed to join the sector when it was highly restrictive. Compared to the top, race and occupation play an important role in the middle but have a more pronounced ‘price effect’ at the top of the distribution. To some extent, this finding can be understood in light of the public-sector’s quest to retain highly-skilled workers, especially black South Africans.
At large, the findings uncovered here are not an artefact of data pooling over the years as we have established that they are sustained when estimates are conducted separately for each year. Nonetheless, we discovered that the gap increased over the period 2000–03 and declined thereafter. Regarding the ‘price effect’ we find no clear patterns that can link the wage gap to South Africa’s electoral and/or economic cycles. It appears as though South Africa’s public-sector wage determination processes are more complex and cannot be fully uncovered by the present analysis.
5. Conclusion
This study sets out to investigate the public-private sector wage differential in South Africa using individual cross-sectional data for 2000–14. We provide a comprehensive distributional analysis based on RIF regressions and a generalised Oaxaca–Blinder decomposition, to shed light on sources of the sectoral wage gap. Results show a total wage gap, which is largest in the middle of the wage distribution. The gap, however, declined over the period 2003–14. At the bottom of the distribution, the gap is attributable to sectoral differences in characteristics, while differences in prices mainly explain that at the top. Further, we find that ‘compositional effects’ of job characteristics (unions, tenure and industry) explain a relatively large fraction of the gap at the bottom. Conversely, ‘price effects’ for race, education and occupation explain a significant portion of the gap at the top. In the middle of the distribution, the wage gap is mainly driven by ‘price effects’ associated with age and race, and a ‘compositional effect’ of occupation. Notably, education consistently plays a crucial role throughout the distribution.
Generally, the gap is worrisome when it is largely driven by ‘price’ rather than ‘composition’ effects as this could be partly due to discrimination. In this context, our results suggest some concern about the gap at the top of the wage distribution. Strategies to attenuate the sectoral wage gap may focus on ‘synchronising’ pay scales along race, education and occupational lines. We believe that these measures might go a long way in reducing the sectoral wage gap, and the ensuing income inequality in the country. Nevertheless, we remark that the entire public-private sector wage gap cannot be eradicated as it partly emanates from structural configuration inherent in the sectors, e.g. differences in industrial and occupational compositions of the sectors.
Our study has three main limitations. First, the RIF regressions herein may suffer from sample-selection bias due to data limitations. For instance, workers with better unobserved characteristics may self-select into the public-sector. In this case, our results for the sectoral wage gap could be biased upwards. Second, the study does not comprehensively control for firm-level characteristics, which might influence wages, due to data issues. Third, we can only identify areas where public-private sector wage structures require synchronisation, but our methodology precludes us from specifying the ‘fair’ wage regime that should be used for the process. Future studies can benefit from addressing these limitations.
Disclosure statement
No potential conflict of interest was reported by the authors.
Additional information
Funding
Notes
1 See for instance Smith (Citation1976) for the United States, Disney and Gosling (Citation1998) for the United Kingdom, Melly (Citation2005) for Germany, Mizala et al. (Citation2011) for Latin America, Nielsen and Rosholm (Citation2001) for Zambia, and Hyder and Reilley (Citation2005) for Pakistan.
2 Bosch (Citation2006) provides estimates for one point in time, Kerr and Teal’s (Citation2015) analysis is not nationally representative, it considers one province out of the country’s nine provinces, and the 1995 and 2000 data used by Woolard (Citation2002) is not comparable over time.
3 The ‘composition effect’ resembles the explained component whereas the ‘price effect’ resembles the explained component of the wage gap in the conventional Oaxaca (Citation1973) and Blinder (Citation1973) decomposition approach.
References
- Altman, M, 2006. Low skill work in South Africa. Paper Presented to IZA/World Bank Conference on Employment and Development, 25–27 May 2006, Berlin, Germany.
- Blinder, AS, 1973. Wage discrimination: Reduced form and structural estimates. The Journal of Human Resources 8, 436–455. doi: 10.2307/144855
- Borjas, GJ, 1984. Electoral cycles and the earnings of federal bureaucrats. Economic Inquiry 22, 447–59. doi: 10.1111/j.1465-7295.1984.tb00698.x
- Bosch, A, 2006. Determinants of public and private sector wages in South Africa. Research Department, South African Reserve Bank, South Africa, Pretoria.
- Branson, N & Wittenberg, M, 2014. Reweighting South African national household survey data to create a consistent series over time: A cross-entropy estimation approach. South African Journal of Economics 82, 19–38. doi: 10.1111/saje.12017
- Branson, N, Garlick, J, Lam, D & Leibbrandt, M, 2012. Education and inequality: The South African case. A Southern Africa Labour and Development Research Unit Working Paper Number 75. South Africa: University of Cape Town.
- Casale, D & Posel, D, 2011. Unions and the gender wage gap in South Africa. Journal of African Economies 20, 27–59. doi: 10.1093/jae/ejq029
- Clarke, AR, 2007. Public service labour relations: Centralised collective bargaining and social dialogue in the public service of South Africa, 1997 to 2007. University of the Western Cape, South Africa, Bellville.
- Disney, R, & Gosling, A, 1998. Does it pay to work in the public sector? Fiscal Studies 19, 347–74. doi: 10.1111/j.1475-5890.1998.tb00291.x
- Firpo, S, Fortin, NM & Lemieux T, 2009. Unconditional quantile regressions. Econometrica 77, 953–73. doi: 10.3982/ECTA6822
- Fortin, MN, Lemieux, T & Firpo, S, 2011. Decomposition methods in economics. In Ashenfelter, O & Card, D (Eds.), Handbook of labor economics, 4. North Holland, Amsterdam, 1–102.
- Gregory, RG & Borland, J, 1999. Recent developments in public sector labor markets. In Ashenfelter, O & Card, D (Eds.), Handbook of labor economics, 3. Elsevier, Amsterdam, The Netherlands, 3573–630.
- Gunderson, M, 1979. Earnings differentials between the public and private sectors. The Canadian Journal of Economics, 12: 228–42. doi: 10.2307/134598
- Hoogeveen, JG & Ozler, B, 2005. Not separate, not equal: Poverty and inequality in post-apartheid South Africa. Working Paper 379. William Davidson Institute, Ann Arbor.
- Hyder, A & Reilly, B, 2005. The public and private sector pay gap in Pakistan: A quantile regression analysis. The Pakistan Development Review 44, 271–306. doi: 10.30541/v44i3pp.271-306
- International Monetary Fund, 2012. South Africa 2012 Article IV Consultation. IMF Country Report No. 12/247. International Monetary Fund, Washington, DC.
- Kerr, A & Teal, F, 2015. The determinants of earnings inequalities: Panel data evidence from KwaZulu-Natal, South Africa. Journal of African Economies 24, 530–58. doi: 10.1093/jae/ejv006
- Kerr, A, Lam, D & Wittenberg, M, 2016. South Africa-post apartheid labour market series 1993–2015. University of Cape Town: Data First, Cape Town.
- Kwenda, P & Ntuli, M, 2015. A detailed decomposition analysis of the public-private sector wage gap in South Africa, IZA Discussion Paper No. 9271, Institute for the Study of Labor. Link: http://ftp.iza.org/dp9271.pdf.
- Melly, B, 2005. Public-private sector wage differentials in Germany: Evidence from quantile regression. Empirical Economics 30, 505–20. doi: 10.1007/s00181-005-0251-y
- Ministry for the Public Service and Administration, 1995. The white paper on the transformation of the public service notice 1227 of 1995.
- Mizala, A, Romaguera, P & Gallegos, S, 2011. Public-private wage gap in Latin America (1992–2007): A matching approach. Labour Economics 18, S115–S131. doi: 10.1016/j.labeco.2011.08.004
- Nielsen, HS & Rosholm, M, 2001. The public-private sector wage gap in Zambia in the 1990s: A quantile regression approach. Empirical Economics 26, 169–82. doi: 10.1007/s001810000051
- Ntuli, M & Kwenda, P, 2014. Labour unions and wage inequality among African men in South Africa. Development Southern Africa 31, 322–46. doi: 10.1080/0376835X.2013.872984
- Oaxaca, R, 1973. Male-female wage differentials in urban labor markets. International Economic Review 14, 693–709. doi: 10.2307/2525981
- Rossouw, J, Joubert, F & Breytenbach, A, 2014. South Africa's fiscal cliff: A reflection on the appropriation of government resources. Journal of Humanities 54, 144–162.
- Schultz, TP & Mwabu, G, 1998. Labor unions and the distribution of wages and employment in South Africa. Industrial Labour Relation Review 51, 680–703. doi: 10.1177/001979399805100407
- Schwella, E, 2001. Public sector policy in the new South Africa: A critical review. Public Performance and Management Review 24, 367–88. doi: 10.2307/3381225
- Smith, S, 1976. Pay differentials between federal government and private sectors workers. Industrial and Labour Relations Review 29, 233–57. doi: 10.1177/001979397602900206
- Woolard, I, 2002. A Comparison of wage levels and wage inequality in the public and private Sectors, 1995 and 2000. Development Policy Research Unit, Working Paper 02/62.
- Yun, M-S, 2005. A simple solution to the identification problem in detailed wage decompositions. Economic Inquiry 43, 766–72.
Appendix
Table A1. Variable definitions.
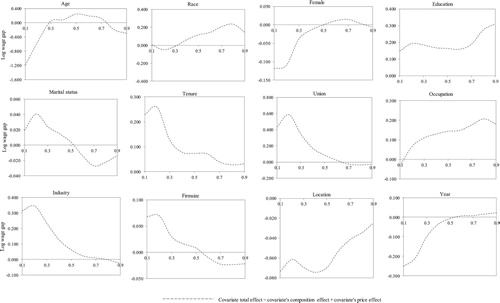
Figure A1. Factor total effects.