
ABSTRACT
A survey was undertaken in 2016 of key informants in seven Sub-Saharan African countries about why there had been limited greening of industry in their countries. The results of this survey, combined with analysis of earlier studies drawn from a focused SSA literature review, find a multitude of relevant factors that act as drivers for, barriers to, and enablers for changing managerial attitudes and strategies on greening. The dominant cluster of drivers involves material costs, both the high costs of inputs and the related need for cost savings. The dominant cluster of barriers relates to the lack of information. Enablers, who play an important and essential role in lowering the barriers in firms to greening, figure weakly in the 11 reports considered. This possibly reflects the lack of effective government programmes that are essential for accelerating the greening of industry as called for in the United Nations Sustainable Development Goals.
1. Introduction
On the margins of the Global Network Conference on Resource Efficient and Cleaner Production organised by the United Nations Industrial Development Organization (UNIDO) and the United Nations Environment Programme (UNEP) (Davos, 12–16 October 2015), several directors of National Cleaner Production Centres (NCPCs) in Sub-Saharan African (SSA) countries met to discuss the findings of a survey that underlies a 20-year retrospective of the UNIDO/UNEP NCPC programme (Luken et al., Citation2016).Footnote1 In particular, the NCPC directors focused on the survey findings that the outreach to manufacturing enterprises had not resulted in a significant greening of specific manufacturing sectors with the implementation of cleaner production (CP) techniques and technologies. They estimated that their efforts had reached less than 5 percent of the manufacturing plants in their countries.
Their perception of limited greening of the manufacturing sector was echoed in the findings of two earlierstudies undertaken by UNIDO that assessed the implementation of CP measures in developing countries. The first was an investigation of the uptake of energy-efficient technologies in South Africa. It was undertaken in 2009, seven years after the South African NCPC had started operations. The authors found limited diffusion of energy-efficient measures (one of the most frequently implemented measures in CP implementation). Only three of the 13 textile mills included in the study had ever used the services of the NCPC, while 16 of the 17 automotive component manufactures included in the study had never heard of the Centre (Morris et al., Citation2011). The second study was a survey of 9,000 production units in Vietnam, undertaken in 2010/2011. Despite the presence of an active NCPC funded by the Government of Switzerland for more than 10 years, as well as of a separately funded CP programme by the government of Denmark, the survey found that only 1,030 enterprises had applied CP measures, equivalent to 11 percent of the surveyed enterprises (UNIDO, Citation2012).
In response to the concerns voiced at the conference in Davos as well as those raised by the above-mentioned two UNIDO-funded studies, we undertook a study focused on what is known about the drivers for and barriers to the greening of industry in the SSA region. Currently, there are only a limited number of SSA studies, all of which are single-country focused. Thus, our research has three objectives:
identify the dominant drivers for, and barriers to, the limited greening of industry across SSA countries through a focused literature review of past SSA surveys and the completion of a new multi-country SSA survey;
propose modifications in the standard drivers and barriers conceptual framework to reduce some of the methodological uncertainties in the manner in which industry regulators and service providers, including NCPCs, frame their interventions to influence drivers and barriers; and
recommend what can realistically be done to accelerate the greening of industry as called for in the UN Sustainable Development Goals by industry regulators and service providers, including NCPCs, recalling that their essential role is as enablers that lower the barriers which firms face in implementing resource efficiency measures.Footnote2
For this research, we limit our definition of greening industry to any activity by which the processes of manufacturing industry improve their efficiency of energy, water, and raw materials used to reduce pollutant discharges and improve compliance with environmental norms. We exclude the literature about the other two dimensions of greening as proposed by UNIDO (Citation2011a), namely, installing pollution control technologies and shifting to the greater use of renewable energy, both of which involve physical resources, investment, and monitoring, while the focus here is primarily on managerial attitudes and strategies. Thus, we focus on the literature that defines ‘CP as the continuous application of an integrated, preventive environmental strategy towards processes, products, and services in order to increase overall efficiency and reduce damage and risks for humans and the environment.’ (UNIDO & UNEP, Citation2010: 4).
2. Literature review
The literature review starts with a brief summary of representative, but not SSA specific, literature about barriers and drivers in the fields of energy efficiency (EE), cleaner production (CP), and cleaner technology (CT).Footnote3 It then turns to the all the literature that could be found about drivers for, and barriers to, implementation of CP measures (primarily energy efficiency) in SSA countries, of which there are few.
A representative review of factors, in this case limited to barriers to the implementation of energy-efficiency measures, can be found in the UNIDO Industrial Development Review (UNIDO, Citation2011b). The review, based on the work of Sorrel et al. (Citation2011), considers economic, organisational, and behavioural barriers in terms of market failures, limitations of human decision-making (bounded rationality), and various hidden costs. A similar list of key barriers (and remedial policy tools) is reported in the World Energy Outlook (IEA, Citation2012). The barriers are grouped into five broad categories: visibility (no measurement), priority (low awareness), economic (finance and subsides), capacity (limited know-how in plants and government support), and fragmentation (diverse end-users).
A representative review, this time about CT, is the special issue of the Journal of Cleaner Production on CT diffusion that brings together a heterogeneous mix of papers (Editorial, Citation2008). The authors of the editorial conclude that innovation diffusion is governed by both endogenous and exogenous mechanisms. Examples of endogenous mechanisms are information transfer and improvements in technology; examples of exogenous mechanisms are changes in prices and regulatory frameworks.
The representative literature review finds that those studies that focus on hard technique and technology responses (CP, EE, CT) offer more insight into the issues discussed in this paper than those which investigate soft responses such as corporate social responsibility (Bagie et al., Citation2011; Mzembe et al., Citation2016) and corporate sustainability (Lozano, Citation2015). It also classifies barriers and drivers as either internal (firm-level characteristics) or external (contextual factors). Firm-level characteristics include organisational and environmental strategy, technological competencies, financial position, size, access to financing, and the training levels of the workforce. Contextual factors are socio-political and economic factors acting as incentives or deterrents to adoption of EE/CP/CT measures; they include environmental regulation, markets, equipment suppliers, and communities.
Our in-depth literature search for SSA-focused surveys found only 10 articles and reports. They are listed in the chronological order of their publication. The surveyed population is briefly described below:
Ethiopia: Retta (Citation1999) describes only barriers to CP uptake based on audits in 38 factories in five manufacturing sectors.
South Africa: Peart (Citation2002) surveyed 26 firms that had recently adopted CT. The author describes only drivers.
Zambia: Siaminwe et al. (Citation2005) consulted 60 companies and other stakeholders. They classify barriers and drivers as both internal and external to firms.
Kenya and Zimbabwe: Luken & Van Rompaey (Citation2008) surveyed factors affecting CT adoption identified by the 19 plant managers and 30 key informants in the leather sector of Kenya and Zimbabwe as part of a nine-country survey.
South Africa: Koefoed & Buckley (Citation2008) described the findings of a Danish-funded CT project in the metal-finishing industry that was implemented over the period 2000–05.
Nigeria: Masselink (Citation2009) interviewed 13 companies about various aspects of energy management including barriers and drivers as well as sources of information.
South Africa: Morris et al. (Citation2011) interviewed 13 clothing and textile firms and 17 automotive component manufactures about several energy-related issues including barriers to, and drivers for, improving their energy efficiency.
Ghana: Appealing & Hollander (Citation2013) surveyed 34 plants in several manufacturing sectors and three energy experts to identify barriers to, and drivers for, the adoption of energy efficiency measures.
South Africa: Figueroa (Citation2015) described the experience of the ArcelorMittal Asiana Works in introducing an energy management system along with energy systems optimisation measures in line with the international energy management standard ISO 50001.
Uganda: Never (Citation2016) interviewed 45 small and medium enterprise (SME) owners/managers, experts on SMEs and energy management, and stakeholders to obtain information about barriers and drivers.
Our review of the drivers and barriers in these 10 articles/reports identifies some methodological uncertainties in the manner in which they categorise actions as drivers or barriers. We, therefore, decided to reclassify them. The conceptual framework used here to do the reclassification has the firm (individual factory or company) at its core, and the goal is to move firms towards greater implementation of CP measures. In this light, drivers are those actions which push or pressurise firms to adopt CP measures; barriers are those aspects about a firm’s culture, skills, commitment, etc., which, when firms have decided they want/need to deploy CP measures, make it difficult for them to do so; and enablers are those actions which lower these barriers. As defined here, drivers can be either internal or external to firms; barriers are always internal to firms, while enablers are always external because they are primarily the interventions by which external actors assist firms with overcoming their barriers.
The top 27 drivers and 29 barriers found in the literature (including the findings of the SSA survey described in the next section of this article) are listed in with the full name of the author(s) of the report from which they extracted (a single letter is used to identify reports for ).Footnote4 Identification of top drivers and barriers is based on our understanding of the explicit or implicit rankings in the articles/studies. In a few cases, we contacted the authors to clarify their rankings; these are identified as ‘author opinion.’
Table 1. Top drivers, barriers and enablers.
Table 2. Clusters of top drivers, barriers and enablers.
We then reclassified certain barriers as drivers or enablers – recognised as important but missing – and reclassified certain drivers as either enablers, where their objective is more to lower barriers than to push firms towards CP, or as barriers (entries in italics are those which have been reclassified). Among other things, the reclassification reflects our understanding that the lack of action is not necessarily a barrier, but rather recognition that a driver or enabler is necessary but is not in place.
Here are examples of the challenges in classifying factors as drivers, barriers and enablers in the previous studies. Two articles (Siaminwe et al., Citation2005; Koefoed & Buckley, Citation2008) have weak enforcement of environmental regulations as a barrier on the grounds that lack of enforcement constitutes an incentive to delay or ignore any CP investments or efforts. In this sense, however, it is actually more of a lack of a driver than a barrier, the true barrier being inertia and staying with the status quo on the part of plant management.Footnote5 For this reason, it is not included in . Another example, mentioned in several reports, is the lack of government support. Rather than being a barrier, its listing shows that there is recognition that government support programmes are important enablers. A third example is the classification of low-energy prices as a barrier, when this classification really shows a recognition that high prices of energy can act as a driver, but that this driver is absent in the case being considered. The opposite case also exists: barriers which are classified as drivers. An example is the classification of staff training as a driver. However, what this recognises is that once firms have overcome the barrier of a lack of training, CP implementation can take place. Drivers, barriers, and enablers are identified as internal (I) or external (E) in .
3. New survey in seven SSA countries
As a complement to the literature survey, we undertook a survey in 2016 of key informants in seven SSA countries (Ghana, Nigeria, Senegal, South Africa, Tanzania, Uganda, and Zimbabwe).Footnote6 The survey uses a modified version of the questionnaire used by Luken & Van Rompaey (Citation2008) to identify drivers for, and barriers to, implementation of clean technology measures.Footnote7 The same set of internal barriers to the firm is used, while external barriers shown to be important in the literature review are added. As for drivers, the same three broad sources of external drivers (government, markets, and community) are used, along with specific drivers within those three broad categories (with the addition of energy regulations). Here too, internal drivers shown to be important in the literature review are added. The impact of environmental regulation is included as a driver for greening industry rather than as a barrier. It is listed as such in some of the SSA articles/reports reviewed in Section 2.
The questionnaire with its 15 drivers and nine barriers can be found in Appendix 1; the five-point rating scale for the drivers and barriers from least to most important is not shown. NCPCs and UNIDO offices in seven countries, based on their knowledge of the country, identified key informants in the three different groups, government ministries, associations (business and NGOs) and suppliers of technical information and technologies (engineering firms and universities) They mailed the questionnaire to identified key informants and received completed questionnaires from some 46 key informants ().
Table 3. Key informants in seven SSA countries.
With respect to drivers, shows that, overall, the most important drivers include one contextual factor, high costs of production inputs, and one firm-level factor, potential to reap productivity improvements. Other relatively important drivers are three external factors; these are requirements of investors, product requirements in foreign markets, and the need to comply with environmental regulations. Of little importance as drivers are financial incentives, peer pressure in business associations, and the actions of NGOs.
Figure 1. Drivers rated by key informants in seven SSA countries.
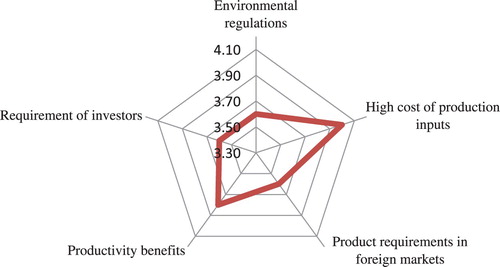
Disaggregating the ratings of drivers by country shows that one is dominant in most countries, but that there is considerable country variation about the importance of other drivers. The benefits of reducing the costs of production is the most important driver in six out of seven countries; it is only rated as the third most important in Zimbabwe. Productivity enhancements are the most important driver in Zimbabwe and the second highest in Ghana, Senegal and Tanzania. Product requirements in foreign markets is the second most important driver in South Africa and the third most important driver in Ghana and Senegal. Investor requirements are the second most important driver only in Zimbabwe. Environmental regulation is the second most important driver in Nigeria; it receives a lower rating in all other countries.
The rating of drivers by key informants grouped as either engineers or economists, whose professional training often results in different understandings of CP, is surprisingly almost the same and also similar to the rating across country groups. Both engineers and economists view the need to reduce production costs as the most important driver and the need to capture the related productivity benefits as the second most important driver. Their rating of the third most important driver is surprisingly different; engineers see the need to meet product requirements in foreign markets as the third most important driver, whereas economists see the need to comply with future environmental regulations as the third most important. One would have thought just the opposite, with engineers focusing on environmental compliance, and economists focusing on trade considerations.
Last, the rating of the 15 drivers varies among the key informants grouped by institutional affiliation. Government ministries, business associations, and suppliers of technical information and technologies all rate high costs of production inputs as the most important driver. With respect to the second most important driver, government ministries assign this slot to improving productivity, associations assign it to product requirements in foreign markets, and suppliers of technical information and technologies assign it to public pressure. As for the third most important driver, government ministries and suppliers both assign this slot to compliance with current environmental regulation, whereas associations assign it to productivity improvements.
With respect to barriers, shows that, overall, one internal barrier, high costs of implementation, and one external barrier, lack of government support encouraging firms to adopt CP measures, are the most important. These two are followed by another internal barrier, lack of technical information about appropriate CP measures. The least important barriers (not shown in the figure) are the external absence of NGO pressure and an internal lack of knowledge of alternatives.
Figure 2. Barriers rated by key informants in seven SSA countries.
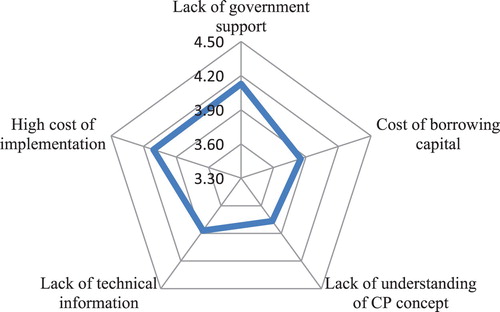
The ratings of barriers disaggregated by countries show some interesting variations. With respect to lack of government support, key informants in Ghana, South Africa, and Tanzania rate this as the most important barrier; key informants in Senegal and Zimbabwe rate it as the second most important barrier; key informants in Uganda rate it as the third most important barrier; and key informants in Nigeria find it relatively unimportant. Financial considerations, either cost of capital or high cost of implementation, are also seen as significant barriers. However, the relative importance of the various financial considerations varies among countries. Key informants in Senegal, Uganda and Zimbabwe rate cost of implementation as the most important barrier and key informants in Nigeria and Uganda rate cost of borrowing as the second most important barrier. The importance of information-related barriers also varies among countries. Key informants in Nigeria rate lack of understanding of the CP concept as the most important barrier while those in Ghana rate it as the second most important barrier. In the other countries this is not seen as important. Key informants in Tanzania rate lack of technical information as the second most important barrier while those in Senegal rate it as the third most important barrier. In the other countries this is not seen as important.
The rating of the nine barriers also varies depending upon the professions of the informants, broadly grouped as either engineers or economists. Engineers view lack of government support as the most important barrier, high costs of implementation as the second most important barrier, and lack of technical information as only the third most important barrier. Economists view high costs of implementation as the most significant barrier, lack of government support as the second most important barrier, and lack of business associations’ understanding of the CP concept as the third most important barrier. The different ratings given to implementation costs suggest that engineers and economists may use different time horizons, or it might reflect different definitions of total cost. Economists claim that hidden costs are often overlooked in estimating the costs of implementing green technologies.Footnote8
Last, the rating of the nine barriers varies depending on the institutional affiliations of the key informants. Two groups (government ministries and associations) view lack of government support as the most significant barrier; suppliers of technical information and technologies view lack of understanding of the CP concept as the most important barrier. The same two groups view high costs of implementation as the second most important barrier. Not surprisingly, the suppliers of technical information and technologies view lack of technical information on appropriate CP technologies as the second most important barrier. This is somewhat ironic because it is within their capacity, purview and interest to remedy this situation. Government ministries view lack of technical information as the third most significant barrier whereas associations view cost of borrowing as the third most important barrier.
As we did for the drivers and barriers identified in the view of the eight articles and two reports, we also reclassified one barrier, lack of government support, as an enabler. The top three drivers and two barriers retain their classification.
4. Aggregation into clusters
A further level of aggregation was then undertaken, bringing the drivers, barriers, and enablers listed in together into broader clusters based on similarities of actions.
shows the results for top drivers, which have been aggregated into four clusters: recognition of the problem, material costs, competitive strategy, and government regulations. While the last three clusters require little explanation, the first needs some elaboration. It is argued here that the most basic driver for firms is that they are aware of the problem, they recognise that it exists, and that management has made a commitment to resolving it. Without this, little CP if any will take place.
also shows the aggregation of the top barriers into four clusters. These are barriers related to the lack of management commitment (unwillingness to assign resources and personnel to make CP happen); the lack of information (no technical knowledge or first-hand experience); barriers related to the basic cost–benefit and risk calculus that is at the heart of CP; and barriers related to investment funds (financial problems and access to bank loans).
Last, shows the aggregation of enablers, where two clusters are posited. One is the provision of information from suppliers and consultants as well as other firms, and the other is government support in one form or another (which could also presumably include the provision of information).
A comparison of entries in shows that there is no temporal trend. That is to say, there are no drivers or barriers which seem to have dominated at the beginning of the period under investigation (the early 2000s) and others which have dominated at the end of the period (‘teen’ years). Generally speaking, all the identified barriers and drivers have been considered important at all times over the period.
Considering the drivers specifically, drivers related to material costs dominate: 13 mentions compared to a total of 28, with 7 of those 13 relating specifically to energy costs. Barriers related to the competitive strategies of firms, to government regulations, and to the recognition of the problem, have similar weights to each other, with 6, 5 and 4 mentions, respectively.
As for the barriers, they are quite evenly distributed among the four clusters, with barriers related to lack of knowledge being somewhat more frequently mentioned: 10 mentions out of a total of 27, compared to seven mentions for lack of management commitment, and five mentions each for the cost–benefit calculus and lack of investment funds.
Enablers are mentioned significantly less often than either drivers or barriers: 8 mentions, compared to 28 drivers and 27 for barriers. The smaller number of enablers, and the fact that the needs for government support are quite unspecified, does not allow for much analysis. In principle, governments can offer a number of different types of support: informational support (training, provision of technical information, audits, brokering of information exchanges between private parties, etc.), financial support (subsidised loans, loan guarantees, green procurement, etc.), as well as broader systemic support through industrial policies and strategies. Each of these can have different levels of utility to firms, and had they been considered separately by respondents, they might have ‘scored’ differently.
5. Conclusions and recommendations
In this last section, the more important conclusions to be drawn from the 11 reports are presented and recommendations based on the conclusions are offered to productivity-enhancing service providers, including NCPCs, to enhance their effectiveness in promoting the greening of industry. As noted in the Introduction, a major purpose of this survey arising out of the 2015 Davos conference is to distil recommendations that might potentially accelerate meeting the industry-related targets set forth in the UN Sustainable Development Goals.
5.1 Conclusions
The varied literature about drivers for the implementation of CP measures in SSA countries, the barriers to that implementation, and the enablers which can lower these barriers, presents a multitude of relevant factors that act as incentives or disincentives to CP investments over different time horizons and under different circumstances. Drivers can be either internal or external to firms, where internal drivers relate primarily to the need which firms feel to increase or maintain profitability and market share, while external drivers relate to the pressure which other parties in society bring to bear on firms to deploy CP. Barriers instead are all internal, these being aspects of a firm’s skills set or culture which act as a brake on a firm’s ability to deploy CP. Enablers are also all external, these being nearly always actions which external parties (the government or elements of the non-government sector) can take to assist firms in lowering the barriers which they face.
The biggest cluster of drivers concerns material costs: the high costs of inputs and the allied need for cost savings. If the drivers related to maintaining a competitive edge are added under an overall objective of firm profitability, these dominate the drivers. It seems, then, that in SSA countries purely economic, market considerations mostly underlie any sensitivity that firms have towards CP; the pursuit of other, more social goods, such as climate-change-related energy efficiency or environmental protection more generally seem to still play a relatively minor role in their decision-making. Not surprisingly, this also describes the factors affecting decision making among profit-making firms in most OECD-based industries. But it is also possible that the over-riding importance of economic considerations reflects the fact that other social actors – the government in the first instance but also civil society more generally – are either too weak in SSA countries to bring the relevant pressure to bear or are themselves unaware of the social goods which CP can deliver to society as a whole.
This situation seems to be reflected in the set of barriers identified as important in the reports considered. The cluster of barriers focusing on the high costs or risk of implementation is another reflection of the concern for profitability. It can also be a reflection of a perceived lack of knowledge because lack of knowledge tends to magnify the ‘down side’ of any move away from the status quo. The strong cluster of barriers relating to the lack of information, points to firms still being in the ‘starting blocks’ when it comes to CP implementation. Overcoming a lack of information is a key first step in a firm’s journey towards CP. An important cluster related to the lack of management commitment shows that this is still a problem in SSA countries: company management does not yet see CP as an important strategy to adopt and consequently do not make the necessary allocation of resources and manpower. An important cluster of barriers around the theme of lack of investment funds could reflect the chronic lack of capital in SSA countries but could also be a reflection of the lack of management commitment, where those investment funds available internally to a company get shunted to some other use, viewed by management as having a higher priority.
The possible weakness of governments in SSA countries which was alluded to earlier could explain why enablers figure weakly in the 11 reports considered. In principle, governments can play an important role in lowering the barriers to firms for CP implementation through various free or subsidised programmes, focused on information diffusion, skills upgrading, and readier access to finance. The fact that such assistance was not often mentioned as an important element leads one to suspect that the respondents in the various studies simply were not aware that these are available, or they did not see government as being able or willing to offer these services.
5.2 Recommendations
In light of these findings, what can realistically be done by industry regulators and service providers, including NCPCs, to accelerate the greening of industry as called for in the UN Sustainable Development Goals?
NCPCs and others can reinforce their enabling activities in various ways:
They can improve the value of their services to firms by linking targeted relevant information more closely to the business case of the firm. They can customise their information dissemination efforts to discern and emphasise the advantages of CP in serving the business interests to individual clients in securing a competitive advantage.
They can work more closely with natural partners, technology suppliers, and consultants, to increase a firm’s awareness of the productivity benefits of CP implementation.
They can support tools, such as waste minimisation circles, that increase information sharing by firms, particularly small and medium size enterprises, in the same sector and geographic location.
They can reinforce government support for CP implementation by making alliances with national productivity organisations or councils and sector-specific technical advisory services.
NCPCs and others could also advise governments on how to play more of an enabling role, which as we have seen appears to be weak in the SSA countries. Rather than posit new programmes, with all the budget difficulties this poses, NCPCs could help governments use the potential of their existing programmes to create conditions conducive to CP implementation. For example, environmental regulations could be designed to influence the use of process controls and encourage technology change in addition to reducing environment pollution. Market pressures, such as appropriate resource pricing and economic incentives, could be used to complement environmental regulatory pressure. In addition, effective non-conventional market pressures, such as expanding exports that create competitive pressures for cost reductions, and increasing foreign direct investment that brings technical knowledge, could be used to encourage the greening of industry particularly efficient energy utilisation.
Disclosure statement
No potential conflict of interest was reported by the authors.
Notes
1 UNIDO and UNEP started the global National Cleaner Production Centre Programme in 1995 with eight centres. There are currently 58 centres.
2 There are 17 UN Sustainable Development Goals and 169 targets (UN, Citation2015). Industry-related environmental targets are in goals 6 (water use and pollution), 7 (energy-intensity), 9 (carbon dioxide emission intensity) and 12 (hazardous waste management).
3 UNEP and UNIDO define CP as an integrated preventive environmental strategy and CT as techniques and technologies for implementing CP strategies. However, the distinction is often blurred in writing about CP and CT.
4 There are only 27 out of a potential 33 drivers in the 11 surveys (Luken and Van Rompaey is considered as two surveys because they sampled two different populations) because Retta identifies only barriers. There are only 29 out of a potential 33 barriers because Peart identifies only drivers and Masselink identifies two drivers.
5 Other researches would disagree. For example, Shi et al. (Citation2008) classified lax environmental enforcement as one of the top three barriers to CP in China.
6 We requested the eight active NCPCs in SSA countries to assist in our survey; six agreed to participate. We requested the three UNIDO offices where there is no NCPC to assist in our survey; only the office in Nigeria agreed to participate. Six to eight questionnaires were completed by each country.
7 The authors did not have sufficient funds to survey plant managers as was done for the 2008 survey.
8 Examples of hidden costs include overhead costs for management, disruptions to production, staff replacement and training, and the costs associated with gathering, analysing and applying information.
References
- Appealing, R & Hollander, P, 2013. Barriers to and driving forces for industrial energy efficiency improvements in african industries – a case study of Ghana’s largest industrial area. Journal of Cleaner Production 53, 204–13. doi: 10.1016/j.jclepro.2013.04.003
- Baggier, V, Time, I, Nalweysio, G & Kakooza, J, 2011. Contextual environment and stakeholder perception of corporate social responsibilities practices in Uganda. Corporate Social Responsibility and Environmental Management 18, 102–9. doi: 10.1002/csr.252
- Editorial, 2008. Cleaner technology diffusion: case studies, modelling and policy. Journal of Cleaner Production 16SI, S1–S6.
- Figueroa, A, 2015. Industrial energy efficiency in South Africa: Challenging the status Quo with Behavioural change and process innovation. The Human Factor in Energy Efficiency – Lessons from Developing Countries. DIE (Deutsches Institut für Entwicklungspolitik) Bonn, Germany.
- IEA, 2012. World energy outlook. International Energy Agency, Paris, France.
- Koefoed, K & Buckley, C, 2008. Clean technology transfer: a case study from the South African metal finishing industry, 2000–05. Journal of Cleaner Production 16SI, S78–S84. doi: 10.1016/j.jclepro.2007.10.023
- Lozano, R, 2015. A holistic perspective on corporate sustainability drivers. Corporate Social Responsibility and Environmental Management 22, 32–44. doi: 10.1002/csr.1325
- Luken, R & Van Rompaey, F, 2008. Drivers for and barriers to environmentally sound technology adoption by manufacturing plants in nine developing countries. Journal of Cleaner Production 16S1, S67–S77. doi: 10.1016/j.jclepro.2007.10.006
- Luken, R, Van Berkel, R, Leuenberger, H & Schwager, P, 2016. A 20-year retrospective of the united nations industrial development organization and united nations environment programme national cleaner production centres programme. Journal of Cleaner Production 112, 1165–74. doi: 10.1016/j.jclepro.2015.07.142
- Masselink, D, 2009. Industrial energy efficiency in Nigerian companies. draft background paper prepared for the 2010/2011 UNIDO industrial development report. United Nations Industrial Development Organization, Vienna, Austria.
- Morris, M, Barnes, J & Morris, J, 2011. Energy efficient production in the automotive and clothing/textiles industries in South Africa. background paper 04/2011 prepared for the 2010/2011 UNIDO industrial development report. United Nations Industrial Development Organization, Vienna, Austria.
- Mzembe, A, Lindgreen, A, Maon, F & Vahamme, J, 2016. Investigating the drivers of corporate social responsibility in the global supply chain: A case study of eastern produce limited in Malawi. Corporate Social Responsibility and Environmental Management 23, 165–78. doi: 10.1002/csr.1370
- Never, B, 2016. Behave and save? behaviour, energy efficiency and performance of micro and small enterprises in Uganda. Energy Research & Social Science 15, 197–206. doi: 10.1016/j.erss.2016.03.001
- Peart, R, 2002. A survey of the adoption of cleaner technology by South African firms, Development Southern Africa 19(2), 221–37. doi: 10.1080/03768350220132459
- Retta, N, 1999. Cleaner industrial production practice in Ethiopia: problems and prospects. Journal of Cleaner Production 7, 409–12. doi: 10.1016/S0959-6526(99)00157-2
- Shi, H., Peng, S.Z., Liu, Y., Zhong, P, 2008. Barriers to the implementation of cleaner production in Chinese SMEs: government, industry and expert stakeholders’ perspectives. Journal of Cleaner Production 16, 842–52. doi: 10.1016/j.jclepro.2007.05.002
- Siaminwe, L, Chinsembu, K & Syakalima, M, 2005. Policy and operational constraints for the implementation of cleaner production in Zambia. Journal of Cleaner Production 13, 1037–47. doi: 10.1016/j.jclepro.2004.12.005
- Sorrel, A., Mallet, A & Nye, A, 2011. Barriers to industrial energy efficiency: A literature review. Background Paper 11/2011 prepared for the 2010/2011 UNIDO industrial development report. United Nations Industrial Development Organization, Vienna, Austria.
- UN, 2015. ‘Transforming our World: The 2030 Agenda for Sustainable Development.’ General Assembly Resolution 70/1. United Nations. New York.
- UNIDO, 2011a. Green industry: policies for supporting green industry. United Nations Industrial Development Organization. Vienna, Austria.
- UNIDO, 2011b. Industrial development report 2011/2012: industrial energy efficiency for sustainable wealth creation. United Nations Industrial Development Organization, Vienna, Austria.
- UNIDO, 2012. UNIDO support to the national cleaner production centre in Viet Nam. Evaluation Group. United Nations Industrial Development Organization, Vienna, Austria.
- UNIDO & UNEP, 2010. Taking stock and moving forward. United Nations industrial development organization. Vienna, Austria and United Nations Environment Programme, Paris, France.