
 ?Mathematical formulae have been encoded as MathML and are displayed in this HTML version using MathJax in order to improve their display. Uncheck the box to turn MathJax off. This feature requires Javascript. Click on a formula to zoom.
ABSTRACT
South Africa has seen a rapid rate of new household formation since 1994. The same period has also seen an impressive roll-out of housing and services. These interact since new household formation delays the elimination of backlogs. Based on data from the Agincourt study site and a novel decomposition technique we examine the process by which household size has been reduced and suggest that service delivery may actually fuel new household formation.
1. Introduction
The end of apartheid led to changes on many fronts: economic, social and political. Discriminatory measures were repealed and there was a major expansion of services to people and areas that had previously been deprived of them (Gaunt, Citation2005; Dinkelman, Citation2011; Bhorat & van der Westhuizen, Citation2013). One of the changes that has attracted less attention was a sustained burst of household formation, which led to a marked reduction in average household size. Wittenberg et al. (Citation2017) point out that new household formation and service delivery interact in complicated ways. They argue that new household formation undercuts the ability of the service delivery roll-out to meet its targets; backlogs were not eliminated as fast as they otherwise would have been, or as they put it, service delivery was chasing a ‘moving target’. The mechanisms by which average household size has come down have, however, not been adequately explored in South Africa. Many different social processes are likely to bear on it: demographic ones eg mortality, fertility and age of childbearing (Burch, Citation1970), but also social and economic processes affecting the affordability and desirability of living alone (Börsch-Supan, Citation1986; Haurin et al., Citation1993; Ermisch & Salvo, Citation1997). Household size can be seen as a prism through which these social processes are refracted.
Because of these complex interactions one needs rich data to pick some of these processes apart. At the national level we know of no dataset that spans the post-apartheid period that would enable us to do so We do, however, have an extraordinarily rich data source that allows us to analyse these changes in detail in a local area. The MRC/Wits Rural Public Health and Health Transitions Research Unit (Agincourt) has been collecting information on all households and individuals in a rural area in the east of South Africa since 1992 (see )
Figure 1. Map of the Agincourt study site. The original villages are in the southern half of the site.
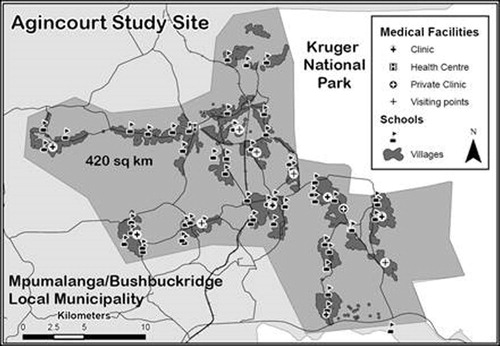
The data from this Health and Demographic Surveillance System site (HDSS) enables us to go beyond the national changes to examine how the process of household size reduction has worked in detail. So while household size is the prism through which broader social developments are refracted, the MRC/Wits Agincourt HDSS provides the spectroscope through which we can isolate some of the component processes. In particular, we will explore how household size reduction has occurred in different sub-populations of the study site. We will suggest that service delivery, in particular housing construction under South Africa's Reconstruction and Development Programme (RDP), has encouraged new household formation. So, ironically, successful service delivery has undercut the ability of the development programmes to eliminate the backlogs. While our detailed analyses are for the Agincourt site, the results are intended to reflect on the question as to why household formation nationally has outstripped population growth in an environment where one might not have expected to see this.
The contributions of this paper are fourfold. Firstly, we provide new evidence on the process by which household size has come down. Secondly, we adapt a decomposition presented by Wittenberg et al. (Citation2017) to deal with subpopulations. This methodological contribution is likely to be of interest in other contexts. Thirdly, we show how local processes and local data can be triangulated with national evidence to provide new insights. Finally, we highlight the way that service delivery seems to have fed back to household formation – a connection that, as far as we are aware, has not been mentioned in the literature.
The plan of this discussion is as follows. We first briefly review some of the literature examining South Africa's national data. Section 3 describes the data that we use and our broad approach is outlined in Section 4. Technical details are in an appendix. Section 5 provides the results of our analysis and an interpretation of these is given in Section 6. We conclude by reflecting on what these local processes suggest about national developments and their implication for policy.
2. Household change and services in South Africa
2.1. Households and household size
There is a large literature dealing with households and household change in South Africa. Much of it has focused on the question whether South African households are becoming more nuclear or ‘westernised’ (Ziehl, Citation2001; Amoateng & Kalule-Sabiti, Citation2008). The evidence for this is that there has been a notable increase in single person households, but some of the literature (Russell, Citation2003a, Citation2003b) has queried whether the instruments used in measuring household size (census and sample surveys) adequately cover the complexity of the social connections between people. Indeed another strand of the literature (e.g. Spiegel et al., Citation1996) points to the ‘fluid’ nature of households, often ‘stretched’ in space. The problem lies with the fact that social surveys tend to take a snapshot of where people are located at a point in time and do not indicate that people move between households and locations. Posel et al. (Citation2006) point out the importance of such rural-urban linkages in the context of analysing employment and migration behaviour. Indeed Wittenberg & Collinson (Citation2007) note that ‘complex’ (i.e. non-nuclear) household types persist and, if anything, have become more prevalent over time.
Nevertheless, Wittenberg et al. (Citation2017) contend that the available data still allow for a meaningful analysis of changes in the country, particularly when national data is used in conjunction with data from demographic surveillance sites, given that the definition of household membership is more appropriate in the latter, because temporary migrants are kept on the household roster. They show that household size decreased by about one full member between 1994 and 2012, (from 4.5–3.5) according to national household surveys. Reductions could also be seen in South Africa’s rural areas generally (from 4.7–4) and in the Agincourt demographic surveillance site in particular (from 6.5–5.5). Census information is congruent with these results, showing a reduction from 4.5 in 1996–3.6 in 2011 (own calculations from census tabulations).
Wittenberg et al. (Citation2017) suggest that much of the household change happened at the point where households leave one location and before they set up at another. While they make the case that the reduction in household size is a real phenomenon, they do not discuss why this might have happened. They point out, however, that household size might decrease either due to a relative reduction in the population (the numerator) or due to an acceleration in new household formation (the denominator).
There are several candidate explanations. The increased mortality associated with the HIV epidemic or the decrease in the fertility rate (Moultrie & McGrath, Citation2007) would all be expected to produce declines in the average household size in the long run. Nevertheless, the mechanism by which this process would work would not be the one in which new household formation outstrips the population growth rate, which is the pattern that Wittenberg et al. (Citation2017) find in their analysis. Instead, as we argue below, deaths and births are processes that are likely to reduce the household size of existing households, not prompt the formation of new ones. Furthermore, a rapid rate of household formation is puzzling given that economic conditions in the late 1990s were arguably tough. Economic approaches to the analysis of the household emphasise that the decision to set up an independent household would tend to go up with income (Börsch-Supan, Citation1986; Haurin et al., Citation1993; Ermisch & Salvo, Citation1997). In tough economic conditions the reverse would occur: dependent children will delay moving out of the parental home, or might even move back. Indeed, one strand of the South African labour literature has argued that unemployment has led to higher levels of co-residence with pensioners than might otherwise have been the case for these sorts of reasons (Klasen & Woolard, Citation2009).
The core research question motivating this paper is therefore why new household formation occurred at the rate it did, given that unemployment and poverty continued to be high in the post-apartheid era.
2.2. Housing and service delivery
There is also a voluminous literature dealing with the roll-out of services, such as electricity, water, sanitation and housing. Bhorat & van der Westhuizen (Citation2013) show, using national survey data, that there has been a marked increase in the acquisition of assets by South African households after the end of apartheid. They point particularly to policies such as the roll-out of electricity and the provision of free basic services (such as sanitation). Gaunt (Citation2005) provides a discussion of the expansion of access to electricity, showing that domestic connections doubled in the ten years after 1991, while Dinkelman (Citation2011) shows that electrification of rural South Africa had important social impacts, raising the employment, in particular of women.
Wittenberg et al. (Citation2017) also comment on the scale of the electrification programme. They show that connections increased by 157% nationally and 72% in the Agincourt area. Were it not for the rapid rate of new household formation, the number of new connections would have wiped out the backlog completely. Harris et al. (Citation2017) caution against excessive triumphalism by pointing out that alongside new connections there are also disconnections experienced in every period. Nevertheless, the net increase in connections over this period has been impressive: 5% per annum over the eighteen year period 1994–2012 (Wittenberg et al., Citation2017:1318).
There has also been an impressive increase in the number of new houses built during this time. According to South Africa's Department of Human Settlements, 3.7 million new ‘housing opportunities’ were created in the twenty years between 1994 and 2014 of which 2.8 million were new housing units, the rest being serviced sites (DHA, Citation2014:27). A performance review of the three-year period 2010/11–2012/13 suggests that the official delivery counts are likely to be overstated (RMZ, Citation2015:5). The Executive Summary released together with the report (NT, Citation2015:3) commented:
It is not entirely clear why the reported numbers exceed the actual delivery, although there appears to be at least some double counting of the separate processes required for the delivery of a single unit, such as site preparation and the building of top structures.
3. The data
3.1. The Agincourt health and demographic surveillance system
The data from the Agincourt Health and Demographic Surveillance System has been used in many studies to investigate household change in South Africa (e.g. Wittenberg & Collinson, Citation2007; Schatz et al., Citation2015), because it provides fine-grained information over a long time-period. The MRC/Wits Agincourt Unit was established in 1992 initially with the aim of addressing issues around the decentralisation of health services and to provide accurate information for planning (Tollman, Citation1999; Tollman et al., Citation1999). Agincourt was selected in part because it reflected many of the key developmental challenges. The area lacked a functioning vital registration system, thus making on-going demographic surveillance appropriate. Furthermore, the area formed part of the previous Gazankulu homeland and therefore exhibited many of the characteristics of these areas: a lack of infrastructure and a population that has been subject to forced removals and betterment planning (for a discussion of some of these processes see Niehaus, Citation2001). The study site was expanded in 2007. We restrict our analyses to the area of the original 21 villages that have been monitored since 1992.
For our purposes we need to take account of the fact that the site is close to the Mozambique border and has a significant subpopulation of Mozambican refugees who fled the civil war in Mozambique in the mid-to-late 1980s and came to reside in demarcated areas on less-habitable outskirts of existing villages in Bushbuckridge (Dolan et al., Citation1997). They come from the same language group as the South Africans, but they form a distinct sub-population. Indeed, many of them live in villages which consist predominantly of refugees. Nevertheless we need to distinguish them, because they have persistently shown health and socio-economic vulnerability compared to their South African hosts (Hargreaves et al., Citation2004; Schatz, Citation2009; Sartorius et al., Citation2011). Furthermore, they have had demonstrably lower access to South African social services, in particular the old age pension (Case & Menendez, Citation2007) and are consequently poorer. There has, however, been a degree of assimilation as some former refugees have moved out of Mozambican settlements into mainly South African villages.
Furthermore, in 1999, a new housing development was built under South Africa's Reconstruction and Development Programme (RDP). The RDP village is a settlement of formal cement-brick houses which was fully settled by 2002. The existence of this village allows us to analyse developments which we suspect happened elsewhere, given the scale of the RDP housing programme. It would be important to analyse developments in this village separately for that reason alone, but as we will also show later, the sub-population residing in the new village has much fewer older people, and a higher percentage of new household formation, compared to households in well-established villages (Wittenberg & Collinson, Citation2007).
In our empirical work we therefore create a four-fold categorisation of subpopulations: Mozambicans living in refugee villages; South Africans living in ‘South African’ villages; Mozambicans living in ‘South African’ villages and the RDP village. Given the differences in the histories and trajectories of these sub-populations we want to analyse their evolution separately as we expect the economic and social forces to operate somewhat differently in these groups.
The refugee villages date back to the 1980s and are all located on the fringes of the study area, furthest removed from infrastructure and from economic activities. Not coincidentally they are also located on the border of the Kruger National Park. Indeed, most of the refugees came through that park from Mozambique. The ‘South African villages’ go back to the 1950s and 1960s when the villages were laid out in terms of ‘betterment schemes’. Within this category we distinguish between households headed by a South African citizenFootnote1 and households headed by a non-South African (mainly Mozambican). The latter would be mainly ex-refugees that have managed to resettle themselves in more central locations.
It is worth reflecting on how ‘representative’ our study site is in relation to other rural parts of South Africa. Health trends observed in the study site, e.g. the increase in deaths from non-communicable diseases and the progression of the AIDS pandemic (Kahn et al., Citation2012), have subsequently been documented elsewhere. Demographic trends measured in the study site such as the persistence of complex household arrangements have also been found in the ‘rural’ sub-sample of national household surveys (Wittenberg & Collinson, Citation2007). Where the trends diverge, e.g. a marked increase in one person households in the national surveys, the problem has been found to be with the national information (Wittenberg & Collinson, Citation2007).
3.2. The health and demographic surveillance system data
The Agincourt HDSS monitors key demographic events and socio-economic variables in the Agincourt sub-district. A baseline census was conducted in 1992 and since 1996 there have been census rounds annually. The main demographic, health and socio-economic variables measured routinely by the HDSS include: births, deaths, in- and out-migrations, household relationships, resident status, refugee status, education, antenatal and delivery health-seeking practices (Kahn et al., Citation2007; Kahn et al., Citation2012). Circular migrants are accounted for by including on the household roster non-resident members who retain significant contact and links with the rural home (Collinson, Citation2010). The ‘share common pot’ definition of a household is thus expanded to include the temporary migrants who would normally share the same pot on return.
A panel dataset was constructed for this analysis, using longitudinal HDSS data. In order to do this, it is important to identify households that persist from one period to the next. We use the household definition that is built into the structure of the HDSS, i.e. households in two periods are the same if they are in the same location and if their membership overlaps. The same definition was used in earlier analyses of household change within the area (Wittenberg & Collinson, Citation2007; Wittenberg et al., Citation2017). It is worthwhile noting that this implies that migration of entire families therefore always implies household dissolution.
4. Methods
The starting point for our analysis is a decomposition presented by Wittenberg et al. (Citation2017). They show that if one has a panel dataset of households one can break up aggregate changes in any household measure (such as household size) into three effects:
Within household changes: these are changes (e.g. a loss of members) among households that persist from one period to the next in the study site
Changes in the measurement due to differences between dissolving and newly formed households, e.g. if the household size of dissolving households is bigger than that of newly formed ones. The authors dub this the ‘replacement effect’
A term which represents the impact of net new household formation, which they call the ‘dilution effect’. Intuitively the dilution effect becomes important if the balance between established households and new ones is constantly shifting towards the new ones and if these also happen to be different on the outcome (e.g. smaller household size) than the established ones.
The technical details are given in the online appendix. The decomposition enables the authors to show that the decline in household size in South Africa is driven almost exclusively by the ‘replacement’ and ‘dilution’ effects.
We want to use this technique in order to investigate changes within Agincourt at a more fine-grained level. In particular, we are interested in how dynamics within the subpopulations in the Agincourt area play themselves out. In order to do this we cannot apply the decomposition as is, because the importance of the subpopulations shifts over time. In the appendix we develop a way in which the decomposition can be applied to dynamic subpopulations within an area. The decomposition allows us to attribute parts of the ‘within’, ‘replacement’ and ‘dilution’ effects to the different subpopulations. Intuitively, we freeze the sizes of the different subpopulations at their initial levels for the disaggregated decomposition. This means that our decomposition acquires a fourth term, which represents the part of the change in household size which is driven by the changing balance between the different subpopulations.
5. Results: Changes in household size in rural South Africa
5.1. Describing the patterns
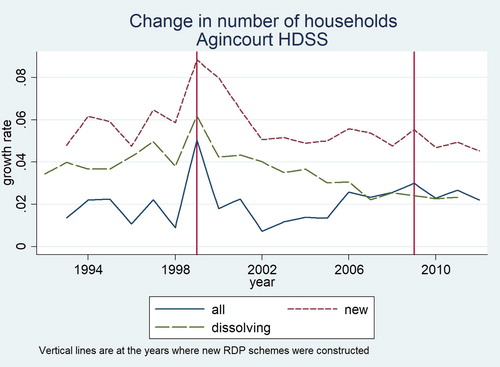
If household size is coming down then net new household formation rates must exceed the population growth rate. Another way of looking at the changes over the period is therefore to look at aggregate household formation and dissolution processes. We cannot track these on national datasets since these do not follow households over time, but it is possible to do so with our Agincourt data. That situation is depicted in . The annual household growth rate hovers around 2%, but this aggregate hides considerable turnover – the new household formation rate is around 6% per annum, with around 4% of households dissolving per annum. The latter rate has come down since 2000, which may be also due to better tracking of households within the study site. We note a big increase in household formation (and dissolution) at the time that the first RDP village was constructed in the study site. There is also an increase in the population growth rate at this point of time, although to a smaller extent. We will return to a consideration of this case later. It does raise the point that dynamics within subpopulations affect the aggregate trends.
Figure 2. Aggregate household dynamics in Agincourt.
In we provide information on the evolution of four settlement/household types within the Agincourt district. We distinguish between three kinds of villages: the ‘South African villages’, the ‘refugee’ villages and the RDP settlements. Within the first settlement type we distinguish between ‘South African’ and ‘Mozambican’ households. It is evident that household size has come down in each community. Furthermore, the population in the refugee areas has declined, suggesting that households and individuals have been leaving these communities and settling elsewhere – at least some of them in the ‘South African’ villages. shows that this process of moving out of the refugee villages has not been a linear one. Indeed, it appears that new households have formed in these areas since 2000. also captures the emergence of the two RDP settlements: the first one built in 1999 and the second in 2009.
Figure 3. Aggregate household numbers by subpopulation type in Agincourt.
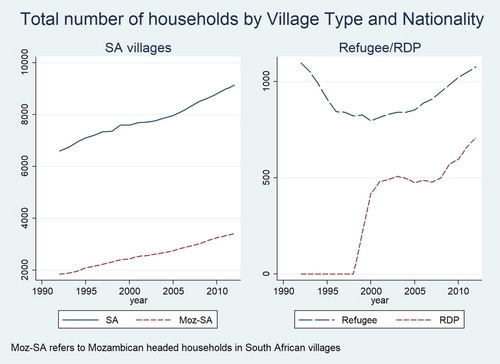
Table 1. Population and household dynamics in Agincourt.
5.2. Decomposing the changes
The decomposition of the change in household size for Agincourt is given in . The first two columns provide the decomposition for the area as a whole. Our results mirror those shown in Wittenberg et al. (Citation2017). They show that aggregate household size decreased by just over a person. When we look at households that remain within the site from one period to the next, we see that on average they do not lose any members. This means that the entire change in household size is driven by the process of household dissolution and re-formation. 20% of the decrease is due to the ‘replacement effect’, so due to the fact that households that dissolve are slightly larger than newly forming households. The other 80% of the reduction is due to ‘dilution’ – new households are smaller than the pre-existing ones and have formed at a rate considerably higher than the replacement rate.
Table 2. Decomposing change in household size in the Agincourt area 1994–2012.
In the other columns of we provide the analogous decompositions treating each of the four subpopulations as closed. As in we observe that household size dropped in the South African villages as well as in the refugee settlements. The RDP settlements obviously do not see a reduction in household size, since average household size was undefined (set at zero for our calculations) at the beginning of our analysis. We see dilution effects in all subgroups – new household formation happened everywhere and in all cases was a factor in bringing down average size. Interestingly South African households in South African villages actually shed almost a quarter of a person. In all the other subpopulations the ‘within household change’ is positive. Note that this is not trivially true for the RDP village, since it is measured on households that we observe more than once. It suggests that initially only one or two people moved into the newly constructed houses and that they were eventually joined by new household members (inmigrants or new births). The positive replacement effect in the RDP village suggests that the small pioneer households in these settlements did not only grow in situ, in many cases they would have dissolved.
In the case of all other subgroups the replacement effect is negative suggesting that dissolving households were generally bigger than newly forming ones – strongly so in the case of the refugee villages. This suggests that much of the reshaping of households happened in the process of household dissolution and new formation. As noted in our earlier discussion migration (even local moves) become household dissolutions in the way that we define households. It appears that in the process of moving, families ‘slough off’ some members who set up new households.
5.3. Disaggregating the decomposition
We apply the aggregate decompositions to the four subpopulations within the Agincourt area. These decompositions are given in . The left hand side of the table provides the disaggregation (for details see Equation 2 in the appendix). The first column provides the change in household size (already reported in ). The second column gives the weighted contribution of each of the subpopulations to those overall trends.Footnote2 It is evident that the reduction in average household size among South Africans living in South African villages is quantitatively the most important factor in reducing the overall household size. Altogether 0.628 of the total reduction in household size can be attributed to reductions in this subpopulation. Nevertheless, important contributions come from the Mozambican households too. Since the RDP settlements did not exist at the beginning of the period they don't contribute here. The overall change due to changes in household size within these subpopulations adds up to 0.970 which is almost the entire observed reduction.
Table 3. Disaggregating the change in household size.
The third column reports the change in weights. It is evident again that South African households in South African villages and households in refugee villages have become less important over time. Column four reports the contribution to overall change due to shifts between subpopulations. This is the fourth term of the new disaggregated decomposition.Footnote3 The biggest contribution by far is the RDP village. It indicates that the construction of the RDP village has helped to bring overall household size by 0.09. This is due to the fact that the average household size among residents in this village is so much smaller than in other subpopulations.
Although the other terms are all small, they are nevertheless revealing. The contributions for South Africans in South African villages is positive. This indicates that the overall reduction in household size would have been bigger if the share of this subpopulation had not shrunk. The positive contribution for Mozambicans in South African villages is due to the fact that this is a growing part of the population overall but these households are also bigger than average.
The right hand part of then decomposes the contribution to overall change given in column 2, back into ‘within household’, ‘replacement’ and ‘dilution’ effects (for technical details see Equation 3 in the appendix). The results of that decomposition suggest the following:
The dilution effect within the different subpopulations is the biggest contributor to the overall reduction in household size, accounting for around 71% (0.74) of the total effect.
Replacement within subpopulations accounts for another 21% of the reduction. This is almost entirely due to the break-up of larger households among Mozambicans (in both refugee villages and South African ones) and their replacement with smaller ones.
The South African households within the South African villages seem to have been actively shedding members over this period. The Mozambican households within the South African villages, by contrast, seem to have been absorbing members.
The most important insight to be gained from these is that there is considerable diversity within the study site. Larger households within the refugee settlements are dissolving. There is the rapid formation of smaller households within the South African villages and within the RDP village. South African households within the South African villages are shedding members, while Mozambican households within these villages and households in the RDP village are absorbing members.
6. Explaining the shifts
In the previous section we observed that the overall reduction in household size was fuelled by the rapid rate of household formation. Furthermore, this can be observed across different subpopulations within the Agincourt area. This raises the question as to what could have led to these developments. There are four candidate explanations:
Measurement changes
Demographic changes
Economic changes
Social changes
We present a quick discussion of these, in turn.
6.1. Measurement changes
There has been some scepticism about whether the rapid increase in the number of households as measured in national surveys (particularly in the case of one person households) is ‘real’ or an artefact of changes in measurement. For instance, Kerr & Wittenberg (Citation2015) have pointed to changes in sampling practice over time. Nevertheless, the Agincourt field processes have run in the same way for a long period. Furthermore the household membership criterion is flexible, so it is not the case that geographically stretched households would be captured twice. There is little doubt that the increase in the number of households measured in the Agincourt area is real. This is an example of the value of triangulating national datasets with longitudinal surveillance data from a sub-population.
6.2. Fertility and mortality
The HIV pandemic led to increases in mortality in the Agincourt area also. These deaths occur within households and would not be expected to lead to new household formation. It is also not the case that abandoned orphans would be forced to set up new and smaller households. Wittenberg & Collinson (Citation2007) looked carefully for evidence of child-headed households and found little evidence that these existed. Instead they found an increase in the number of other relatives within Agincourt households. The fostering of orphans would therefore actually lead to a predicted increase of household size within established households, thus the ‘within household change’ effect would be predicted to be positive.
Similarly, a reduction in fertility would, over time, lead to a reduction in average household size but this would occur because established households do not acquire new members (new births) at the same rate that other households are losing members that transit out (e.g. due to death or marriage), so we would again expect the ‘within household change’ effect to be negative on average.
The pattern of household size reduction that we observe in the Agincourt study site and across subpopulation types (with negligible ‘within household change’ effects) is therefore not one that seems to be driven by these demographic processes.
6.3. Economic factors: land and services
As noted in the introduction, the rapid rate of household formation is remarkable, given that economic conditions were unfavourable. Indeed, economic conditions in the Agincourt area were not any better than nationally. Labour market modules (added to several of the census rounds) since 2000 show high levels of unemployment, particularly in the resident rural population (Collinson et al., Citation2016).
While incomes might have militated against household formation there were, in fact, economic factors that would have made new household formation much easier. In particular the costs of access to land and housing seem to have come down strongly. Extreme cases are the RDP villages within the Agincourt area, where houses were essentially allocated for free through a list system, a form of rationing. We can get some idea of what sort of individuals have taken possession of these houses by looking at the age structure revealed in . It is clear that the houses are occupied by younger children (up to age 12) and adults in their twenties and early thirties. The age pyramid might suggest a settlement of mainly ‘nuclear’ households, but the situation is more complex as is shown in and .
Figure 4. Age pyramid of the RDP village in 2002.
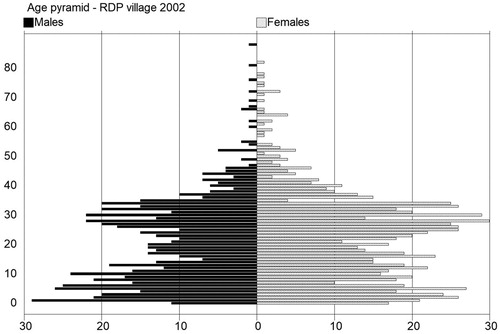
Figure 5. Proportion of newly formed households by household type: South African households in South African villages versus households in the RDP village.
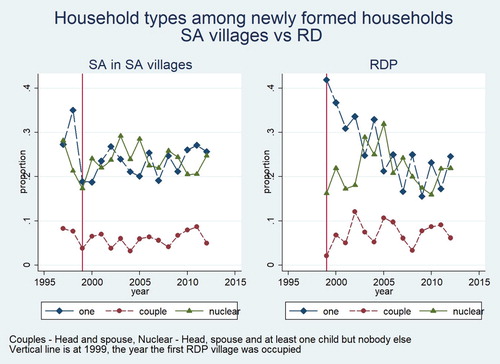
Figure 6. The evolution of household types among South Africans in South African villages and in RDP housing.
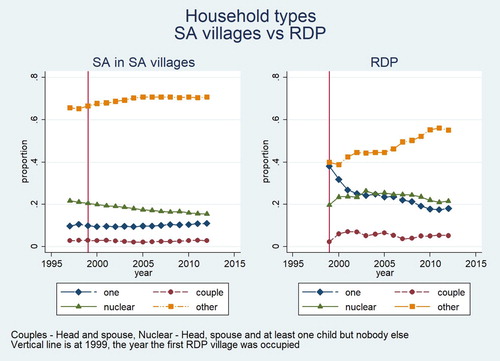
shows that compared to newly formed South African households, there were many more single person households in the RDP houses up until the mid-2000s. suggests that ‘nuclear’ families might have been fractionally more common in the RDP villages than in the South African villages, but the most common types were households that were neither nuclear nor couples or one-person households. Indeed, the complexity has increased over time.
Anecdotal evidence suggests that some of these ‘households’ might really be seen as subsidiaries of bigger households existing elsewhere in the site. Some families seemed to be putting some of their younger members into the RDP houses as a way of establishing title to an asset that the government was providing free of charge. This raises all the questions about the nature of households introduced above (Russell, Citation2003a). At one extreme one might therefore suppose that these are all ‘sham’ entities, that within the family there may have been a change in living arrangements, but no substantive change in the social relationships. At the other extreme one could suppose that the external opportunity provided by the government has released some pent-up demand for privacy, which has led to the fissioning of some existing households. The truth is likely to be somewhere between: with some of these ‘households’ being independent while others being subsidiary. Undoubtedly there will also be many households somewhere in between, where the change in living arrangements does imply a reconstitution of existing social relationships, without these necessarily being severed, however. Indeed, it is interesting to note that many of the single person households that were established in the early parts of the RDP village must have been joined by other people, because shows a marked reduction in the proportion of one-person households over time. So although the RDP village is special, it probably exemplifies some of the processes occurring elsewhere.
Indeed there have been other innovations in the local housing market. Collinson et al. (Citation2000), for instance, document the movement of individuals to the adjoining area of Mkuhlu. This shift was enabled by the breakdown of the ‘traditional’ controls on the development of land. Given that Mkhuhlu had better access to employment, this led to significant local migration. Even within the Agincourt site the power to allocate land has shifted away from the chiefs and headmen to democratically elected development committees. One of the constraints on new household formation has thereby become loosened.
The reduction in size of the refugee villages can most readily be explained in terms of onward migration to destinations that have better access to services and jobs. Some of the exodus would undoubtedly have been to Gauteng and other areas where job opportunities are concentrated. A move to one of the ‘South African’ villages might, however, also be part of a household strategy to improve access to services. Indeed Cross & Harwin (Citation2000) have argued that there is extensive migration within South Africa's rural areas and that much of this can be explained in terms of improving access to publicly provided infrastructure. The migration to Mkhuhlu referrred to above (Collinson et al., Citation2000) is another example of this strategy. This raises the question why the refugee villages made a partial ‘comeback’ after 2000, as shown in . Interestingly this was the period where services (particularly electricity) began to be rolled out in the site, including these more peripheral areas.
The broad trends summarised above can all be fitted into a set of economic explanations in which access to land, services and jobs feature prominently. Within the class of these accounts there are two broad competing explanations. It is clear that apartheid artificially reduced the supply of land and services to the majority of the population. It is therefore possible that the rapid rate of household formation is simply due to the release of this pent-up demand. On the other hand, it is possible that certain new policy initiatives of the new government (such as the RDP housing schemes) may have themselves stimulated demand. Our information suggests that both of these may be true. The fact that the rapid rate of household formation predated the creation of the RDP village suggests that there were independent processes leading to the reduction of household size. The creation of the RDP village certainly helped this process along. It seems clear that some of the ‘household formation’ processes around the RDP village were fairly distinctive, as shown by the peak in household formation and dissolution shown in . On the other hand, a comparison (in ) between the newly formed households within the South African villages and those in the RDP housing scheme suggests that the processes were part of the same continuum.
The economic accounts draw attention to the fact that changes in the cost of resources are likely to also change behaviour. We would expect households to act in ways to take advantage of the opportunities that opened up to them with the political, social and economic changes that occurred since 1994. Changes in living arrangements and hence household size follow as a consequence.
6.4. Changing preferences
Of course people will only take advantage of cheaper land to move out, if they (in some sense) prefer to live separately to living with a larger household. More generally, we noted earlier that there is a debate among sociologists whether African families are becoming more ‘nuclear’ (Ziehl, Citation2001; Russell, Citation2003a, Citation2003b). The patterns of household formation and dissolution discussed above would certainly suggest that couples or other ‘minimal household units’ (Ermisch & Overton, Citation1985) are leaving larger households and setting up independently.
These patterns cannot reveal, however, whether these changes in living arrangements reflect real changes in the underlying social relationships. As Russell has argued, people are embedded in long-lasting social relationships. Taking a snapshot across these relationships is not guaranteed to reveal the full set of connections. People may be part of an extended family system, even though they spend many years of their life in what looks like a ‘nuclear’ household.
These objections undoubtedly have considerable validity. It is possible that we are observing a moment in which households are reshaping themselves. For instance, it is possible that the ‘refugee’ households are sending out small ‘scout parties’ that try to establish themselves in new locations and that larger households may reconstitute themselves around them in due course as happens also in the case of ‘chain migration’ (MacDonald & MacDonald, Citation1964). Indeed, the strong ‘within household change effect’ among Mozambican households in South African villages might hint at such a process. Nevertheless, it is also possible to overplay this sort of objection. What makes our study site interesting is precisely that it allows us to track households over several years. Furthermore, it is at the ‘rural’ end of the continuum. Russell's objection makes most sense in the context of urban migrants that are analysed without taking due cognisance of their rural social relationships.Footnote4 Our data set includes the urban migrants provided that they are still identified as household members by the rural household.
Furthermore there are good grounds for believing that rural households may have been under considerable internal social strain. In the late 1980s the Bushbuckridge area saw considerable political conflict which took the form inter alia of generational conflict (Niehaus, Citation2001). The ‘youth’ of the area was seen as rejecting many of the ‘traditional’ values of their elders. Given this background one might have expected some changes in the living arrangements.
Besides the generational dimension, there may very well also be a gender dimension. In the old ‘bantustan’ areas, women had no rights to land or housing except through men. With the establishment of democracy in 1994 that pressure on women to stay with a male partner or parent would have been reduced. At the same time the ‘development controls’ implicit in the traditional authority system weakened. The combination of those two forces may also have led to changes in household living arrangements.
7. Conclusion
The empirical evidence from this paper suggests that there are two linked mechanisms operating in the Agincourt area which served to bring down aggregate household size:
the provision of free housing (in the shape of the RDP village) induced strong household formation. Some of this may have been ‘bogus’ (households sending some members to stake claims to available infrastructure), but certainly not all of it.
the reconstitution of households to gain better access to services, such as the move out of ‘refugee’ villages
Changes in land rights (particularly of women) may also have played a role. Conflicts around traditional systems of control (of the older generation over the younger; and men over women) may have made setting up of new households more attractive. Arguably all of these forces were also operating nationally over this period. The roll-out of RDP housing, water, sanitation and electricity infrastructure in the late 1990s are likely to have fuelled new household formation. Apartheid was a system that was based on extensive location controls. The end of apartheid removed these. The extension of rights to women and other marginal groups, particularly in the rural areas, would have enabled these to create new living arrangements for themselves.
One of the contributions of this paper is to highlight once more how triangulating national trends with high quality local data can provide new insights. We showed that the reduction in household size visible in the national datasets is not a mere artefact of measurement, or of too many one person households. The reduction is real and the mechanisms go far beyond an increase in one person households.
A further contribution has been to develop a novel decomposition technique that enables us to pick apart the different dynamics associated with RDP housing, refugee integration into South African communities and developments within the South African subpopulation itself.
Nevertheless our study is based on developments in one location. Given the importance of the RDP housing programme, it would seem that documenting how and where the national roll-out occurred would be a useful first step in analysing the impact of that programme nationally.
Supplemental Material
Download MS Word (19.3 KB)Acknowledgements:
This work is based on research supported by South Africa’s National Research Foundation (ESRC-NRF International Centre Partnership, Ref. ICPC150423117553). Any opinion, finding, conclusion, or recommendation expressed in this material is that of the authors, and the NRF does not accept any liability in this regard. Additional funding is acknowledged from the University of Cape Town, the University of the Witwatersrand, the South African Medical Research Council, the Wellcome Trust (Grants 058893/Z/99/A; 069683/Z/02/Z; 085477/Z/08/Z), the William and Flora Hewlett Foundation, the National Institute on Aging (NIA) of the NIH, and the Andrew W. Mellon Foundation. We would like to thank the Medical Research Council/University of the Witwatersrand Rural Public Health and Health Transitions Research Unit (Agincourt) for their unstinting support over many years and for making their data available.
Disclosure statement
No potential conflict of interest was reported by the author(s).
Additional information
Funding
Notes
1 There are a few records where we cannot determine the citizenship of the head of the household. These cases have been pooled with the ‘South African’ households.
2 It is , i.e. the first term of the disaggregation given in equation 2 in the appendix.
3 It reports the terms in Equation (2) of the appendix.
4 Even in that context successive cross-sections should capture individuals at all stages of this process.
References
- Amoateng, A & Kalule-Sabiti, I, 2008. Socio-economic correlates of the incidence of extended household living in South Africa. Southern African Journal of Demography 11(1), 75–102.
- Bhorat, H & van der Westhuizen, C, 2013. Non-monetary dimensions of well-being in South Africa, 1993.2004: A post-apartheid dividend? Development Southern Africa 30(3), 295–314. doi: 10.1080/0376835X.2013.817308
- Börsch-Supan, A, 1986. Household formation, housing prices, and public policy impacts. Journal of Public Economics 30, 145–64. doi: 10.1016/0047-2727(86)90042-3
- Burch, TK. 1970. Some demographic determinants of average household size: An analytic approach. Demography 7(1), 61–69. doi: 10.2307/2060023
- Case, A & Menendez, A, 2007. Does money empower the elderly? Evidence from the Agincourt demographic surveillance site, South Africa. Scandinavian Journal of Public Health 35(Suppl.69), 157–164. doi: 10.1080/14034950701355445
- Collinson, MA, 2010. Striving against adversity: the dynamics of migration, health and poverty in rural South Africa. Global Health Action 3(5080). doi: 10.3402/gha.v3i0.5080
- Collinson, M, Garenne, M, Tollman, S, Kahn, K & Mokoena, O, 2000. Moving to Mkhuhlu: Emerging patterns of migration in the new South Africa. Working Paper, forthcoming as a chapter in the African Census Analysis Project monograph series volume 1.
- Collinson, M, White, M, Ginsburg, C, Gómez-Olivé, F, Kahn, K & Tollman, S, 2016. Youth migration, livelihood prospects and demographic dividend: A comparison of the census 2011 and Agincourt Health and demographic surveillance system in the rural northeast of South Africa. African Population Studies 30(2 Supp), 2629–39.
- Cross, C & Harwin, SJ, 2000. A preliminary outline of migration trends in South Africa’s central provinces, based on the October Household Survey 1995. Interim report to CIU Spatial Guidelines for Infrastructure Delivery Initiative.
- DHA (Department of Human Settlements), 2014. Celebrating 20 years of Human Settlements: Bringing the Freedom Charter to life. National Department of Human Settlements, Republic of South Africa, Pretoria.
- Dinkelman, T, 2011. The effects of rural electrification on employment: New evidence from South Africa. American Economic Review 101(7), 3078–108. doi: 10.1257/aer.101.7.3078
- Dolan, CG, Tollman, SM, Nkuna, VG & Gear, JS, 1997. The links between legal status and environmental health: A case study of Mozambican refugees and their hosts in the Mpumalanga (eastern Transvaal) Lowveld, South Africa. Health and Human Rights, 2(2), 62–84. doi: 10.2307/4065272
- Ermisch, JF & Overton, E, 1985. Minimal household units: A new approach to the analysis of household formation. Population Studies 39, 33–54. doi: 10.1080/0032472031000141266
- Ermisch, J & Salvo, PD, 1997. The economic determinants of young people’s household formation. Economica 64, 627–44. doi: 10.1111/1468-0335.00103
- Gaunt, C, 2005. Meeting electrification’s social objectives in South Africa, and implications for developing countries. Energy Policy 33, 1309–17. doi: 10.1016/j.enpol.2003.12.007
- Hargreaves, JR, Collinson, MA, Kahn, K, Clark, SJ & Tollman, SM, 2004. Childhood mortality among former Mozambican refugees and their hosts in rural South Africa. International Journal of Epidemiology 33(6), 1271–1278. doi: 10.1093/ije/dyh257
- Harris, T, Collinson, M & Wittenberg, M, 2017. Aiming for a moving target: The dynamics of household electricity connections in a developing context. World Development 97, 14–26. doi: 10.1016/j.worlddev.2017.03.016
- Haurin, DR, Hendershott, PH & Kim, D, 1993. The impact of real rents and wages on household formation. Review of Economics and Statistics 75(2), 284–93. doi: 10.2307/2109434
- Kahn, K, et al., 2012. Profile: Agincourt health and socio-demographic surveillance system (Agincourt HDSS). International Journal of Epidemiology 41, 988–1001. doi: 10.1093/ije/dys115
- Kahn, K, Tollman, S, Collinson, M, Clark, S, Clark, B, Shabangu, M, Gómez-Olivé, F, Mokoena, O & Garenne, M, 2007. Research into health, population and social transitions in rural South Africa: data and methods of the Agincourt health and demographic surveillance system. Scandinavian Journal of Public Health 35(Suppl. 69), 8–20. doi: 10.1080/14034950701505031
- Kerr, A & Wittenberg, M, 2015. Sampling methodology and field work changes in the October household surveys and labour Force surveys. Development Southern Africa 32(5), 603–12. doi: 10.1080/0376835X.2015.1044079
- Klasen, S & Woolard, I, 2009. Surviving unemployment without state support: unemployment and household formation in South Africa. Journal of African Economies 18(1), 1–51. doi: 10.1093/jae/ejn007
- MacDonald, JS & MacDonald, LD, 1964. Chain migration Ethnic Neighborhood formation and social Networks. The Milbank Memorial Fund Quarterly 42(1), 82–97. doi: 10.2307/3348581
- Moultrie, T & McGrath, N, 2007. Teenage fertility rates falling in South Africa. South African Medical Journal 97(6), 442–43.
- Niehaus, I, 2001. Witchcraft, power and politics: Exploring the occult in the South African Lowveld. Pluto Press, London.
- NT (National Treasury), 2015. Executive summary: Programmatic and costing comparison of the housing programmes. https://www.gtac.gov.za/perdetail/Housing%20Programmatic%20Comparison%20Read%20More.pdf.
- Posel, D, Fairburn, JA & Lund, F, 2006. Labour migration and households: A reconsideration of the effects of the social pension on labour supply in South Africa. Economic Modelling 23, 836–53. doi: 10.1016/j.econmod.2005.10.010
- RMZ (Rhizome Management Services), 2015. Programmatic and costing comparison of the housing programmes: Performance and expenditure review. https://www.gtac.gov.za/perdetail/1.2%20Technical%20report.pdf.
- Russell, M, 2003a. Are urban black families nuclear? A comparative study of Black and White South African family norms. Social Dynamics 29(2), 153–76. doi: 10.1080/02533950308628679
- Russell, M, 2003b. Understanding Black households: The problem. Social Dynamics 29(2), 5–47. doi: 10.1080/02533950308628674
- Sartorius, B, Kahn, K, Collinson, MA, Vounatsou, P & Tollman, SM, 2011. Survived infancy but still vulnerable: spatial-temporal trends and risk factors for child mortality in rural South Africa (Agincourt), 1992-2007. Geospatial Health 5(2), 285–295. doi: 10.4081/gh.2011.181
- Schatz, EJ, 2009. Reframing vulnerability: Mozambican refugees’ access to state-funded pensions in rural South Africa. Journal of Cross-Cultural Gerontology 24(3), 241–258. doi: 10.1007/s10823-008-9089-z
- Schatz, E, Madhavan, S, Collinson, M, Gómez-Olivé, X & Ralston, M, 2015. Dependent or productive? A new approach to understanding the social positioning of older South Africans through living arrangements. Research on Aging 37(6), 581–605. doi: 10.1177/0164027514545976
- Spiegel, A, Watson, V & Wilkinson, P, 1996. Domestic diversity and fluidity among some African households in Greater Cape Town. Social Dynamics 22(1), 7–30. doi: 10.1080/02533959608458599
- Tollman, S, 1999. The Agincourt field site - evolution and current status. South African Journal of Medicine 89(8), 855–57.
- Tollman, S, Herbst, K, Garenne, M, Gear, J & Kahn, K, 1999. The Agincourt demographic and health study - site description, baseline findings and implications. South African Journal of Medicine 89(8), 858–64.
- Wittenberg, M & Collinson, M, 2007. Household transitions in rural South Africa, 1996-2003. Scandinavian Journal of Public Health 35(Suppl.69), 130–7. doi: 10.1080/14034950701355429
- Wittenberg, M, Collinson, M & Harris, T, 2017. Decomposing changes in household measures: household size and services in South Africa 1994-2012. Demographic Research 37(#39), 1297–326. doi: 10.4054/DemRes.2017.37.39
- Ziehl, S, 2001. Documenting changing family patterns in South Africa: Are census data of any value? African Sociological Review 5(2), 36–62. doi: 10.4314/asr.v5i2.23190