
ABSTRACT
Services are the fastest growing portion of world trade and now account for nearly a quarter of global exports. This presents opportunities for emerging economies to adapt and enter new markets. Many countries in southern Africa have struggled to diversify from a heavy reliance on primary commodities towards manufacturing industries. Tradable services could contribute to economic growth and development by bolstering industrial capabilities, facilitating productivity growth, and contributing directly to exports. We examine evidence on international services trade for the Southern African Development Community between 1995 and 2012. Tradable services appear to have made a limited contribution to total trade for most countries, and there is little evidence of significant regional integration or specialisation in higher value-added activities. The role of tradable services is an important policy and research agenda that warrants much more attention all round.
1. Introduction
African countries have generally struggled to upgrade their position in global value chains and remain locked into the supply of raw materials for value-addition elsewhere. The globalisation of production over the past few decades has witnessed the rise of low-cost industrial producers in East Asia. They have dominated the world market for most manufactured goods, leaving limited room for industrialisation among late-starters in Africa. Opportunities for the growth of manufacturing in Africa have been further complicated by the adoption of labour-saving techniques and the ‘near-shoring’ of selective production activities back towards the headquarters of multinationals. How then do African economies diversify beyond their dependence on primary commodities? Where are the possibilities for them to access wider markets and improve their position within global value chains?
An underexplored channel for economic growth is through service-related industries. Service exports have risen substantially as a share of global trade in recent decades and have been spurred forward through the globalisation of production and finance, lower travel costs, enhanced digital connectivity and the growing importance of knowledge and information. The contribution of services has also increased as an input into manufactured goods in response to consumer demand for more sophisticated and branded products. Lead multinationals are increasingly outsourcing lower-value activities, including labour-intensive manufacturing, and maintaining control of higher-value services such as marketing, design, R&D, and after-sales support (Kaplinsky & Morris, Citation2016; Fessehaie, Citation2017).
The varied sophistication, skills and technology of service industries offers a range of opportunities for African countries with different economic capabilities. Relatively undeveloped economies could access international markets in less-skilled sectors such as tourism and call centres. Higher-value services could bolster the performance of agriculture, mining and manufacturing at different stages of maturity by enhancing their competitive strengths and facilitating access to new markets (Hoekman & Shephard, Citation2017). The challenge for many parts of Africa is to develop the expertise and know-how within a range of service sectors that can be applied more broadly across their economies. Growing indigenous capacity in higher-order services could also help to reduce their large and costly trade deficits in information and communications technologies, the creative industries and related sectors.
This paper explores the available evidence on the contribution of services to international trade in the Southern Africa Development Community (SADC) over the past two decades. The paper makes two main contributions to existing knowledge. First, we review the arguments for the growing role of services in global production and consider the implications for African trade and development. Second, we assess the size and nature of international services trade flows for African countries and with the rest of the world over the period 1995–2012. To our knowledge, this is the first attempt to provide a detailed analysis of international trade flows in services for African countries. International trade data misses the indirect contribution of services in local value chains. However, focusing on international trade serves as a useful starting point in an under-researched domain.
2. The role of services trade in economic development
There is an ongoing debate in the literature about the potential for services to promote growth and structural transformation in less-developed countries (Ghani & O’Connell, Citation2014; Gollin et al., Citation2016; Di Meglio et al., Citation2018; Rodrik, Citation2018). The historical sequence of economic development is from primary (agriculture and mining) to secondary (manufacturing) and eventually tertiary (service) industries. Manufacturers benefit from economies of scale that absorb surplus labour, raise productivity and increase wages and living standards (Andreoni & Tregenna, Citation2018). Industrialisation played a pivotal role in today’s developed economies as well as in the accelerated growth and transformation of China and other East Asian countries. Services typically contribute more to GDP at later stages, once there is a strong industrial base that can sustain domestic demand. Although contemporary industrial policy in Africa has sought to promote manufacturing, in most countries the sector has actually stagnated or even declined in recent decades (SADC, Citation2015; Razzaque, Citation2017; UN-ECA, Citation2017; Rodrik, Citation2018). Strong competition from low-cost producers in East Asia has squeezed the markets for consumer goods and intermediate goods, whilst powerful multinationals control global supply chains and make it difficult for rival producers in other countries to gain entry.
Manufacturing opportunities have been further complicated by the growing importance of services in capturing and controlling global value chains. Product supply chains are increasingly characterised by thick layers of service-related value addition (Hoekman & te Velde, Citation2017; Beverelli et al., Citation2017; Heuser & Mattoo, Citation2017). Technological change, such as automation and artificial intelligence, has intensified the role of knowledge-intensive services, whilst eroding the comparative advantage of cheap-labour producers (McMillian et al., Citation2014; Rodrik, Citation2016; Nayyar et al., Citation2018). Consumer demand for high-tech products has encouraged growing sophistication of production with a premium for services such as R&D, product design, engineering and computing. Services have also become more prominent in steering global production networks by shaping consumer markets through branding, advertising and after-sales support (such as customer care and repair/maintenance). The embodied value of services across the production chain has therefore risen, squeezing out routine manufacturing, otherwise known as the ‘servicification’ of manufacturing (Cooke, Citation2017; Fessehaie, Citation2017). Similarly, there is evidence that modern services (such as IT and 3D printing) can lead the expansion of manufacturing, rather than the other way round (Dasgupta and Singh, Citation2005; Di Meglio et al., Citation2018).
A closely related but distinct issue is the evolution of global trade towards higher levels of service imports and exports (OECD, Citation2017; McKinsey Global Institute, Citation2019). Services have historically been viewed as ‘non-tradable’ because service production and delivery to customers are often closely linked, which means that trade can only occur locally. However, this has been changing with breakthroughs in telecommunications and advances in air travel (Balchin et al., Citation2016; Hoekman & te Velde, Citation2017). For instance, the digitalisation of information enables the electronic delivery of services across borders at virtually no cost. Sales of music, films, e-books and computer games are obvious examples. Services can also be traded internationally through alternative modes of cross-border delivery (United Nations, Citation2011).Footnote1 For example, many services are delivered through the physical movement of people (either consumption by tourists abroad, or the temporary travel of a service provider to a foreign market), or by establishing a permanent commercial base in a foreign market.
The complexity of service-based trade means that companies that produce services have to navigate many institutional obstacles and regulatory barriers related to licensing, product standards, certification procedures and financial payments. Nevertheless, global trade in services has risen steadily from 9% of global exports in 1970 to nearly a quarter of world trade today (Stephenson & Drake-Brockman, Citation2014; WTO, Citation2017). This trend is not restricted to advanced economies. According to the World Trade Organisation (WTO) (Citation2016), service exports amongst Least Developed Countries grew twice as fast as those of the rest of the world between 2005 and 2015.
Understanding the role of services in trade and value chains is often hampered by failing to take account of the enormous diversity of service industries (Bhorat et al., Citation2018; Di Meglio et al., Citation2018). Treating them as similar and equivalent to each other ignores important distinctions in their core characteristics and influence within global networks of production. The potential for any particular service sector to grow will ultimately depend on a country’s capabilities and competitiveness, and the commercial dynamics and rivalry within that component of the economy.
identifies some of the main sources of heterogeneity among service industries across a spectrum from relatively routine (low value added) to complex (high value added) activities. This is a simplification of reality because services vary across multiple dimensions which do not necessarily overlap with each other, including their capital intensity, sophistication of production, skill requirements and type of destination markets. Nevertheless, tourism is typically a low-value sector with relatively low levels of workforce skill, and target markets that are not unduly difficult to access. In contrast, software development is a high-value sector requiring expensive capital equipment, access to advanced technologies and professional expertise. Key parts of the software industry may also be difficult to penetrate because of market dominance by a few global players and increasingly complex regulatory barriers relating to intellectual property and personal privacy. An industry like construction involves a mixture of both routine and complicated tasks, and could span sub-sectors from straightforward real estate management services to intricate infrastructure design and financial appraisal.Footnote2 Markets involving foreign governments may be particularly difficult for firms to access because of the need to build trusting relationships and negotiate labyrinthine procedures governing public procurement.
Figure 1. Categorisation of heterogenous service industries.
Source: authors’ own.
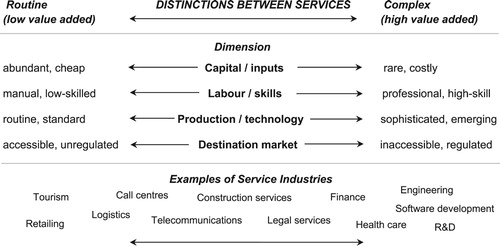
At the risk of oversimplification, relatively uncomplicated service industries like transport and tourism may be more accessible to African economies with better potential for labour absorption. However, low-value service sectors tend to lack market power and scope for major productivity gains, so they could offer modest scope for growth and development over the longer-term. Fostering expertise and know-how in higher-order services is more challenging, but could offer strategic benefits in helping firms in other industries to upgrade their capabilities and adapt to changing market conditions. Examples of such linkages include the role of R&D and satellite services in improving agricultural productivity; marketing and financial services to enable farmers to diversify into agro-processing, and engineering services to develop new mining equipment and mineral processing techniques to boost mining production. Evidence shown below suggests that SADC countries incur immense balance of payments deficits from importing high-value services from foreign companies, which may provide scope for import substitution.
The evolving role of services in international trade and value chains is important for Africa because most countries are struggling to industrialise and need to explore additional options for employment growth and strengthening their overall economic competitiveness. Trade within Africa has been low historically, but services could be a sensible place to start reversing this trend (UN-ECA, Citation2017). Positive examples from South Africa include the relative success of MTN within the telecommunications industry. It currently has over 230 million subscribers and the dominant market share in 14 out of 22 African countries in which it operates (MTN, Citation2019). Standard Bank claims to be Africa’s largest lender and generated 31% of its headline earnings outside South Africa, whilst insurance group Sanlam has major operations in 11 countries across sub-Saharan Africa (Standard Bank, Citation2019; Sanlam, Citation2019).
Recent developments in regional trade agreements may create opportunities for expanding services trade between African firms. The SADC Trade in Services Protocol, adopted in 2012, commits SADC countries to trade talks every three years focused on six priority sectors: communication services, construction services, energy-related services, financial services, tourism services, and transport services. Similarly, the Common Market for Eastern and Southern African States (COMESA), the EAC (East African Community), and their integration with the SADC through the Tripartite Free Trade Area (TFTA) in 2015 includes explicit commitments to regional services trade integration (Cattaneo, Citation2017). There is also growing momentum behind the African Continental Free Trade Area (AfCFTA), where there are plans for a services protocol that would reduce general tariffs on services trade as well as other non-tariff barriers, such as mutual recognition of standards and simplification of licensing and certification procedures (UN-ECA, Citation2018). The AfCFTA could develop into the largest free trade area in the world if all 55 member states of the African Union are incorporated, with a combined GDP of US$3.4 trillion (Parshotam, Citation2018).
It is difficult to put a precise value on the potential continental market for African firms because of the diversity of service industries, the lack of information on the demand for services within many countries, and the unknown balance between domestic and foreign service providers at present. However, it would be hard to deny the inherent potential for domestic companies to expand their service exports considering that: (i) services are the fastest growing segment of global trade, (ii) rapid urbanisation in Africa is fuelling demand for all kinds of infrastructure (transport, energy, water, sanitation, etc) and supporting professional services, and (iii) economic growth in the region should disproportionately spur demand for tertiary services as economies mature and their needs become more elaborate. For instance, South African construction companies hold less than 2% of a $130-170 billion annual market for infrastructure projects on the continent, despite their recognised strengths and proximity to African markets (African Development Bank et al, Citation2017; Deloitte, Citation2018).
Notwithstanding the market potential, there are considerable risks for companies trying to trade across borders if they do not prepare properly for foreign market conditions, commit to building durable relationships with local partners and customers, or neglect subtle regulatory issues. For example, South African telecommunications giants MTN and Vodacom have both experienced protracted and costly disputes with foreign governments over unpaid taxes. MTN has been forced to pay hefty penalties for non-compliance with communications regulations in Nigeria (Business Day, Citation2019). Construction firm Group Five faces the prospect of bankruptcy because of serious complications it experienced in the delivery of the Kpone Power Plant in Ghana (Engineering News, Citation2017; Business Day, Citation2018).
In order to achieve their full economic potential, African trade agreements need to do more than simply reduce tariff barriers. Enlarged markets will attract foreign direct investment, but there is more to be done to strengthen economic development in Africa. Genuine economic integration within the continent goes beyond increasing the quantum of trade and FDI. There is scope for greater economic specialisation between countries, improved access to financial capital, more extensive transfer of technology and know-how, and greater mobility of scarce skills and expertise across borders (Fessehaie, Citation2017; Beverelli et al., Citation2017). A variety of non-tariff barriers to trade also need to be addressed, including poor road and rail connectivity, inefficient logistics, unresponsive customs and border controls, exchange-rate volatility and general political instability (African Development Bank et al., Citation2017).
The role of South Africa is crucial given its dominant economic position in the SADC region. The country arguably has much to offer other economies through its proven capabilities in high-order services such as finance and insurance, telecommunications and IT, engineering and construction (Bhorat et al., Citation2018; Turok & Visagie, Citation2019). Yet market penetration needs to be mutually beneficial or to develop in both directions in order to be sustainable politically. Cross-border trading and investment arrangements should offer gains to both countries, and one-sided, extractive outcomes should be avoided. For example, the South African companies Shoprite (in retailing) and Tsogo Sun (in hotels) have been criticised periodically for failing to support local suppliers (Bench Marks Foundation, Citation2009; Telfer & Sharpley, Citation2016). Regional trade agreements might seek to develop specialised region-wide competencies in particular sub-sectors for servicing continental and ultimately global markets, whereby clusters of inter-related firms and their suppliers would benefit from a shared pool of proficient labour, encourage technology spillovers and the diffusion of tacit knowledge, and gain advantages from collective investments in specialised infrastructure (World Bank, Citation2018). This is about strategic economic cooperation and goes beyond trade, foreign investment and supplier development.
3. Data and methods
There is clearly a case for considering the role of tradable services as a potential driver of economic development on the African continent. We turn now to evaluate the available evidence for services trade in Southern Africa over the past two decades. Unfortunately, data limitations make it difficult to evaluate the indirect contribution of services to trade through their participation in local value chains and the embodied value of services in manufactured goods and primary products. However, as a useful point of departure, there is systematic data available for assessing the direct contribution of services to external trade.
We make use of curated balance of payments data from the OECD and WTO for the period 1995–2012, known as the Balanced Trade in Services (BaTIS). Balance of payments records face issues of comparability due to differences in the way in which countries collect and record their trade statistics. For instance, there are usually significant gaps in reporting the size and composition of South-to-South trade or in accounting for detailed categories of service sector trade (Fortanier et al., Citation2017). The BaTIS attempts to ‘balance’ and fill in any gaps by using mirror data (cross-checking of recorded exports and imports between countries) and statistical modelling to forecast values for missing records.Footnote3 The end result is a complete set of balance of payments services trade bi-laterals for 191 economies, broken down into 11 main service categories for the years 1995–2012.
Closer inspection of the BaTIS data for African countries suggests the need for care when interpreting some of the results. African countries in particular do not record details about the country of origin (for imports) or the country of destination (for exports) in balance of payments statistics (only the total value of services trade with the rest of the world is recorded). Mirror data can overcome some of this inherent weakness, but the BaTIS estimates of trade flows between any two particular African countries admittedly relies heavily on modelled data. Data modelling is also used to augment information for detailed service sub-sectors in specific instances where there are gaps. We are careful to highlight where there is potential for error when discussing the results.
The challenge of compiling reliable services trade data is partly due to the more complex ways in which services are delivered between producers and consumers compared with merchandise (goods) trade. Balance of payments data do not record services delivered through a commercial presence in a foreign market (known as ‘mode 3’ in the United Nations Manual on Statistics of International Trade in Services). Companies which establish a base in a foreign market are usually considered ‘resident’ after operating in that country for more than a year and hence fall away from subsequent balance of payments records.Footnote4 Foreign affiliates can account for two-thirds of total international services trade in highly integrated regions such as the Eurozone (Rueda-Cantuche et al., Citation2016). We do not pretend to give a complete account of all services trade between firms from SADC countries, but rather the extent to which African countries are connected regionally and globally through their balance of payments transactions.
4. Findings
4.1. The relative size and composition of international services trade in SADC countries
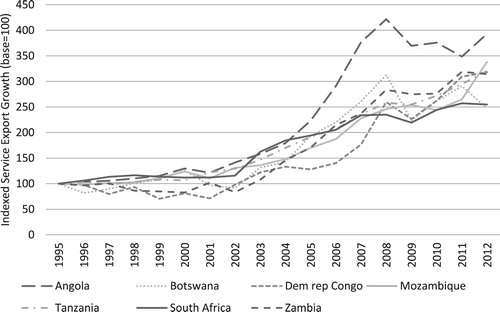
We start with a review of the relative growth and composition of service exports from SADC countries. shows the trajectory of service exports to the rest of the world from SADC’s seven largest economies (which were broadly representative of aggregate performance in the SADC region). Service exports were fairly stagnant between 1995–2002, with little sign of growth. There was a clear turning point in 2002, following the global commodity boom of the mid-2000s, which propelled services exports to reach a high in 2008, before falling again with the onset of the global financial crisis. Average export growth was above 10 percent per annum during this period, although some of the solid performance probably reflects the influence of rising foreign exchange. Service exports fell in the years following the global financial crisis but were quick to bounce back and averaged more than 4 percent year-on-year growth between 2009 and 2012. The main message is that growth of international services trade was initially fairly limited amongst SADC countries, but may have begun to expand more consistently since the mid-2000s.
Figure 2. Services export growth, 1995–2012.
Source: OECD-WTO BaTIS database (Citation2018). Note: Trade flows are converted to constant prices using a US GDP deflator.
There could be many reasons for the recent growth of services trade in southern African economies so it is important to review such trends in context. presents a summary of trade in services relative to merchandise trade and its growth relative to GDP.
Table 1. Relative size and growth of services exports in SADC.
First, the top row of the table shows that service exports were usually a small share of total trade, although with some important variations between countries. Services were generally less than about 15% of total exports, which suggests that they played a minor role in international trade (notwithstanding value-addition in domestic production and value chains). The main exception was the smaller island economies, including Mauritius, Seychelles and Madagascar, which depended on their services exports through tourism-related trade.
Second, the other rows of the table show that growth in service exports tended to occur more or less in line with national GDP growth. Each figure shows the ratio between services export growth and GDP growth between 1995–2012, broken down by sub-sector. A ratio of over one means that services exports were growing faster than GDP, and less than one means they were growing slower than GDP. Total services growth (the top row of the eight) was relatively fast in the Seychelles (1.8 times GDP growth), but for most SADC countries it was broadly in line with aggregate economic growth.
Third, there was a noticeable bias towards growth in more knowledge-intensive, higher-value services. Traditional sectors such as transport and travel tended to keep pace with or lag behind GDP growth, whereas the other categories generally registered higher rates of growth. The three leading export services for SADC countries over the period were IT, communications, and construction (growing at 2–3 times the rate of GDP growth). Transport and travel were the slowest growing sectors. This suggests a slight shift towards higher-order services in the export basket of some SADC countries.
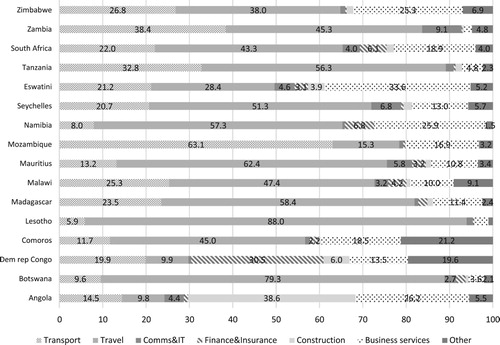
However, closer inspection of the data cautions against any strong message of modernisation or upgrading of service exports. presents a breakdown of the contribution of each service sub-sector to total service exports for SADC countries in 2012. Transport and travel made up the majority of trade in most cases. The combined total of IT and (tele)communications exports never exceeded 10 percent of total exports for any SADC country and was generally under 5 per cent. The business services sector, which included a range of modern professional services, accounted for 15 percent of total exports on average, although this category also includes a number of undefined service activities.Footnote5 In other words, the performance of higher-value services came off a low base, and therefore would have had a weak impact on aggregate services growth. The lower-value sectors of transport and travel needed to be at least growth-neutral if knowledge-intensive services were to tilt aggregate performance into the positive.
Figure 3. Detailed breakdown of the composition of services exports in SADC, 2012.
Source: OECD-WTO BaTIS database (Citation2018).
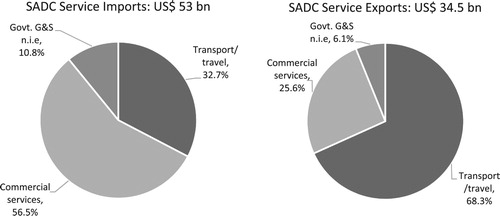
The importance of understanding the sectoral makeup of services trade becomes very clear when explaining the large services trade deficit in most SADC countries. provides an overview of total service imports compared to total service exports for the SADC region split into three categories: ‘transport/travel’, ‘commercial services’, and ‘government’.Footnote6 The SADC region ran up a large balance of payments deficit in 2012 of US$18.5 billion. Total services imports were approximately 1.5 times the size of total exports. This was mostly driven by large net imports of commercial services.Footnote7 The notable exception was travel, which contributed towards a trade surplus of US$8 billion. The relative strength of travel-related exports suggests that policy makers should not underplay the traditional strength of tourism in bolstering trade and improving access to foreign exchange for many African countries.
Figure 4. Overview of service imports and exports in SADC, 2012.
Source: OECD-WTO BaTIS database (Citation2018). Notes: The percentages reflect the weighted average across SADC countries.
In summary, countries in southern Africa may have started to expand their international services trade, at least since the mid-2000s. However, service exports remained small compared with merchandise exports for most countries. Better performing commercial service sectors were too small to make much impact on total services growth and would need to grow substantially to occupy a more significant place in southern Africa’s export basket. Higher-order service sectors were the source of large trade deficits, which suggest there is a need to grow knowledge-intensive services from African firms into the future.
4.2. Flows of international services trade for SADC countries between regions
A further important dimension of services trade in southern Africa is the geographical spread of services trade bi-laterals, both between countries in the region, and into the rest of the world. To what extent did services trade between countries in SADC suggest the emergence of a regional trading bloc?
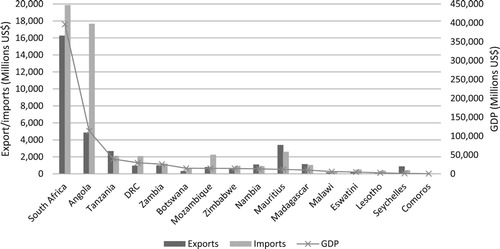
shows that there were large differences in the absolute size of services trade flowing from SADC countries, consistent with large differences in total GDP. South Africa accounted for nearly half of total service exports in the SADC region in 2012 (and 57% of regional GDP). Therefore, total SADC trade was largely dependent on the performance of South Africa. Angola was ranked second for total services exports amongst SADC countries and incurred an immense trade deficit due to much higher services imports. Mauritius, in contrast, accumulated a healthy services trade surplus and outperformed its economic rank as the tenth largest economy in the SADC by being the third largest exporter of services. Outside the top three SADC exporters, the remaining 13 SADC countries each accounted for less than 3 percent of service exports for the region. Therefore, smaller SADC countries were fairly insignificant when viewed in isolation, but collectively added up to 30 percent of the service export market (and a similar share of GDP). This points to the need for regional integration. Large inequalities in services trade (and GDP) between SADC countries, and in particular the hegemonic position of South Africa, need to be carefully navigated to ensure that trade is sustainable.
Figure 5. Total services trade in SADC ranked by GDP, 2012.
Source: OECD-WTO BaTIS database (Citation2018). Notes: GDP in 2012 sourced from World Bank (Citation2019).
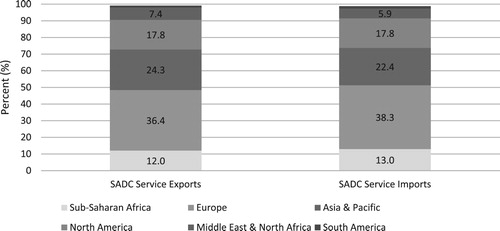
splits up flows of international services trade for SADC countries from and to global trading partners in 2012. The geographic distribution of SADC’s service exports was very similar to its service imports. This suggests that international trade tends to create flows in both directions. Trade from SADC countries into the rest of sub-Saharan Africa was very low at 12 and 13 percent of total SADC service exports and imports respectively. South Africa was the largest market in southern Africa, but imported only 5 percent (and exported 11 percent) of its traded services from/to its neighbours in sub-Saharan Africa. SADC countries were twice as likely to trade with countries in Europe and North America then with other African countries. Together, Europe and North America made up 60.7 percent of the export/import market of SADC trade in services. There are admittedly concerns with this form of data – trade bi-laterals between less developed countries depend heavily on modelled estimates – but it is unlikely that data problems could explain away such clear patterns. The picture that emerges consistently depicts only a limited role for intra-African trade amongst SADC countries.
Figure 6. Total services exports and imports by major regions, 2012.
Source: OECD-WTO BaTIS database (Citation2018).
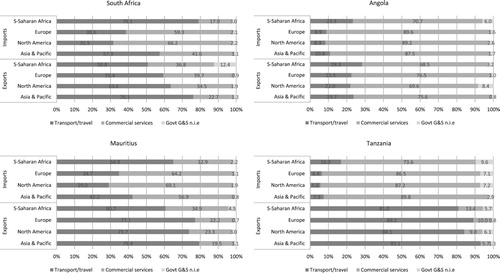
We end our analysis of the evidence on services trade in southern Africa by combining both sectoral differences in the composition of services exports and imports with the regional distribution of services trade. highlights the mix between traditional transport/travel services and modern commercial services for SADC’s four largest services-exporting countries (which make up four-fifths of exports for the region).Footnote8 The figure reveals that the composition of exports and imports was sensitive to the choice of destination/source market. Imports from countries in sub-Saharan Africa were typically skewed towards lower-value transport and travel sectors, particularly for South Africa and Mauritius. In comparison, higher-order services were more likely sourced from European and North American countries. Meanwhile, service exports from these SADC countries were dominated by traditional transport and travel sectors, particularly when exporting outside of Africa.Footnote9 Summing up, there was a clear pattern of exporting low-value traditional services to developed regions whilst importing high-value commercial services. This imbalanced pattern of trade acts as a brake on economic development in Africa.
Figure 7. Composition of services exports by sector and region, largest SADC service exporters 2012.
Source: OECD-WTO BaTIS database (Citation2018).
Overall, there is little sign of SADC countries operating as a regional trade bloc when it comes to service industries, because the levels of intra-African trade are low. Countries in southern Africa are more likely to import and export services from and to Europe and North America than to trade with their neighbours on the continent. SADC economies show greater capacity for lower-value service exports to the rest of the world. They are also more dependent on imports from outside Africa to supply them with high-order services.
5. Conclusions
The argument for taking services seriously in Africa stems from the poor performance of manufacturers on the continent and the changing role of services in global trade and value chains. The traditional role of industrialisation in promoting growth and structural change in low-income countries has been complicated by the dominance of low-cost manufacturers in East Asia and ongoing technological disruption. Services have risen in prominence both in terms of their direct contribution to global trade through digitalisation and globalisation, as well as in their indirect contribution to production through capturing and controlling thick-layers of value-addition within global production networks. There is wide diversity within the service economy, ranging from low- to high-level service activities, thereby providing various opportunities to improve intra-African trade across this spectrum.
A systematic review of the available evidence drawing on balance of payments records for SADC countries suggests that services make only a limited contribution to international trade in southern Africa, with signs of a possible upturn since the mid-2000s. The composition of service exports from SADC countries has been heavily skewed towards lower-value transport and travel sectors, although there are indications of stronger growth in some higher-value commercial services such as IT and (tele)communications (from a low base). High-level services were mainly imported from Europe and North America, resulting in large trade deficits, with room for import-substitution. Intra-African trade flows are consistently a small fraction of total services trade in the region. The majority of trade flows between southern Africa and Europe or North America. There is little sign of regional value chains orientated towards services between SADC countries. South Africa occupies a dominant position in the region, with roughly half of all services imports and exports into and out of SADC. Therefore, South Africa has a decisive influence on the aggregate performance of services trade.
The limited scale of international services trade in southern Africa raises important questions about why this is the case. One possible explanation is that a large part of the story may be missing from the data analysed here: service industries could be growing but through foreign direct investment and setting-up local branches, rather than through service exports. Related to this is the market power of large multinationals, particularly in knowledge-intensive services, that expand their reach through mergers and acquisitions of African companies. Management consultants, such as McKinsey, and engineering companies, such as Arup, have been steadily extending their footprints across the continent. Another possibility is that African markets are inaccessible, despite physical proximity, due to various language, cultural, institutional, regulatory and physical barriers. African companies may lack the appetite or underestimate the effort required to overcome these hurdles and fail to invest sufficiently in building long-term relationships or in creating a local presence.
More research is evidently needed to better understand the obstacles to services trade in southern Africa. It matters a great deal whether the growth of tradable services is mainly constrained by trade barriers, state regulations and bureaucratic procedures, or by the restrained mindsets, strategies, and internal capabilities of firms themselves. This includes a deeper appreciation for how to develop domestic firms’ capabilities, whether through boosting the supply of advanced skillsets, fostering business networks and mutual learning, or encouraging foreign suppliers to transfer expertise by forming joint ventures with local companies. The right approach will probably vary between sectors depending on the specific challenges and opportunities faced. Investment in human capital is bound to be a foundational issue as a vital input to all service industries. This means fostering closer ties between industry, colleges and universities, and updating curricula regularly. African countries should also make it easier for skilled personnel to move across borders by simplifying visa controls, recognising foreign qualifications and making cities welcoming places for foreigners to stay.
Finally, there is a clear need to improve the collection of international services trade data for African countries in line with WTO/UN guidelines. At the very least, balance of payments records should include partner country information and more detailed sub-sector classifications. Better data would improve the basis for negotiations in trade rounds with the WTO and in regional trade agreements. Efforts to measure the activities of foreign firms operating through local branches are also important in order to monitor this alternative mode of market entry.
Disclosure statement
No potential conflict of interest was reported by the author(s).
Additional information
Funding
Notes
1 The WTO/UN measures the international trade of services under the General Agreement on Trade in Services (GATS) across four modes of supply: Mode 1: Cross-border supply; Mode 2: Consumption abroad; Mode 3: Commercial presence; Mode 4: Presence of a natural person. Some of the technicalities related to measuring services trade are discussed further in Section 3.
2 Construction is considered as a ‘secondary’ sector in terms of Standard Industry Classification codes. However, the nature of construction trade is similar to services in that production tends to take place at the same time and location as consumption. The UN/WTO Manual on Statistics of International Trade in Services includes measurement of construction services (United Nations, Citation2011).
3 See Fortanier et al. (Citation2017) for a detailed account of the BaTIS methodology. The approach leverages all available official data, and combines these with derivations, backcasting techniques, interpolation, predictions derived from regression models, and cross-checking of mirror data in records of exports and imports between countries.
4 The same rule applies to the value of trade in services of temporary migrants who work abroad for more than 12 months (which are classified under ‘mode 4’ in the United Nations Manual on Statistics of International Trade in Services (see United Nations, Citation2011)).
5 Business services include: ‘(i) Research and development services, (ii) Professional and management consulting services and (iii) Technical, trade-related and other business services. (i) Research and development services consist of services that are associated with basic and applied research, and experimental development of new products and processes. (ii) Professional and management consulting services include (a) legal services, accounting, management consulting, managerial services, and public relations services; and (b) advertising, market research, and public opinion polling services. (iii) Technical, trade-related, and other business services include: (a) architectural, engineering, and other technical services; (b) waste treatment and depollution, agricultural, and mining services; (c) operating leasing services; (d) trade-related services; and (e) other business services n.i.e.’ (WTO Citation2017: 89).
6 ‘Transport/travel’ incorporates the traditional transport and travel sectors; ‘Commercial services’ incorporates higher-value sectors of telecommunication, IT, construction, finance and insurance, and business services sectors; and ‘Government’ includes government goods and services n.i.e. (not incorporated elsewhere), which include goods and services supplied to embassies or other enclaves and to diplomats and military personnel.
7 A large part of the trade deficit is driven by excessive services imports from Angola (see ). If Angola is excluded from the analysis, the large trade deficit is significantly lower at US$ 5.7 billion although still substantial.
8 See and footnote 5 for an explanation of the definitions of these categories. ‘Government goods and services n.i.e.’ is included as a small residual category.
9 Surprisingly, two-thirds of Angola’s exports into Sub-Saharan Africa and other regions consisted of modern services. A closer inspection of the data shows that construction exports (and imports) were unrealistically high and drove most of this result. This is hard to make sense of other than by noting that Angola recorded high levels of construction exports to the world in its balance of payments, and it deserves further scrutiny.
References
- African Development Bank, Organisation for Economic Co-operation and Development, & United Nations Development Program, 2017. African economic outlook 2017: Entrepreneurship and industrialisation. OECD Publishing, Paris. http://doi.org/10.1787/aeo-2017-en.
- Andreoni, A & Tregenna, F, 2018. Stuck in the middle: premature deindustrialisation and industrial policy. CCRED Working Paper 11/2018. Johannesburg: Centre for Competition, Regulation and Economic Development. https://ssrn.com/abstract=3269739.
- Balchin, N, Hoekman, BM, Martin, H, Mendez-Parra, M, Papadavid, P & Te Velde, DW, 2016. Trade in services and economic transformation. Supporting Economic Transformation Report Nov 2016. Overseas Development Institute, London.
- Bench Marks Foundation, 2009. Shoprite in Malawi, Swaziland and Zambia. Bench Marks Foundation, Marshalltown. www.bench-marks.org.za
- Beverelli, C, Fiorini, M & Hoekman, B, 2017. Services trade policy and manufacturing productivity: The role of institutions. Journal of International Economics 104, 166–182. doi:10.1016/j.jinteco.2016.11.001
- Bhorat, H, Steenkamp, F, Rooney, C, Kachingwe, N & Lees, A, 2018. Understanding and characterizing the services sector in South Africa: An overview. Development Policy Research Unit Working Paper 201803. University of Cape Town: DPRU.
- Business Day, 2018. Group Five’s struggles deepen as Kpone delays in Ghana bite: The full- year loss has deepened and veteran CFO Cristina Teixeira has resigned. 2 October. https://www.businesslive.co.za/bd/companies/industrials/2018-10-02-group-fives-struggles-deepen-as-kpone-delays-in-ghana-bite/ Accessed 25 January 2019.
- Business Day, 2019. ‘MTN stock records its longest slide since 1995: The group’s shares have fallen more than 12% in eight days’. 6 March. Available at: https://www.businesslive.co.za/bd/companies/telecoms-and-technology/2019-03-06-mtns-shares-slide-to-worst-level-since-september-2018/ Accessed 10 April 2019.
- Cattaneo, N, 2017. Trade in services negotiations: A Southern African perspective. International Centre for Trade and Sustainable Development (ICTSD), Geneva.
- Cooke, J, 2017. Data on trade and investment services. In B Hoekman & DW te Velde (Eds.), Trade in services and economic transformation. Overseas Development Institute, London, pp. 29–31.
- Dasgupta, S & Singh, A, 2005. Will services be the new engine of Indian economic growth? Development and Change 36(6), 1035–58.
- Deloitte, 2018. African construction trends report 2018. Deloitte Touche Tohmatsu. https://www2.deloitte.com/za/en/pages/energy-and-resources/articles/africa-construction-trends-report.html Accessed 10 April 2019.
- Di Meglio, G, Gallego, J, Maroto, A & Savona, M, 2018. Services in developing economies: The deindustrialization debate in perspective. Development and Change 49(6), 1495–525. doi:10.1111/dech.12444
- Engineering News, 2017. Group Five expects material earnings impact as Kpone drags. 19 December. Available at: www.engineeringnews.co.za/article/group-five-expects-material-earnings-impact-as-kpone-drags-2017-12-19 Accessed 25 January 2019.
- Fessehaie, J, 2017. Leveraging the services sector for inclusive value chains in developing countries. International Centre for Trade and Sustainable Development (ICTSD), Geneva.
- Fortanier, F, Liberatore, A, Maurer, A, Pilgrim, G & Thomson, L, 2017. The OECD-WTO balanced trade in services dataset. World Trade Organization and Organisation for Economic Co-operation and Development.
- Ghani, E & O’Connell, S, 2014. Can service be a growth escalator in low-income countries? World Bank Policy Research Working Paper 6971. Washington, DC: World Bank. http://doi.org/10.1596/1813-9450-6971.
- Gollin, D, Jedwab, R & Vollrath, D, 2016. Urbanization with and without industrialization. Journal of Economic Growth 21(1), 35–70.
- Heuser, C & Mattoo, A, 2017. Services trade and global value chains. Policy Research Working Paper 8126. World Bank, Washington, DC.
- Hoekman, B & Shepherd, B, 2017. Services productivity, trade policy and manufacturing exports. The World Economy 40, 499–516. doi:10.1111/twec.12333
- Hoekman, B & te Velde, DW, 2017. Trade in services and economic transformation. Overseas Development Institute, London.
- Kaplinsky, R & Morris, M, 2016. Thinning and thickening: Productive sector policies in the era of global value chains. European Journal of Development Research 28(4), 625–45. doi:10.1057/ejdr.2015.29
- McKinsey Global Institute, 2019. Globalization in transition: The future of trade and value chains. McKinsey & Company, New York.
- McMillan, M, Rodrik, D & Verduzco-Gallo, I, 2014. Globalization, structural change, and productivity growth, with an update on Africa. World Development 63, 11–32. doi:10.1016/j.worlddev.2013.10.012
- MTN, 2019. Integrated report for the year ended 31 December 2018. Johannesburg: MTN Group. https://www.mtn.com/investors/financial-reporting/integrated-reports/ Accessed 16 April 2019.
- Nayyar, G, Da Cruz, V & Jose, M, 2018. Developing countries and services in the new industrial Paradigm. Policy Research working paper WPS 8659. World Bank Group, Washington, DC. http://documents.worldbank.org/curated/en/779941543850019036/Developing-Countries-and-Services-in-the-New-Industrial-Paradigm.
- OECD, 2017. Services trade policies and the global economy. OECD Publishing, Paris. http://doi.org/10.1787/9789264275232-en.
- Organisation for Economic Co-operation and Development and World Trade Organization. 2018. Balanced trade in services (BaTIS) database. World Trade Organization, Geneva. https://www.wto.org/english/res_e/statis_e/trade_datasets_e.htm
- Parshotam, A, 2018. Can the African continental free trade area offer a new beginning for trade in Africa? South African Institute of International Affairs Occasional Paper 280. South African Institute of International Affairs, Johannesburg.
- Razzaque, M, 2017. Using services to promote manufacturing-led structural transformation. In B Hoekman & DW te Velde (Eds.), Trade in services and economic transformation. Overseas Development Institute, London, pp. 13–14.
- Rodrik, D, 2016. Premature deindustrialization. Journal of Economic Growth 21(1), 1–33.
- Rodrik, D, 2018. An African growth miracle? Journal of African Economies 27(1), 10–27. doi:10.1093/jae/ejw027
- Rueda-Cantuche, JM, Kerner, R, Cernat, L & Ritola, V, 2016. Trade in services by GATS: Modes of supply, statistical concepts and first EU estimates. Chief Economist Note, Issue 3, November. European Commission, Brussels.
- SADC, 2015. The Southern African Development Community (SADC) regional industrialisation strategy and roadmap 2015–2063. Southern African Development Community, Harare.
- Sanlam, 2019. Sanlam global footprint: about. Sunlam, Cape Town. https://www.sanlam.co.za/about/Pages/sanlamglobal.aspx# Accessed 14 June 2019.
- Standard Bank, 2019. Standard Bank group annual integrated report 2018. Standard Bank Group, Johannesburg. https://annualreport2018.standardbank.com/
- Stephenson, S & Drake-Brockman, J, 2014. The services trade dimension of global value chains: Policy implications for Commonwealth developing countries and small states. Commonwealth Trade Policy Discussion Paper 4/2014. Commonwealth Secretariat, London.
- Telfer, D & Sharpley, R, 2016. Tourism and development in the developing world: second edition. Routledge, New York.
- Turok, I & Visagie, J, 2019. Tradable services, value chains and the gauteng economy. In S Scholvin, A Black, J Revilla Diez & I Turok (Eds.), Value chains in Sub-Saharan Africa: challenges of integration into the global economy. Springer International Publishing, Cham, pp. 253–275.
- United Nations Economic Commission for Africa (UN-ECA), 2017. Economic report on Africa 2017. UN. http://doi.org/10.18356/2da6f7c9-en.
- United Nations Economic Commission for Africa, 2018. African continental free trade area: Questions & answers. African Trade Policy Centre of the Economic Commission for Africa. African Trade Policy Centre (ATPC), Addis Ababa.
- United Nations, 2011. Manual on statistics of international trade in services 2010. United Nations, New York. http://unstats.un.org/unsd/tradeserv/TFSITS/msits2010.htm
- World Bank, 2018. An incomplete transition: Overcoming the legacy of exclusion in South Africa. Republic of South Africa Systematic Country Diagnostic Report 125838-ZA. World Bank, Washington, DC.
- World Bank. 2019. World Bank open data portal: World Bank national accounts data. World Bank, Washington, DC. https://data.worldbank.org/
- World Trade Organisation (WTO), 2016. World trade statistical review 2017. World Trade Organization, Geneva.
- World Trade Organisation (WTO), 2017. World trade statistical review 2017. World Trade Organization, Geneva.