
ABSTRACT
An effective social assistance system needs to be sustainable and affordable and needs to provide good coverage and adequate benefits. The authors’ model to forecast the cost of the South African social assistance system to 2040 provides insights into key cost drivers. This allows policy-makers to explore the effects of policy levers like benefit levels and coverage. Using assumptions derived from analysis of past experience, the model projects that the cost of grants as a percentage of GDP is expected to remain stable. However, this result is very sensitive to GDP forecasts, coverage, grant increases and changes to the retirement age. The following factors are less significant: changes to age-eligibility requirements for child benefits, proportions of benefits paid, expense inflation and population model.
1. Introduction
1.1. Background
During the year ended 31 March 2019, the South African Social Security Agency (SASSA) made almost 210 million grant payments to over 17 million people (SASSA, Citation2019). Over R161 billion was spent on the old age grant (OAG), disability grant (DG), child support grant (CSG), foster care grant (FCG) and care dependency grant (CDG), which make up 99.23% of the full benefit spend (SASSA, Citation2019).
South Africa has an unfunded and non-contributory social grant system. Such arrangements rely heavily on inter-generational transfers and positive economic growth (Forteza, Citation2015) and hence affordability and sustainability are key risks. South African grants are paid from general tax revenue (Woolard et al., Citation2011), more than 60% of which is derived from personal income tax and value added tax (VAT) (National Treasury & South African Revenue Service, Citation2018). Over the period 1 April 2013–31 March 2018, benefit costs in respect of social grants rose from 11.5% of tax revenue to 12.3% (National Treasury & South African Revenue Services, Citation2018; SASSA, Citation2019). World Bank (Citation2018a) argues that further expansion of social grants, given slower growth of both the economy and tax revenue, is fiscally unsustainable.
South Africa currently has a large working-age and youth population relative to the very young and the very old, but life expectancy is rising and fertility is falling (National Planning Commission, Citation2012). It is this dynamic which has led to many social assistance systems around the world becoming unaffordable (World Bank, Citation1994). This suggests that the grant system could come under financial pressure in both the short and long term due to budget constraints and demographic changes.
1.2. Aims
The authors aimed to construct the first iteration of a model that could project the cost of the South African social assistance system to 2040 with sufficient flexibility to allow policy-makers to assess the financial impact of decisions around coverage, age limits and grant levels. This should enable policy-makers to explore trade-offs and maximise the effectiveness of the grant system, given budget constraints. The model could also be used as a basis for further research.
The aim of this article is to introduce the model and expand on the insights that the authors gained during development that may be of interest to policy-makers.
1.3. Contribution to knowledge
Social assistance models have been prepared periodically by National Treasury and others, sometimes as part of a larger social security modelling exercise.Footnote1 Published results of these exercises are relatively common, for example Van Zyl et al. (Citation2017), but this represents the first freely available model for use by stakeholders.Footnote2
No model can be expected to predict the exact total cost of the grant system accurately. The degree of uncertainty around the results increases over time. However, the model presented here is useful to provide a general idea of cost and the sensitivity of costs to various policy levers.
1.4. Plan of development
In section 2 we will consider how social assistance systems are assessed, as this gives insight into key policy levers. Section 3 summarises South Africa’s social assistance system. In section 4, the model is outlined. Section 5 details the results of the experience investigation and model output and a discussion of these results. Section 6 concludes.
2. How do we assess social assistance systems?
The criteria used to assess social assistance systems can be grouped into four broad categories: beneficiaries, benefits, cost and funders.
2.1. Beneficiaries
Two key evaluation metrics are coverage and beneficiary incidence.
Coverage is the percentage of the population that receives benefits from a social assistance system (World Bank, Citation2018b). Cichon et al. (Citation2004) and van Ginneken (Citation2003) consider coverage to be one of the most important indicators of the performance of a social assistance system.
Coverage is constrained by the budget and the willingness and ability of beneficiaries to register (Guhan, Citation1994). Within these constraints, the income distribution of the beneficiaries, or beneficiary incidence, shows how effective a system is at reaching the poor (World Bank, Citation2018b). If more than 20% of beneficiaries belong to the bottom 20% of per capita income, the system is considered pro-poor (World Bank, Citation2018b).
2.2. Benefits
An effective benefit system provides adequate benefits, but this is difficult to define.
Measuring benefits relative to the poverty line, minimum wage or international minimum standards does not account for different social needs or the distribution of income above and below the benchmarks (Dixon, Citation2000). The level of benefits could be measured against household consumption, but there is no agreed standard for this as different benefit programmes have different objectives (World Bank, Citation2018b).
An alternative approach is to consider the impact on poverty (World Bank, Citation2018b), which is a function of the benefit amount, beneficiary incidence and the form the benefit takes. Assessing this criterion requires an examination of both the incidence and extent of poverty with and without the benefit (Barrientos, Citation2007). Incidence can be measured by the percentage of the population living in poverty, known as the poverty rate.Footnote3 Extent can be measured by the poverty gap, which measures the mean income of poor families relative to the poverty line.Footnote4
2.3. Cost
Total grant costs comprise of benefit cost and expense cost. The benefit cost is a product of the number of beneficiaries and the amount of benefits (Cichon et al., Citation2004) and hence is a function of both coverage and benefit level.
A key criterion for evaluating a social assistance system is affordability. While there are many ways to measure affordability, in an unfunded non-contributory system like South Africa’s the options are dependency ratios and measures against Gross Domestic Product (GDP) (Cichon et al., Citation2004).
The dependency ratio can be defined as the ratio of total number of beneficiaries to the number of contributors to the social security system (Cichon et al., Citation2004). In an non-contributory system, the contributors may be taken to be taxpayers (Cichon et al., Citation2004), but in the South African context this is complicated by the fact that grants are paid from general tax revenue including VAT. Hence it is difficult to produce a meaningful dependency ratio in South Africa, which leaves share of GDP as the most logical way to measure affordability in the South African context. Most social assistance schemes require 0.2% to 2% of GDP (Leisering, Citation2009; Woolard et al., Citation2011); however, Guhan (Citation1994) set a target of 3% of GDP to cover social security for developing countries.
Using share of GDP to measure cost also allows for the sustainability of the system given the current tax system to be assessed (Goss, Citation2010). However, this assumes a stable tax-to-GDP ratio.
2.4. Funders
Aaron (Citation1982) emphasised that it is necessary to consider the fairness of the tax systems used to finance social security systems, both in terms of generations and groups.
International Labour Office (Citation2014) explains that taxes on consumption such as VAT are burdensome to the poor, and that in the interests of fairness and economic recovery the focus of raising tax revenues should shift to progressive taxes such as taxes on personal income, corporate profits and imports and exports. However, very high progressive tax rates could induce emigration out of the country, reducing the taxpaying base (Mishra, Citation2006).
3. An overview of the South African social assistance system
This section gives a broad overview of the social assistance system as well as a brief evaluation of the current system.
3.1. The grant system
The full social assistance system consists of the OAG, CSG, DG, FCG and CDG (‘the core grants’) as well as a grant-in-aid, social relief of distress and the war veteran’s grant.
3.1.1. The core grants
The core grants are set out in . All grants are payable only to individuals who are citizens, permanent residents or refugees who reside in South Africa. In the case of the CSG and other grants payable in respect of children, the grant may be paid to the caregiver.Footnote5 The values in are the maximum amounts payable.
Table 1. The core grants.
The means-tests are set out currently in Government Notice R511 (Citation2016) but are periodically updated. These regulations apply one means-test to the OAG and DG and another to the CSG and CDG, although both differentiate by marital status. For the OAG and DG, a partial grant payment is possible in cases where the income falls within a specific bracket, which is a function of the minimum and maximum grant value. An asset test also applies. No partial grants are paid and no asset test is applied for the CSG or CDG. The means-test criteria based on the October 2019 grant values are given in . Regulations allow for the possibility of the FCG to be means-tested but this grant is currently paid irrespective of household income.
Table 2. The means-test criteria for the core grants.
3.1.2. Other grants
The three other grants make up less than 1% of the grant expenditure (SASSA, Citation2019). These grants were excluded from analysis as they are not material relative to the overall expenditure in the normal course of events. It is noted that the social relief of distress grant is issued monthly for a maximum of three months to citizens not in receipt of other grants in periods of local and national disaster (SASSA, Citation2019). Modelling of such periods of disaster is beyond the scope of this paper and an area for further work.
3.2. How does the current grant system fare?
3.2.1. Beneficiaries
The core grants cover about 30% of the total population.Footnote6 However, about two-thirds of children under 18 and adults over 60 receive a core grant.Footnote7 The beneficiary incidence pattern is pro-poor as 69% of all cash transfers by count in South Africa are made to the poorest 40% of individuals (Woolard et al., Citation2011).
3.2.2. Benefits
Non-contributory means-tested systems tend to be more effective as redistributive programmes than contributory arrangements where benefits are linked to contributions (Forteza, Citation2015). Social assistance in South Africa has proven successful in reducing, but not eliminating, extreme poverty. In 2015, government social transfers are estimated to have reduced the poverty rate by 7.9% and the poverty gap by 29.5% (World Bank, Citation2018a). Statistics South Africa (Citation2019), on the other hand, noted that households’ financial wellbeing declined between 2011 and 2015, despite having greater access to grants, services and facilities. This suggests that benefit levels are not excessive given poverty levels.
3.2.3. Costs
South Africa’s spending on social; assistance has been over 3% of GDP since 2014/2015 (SASSA, Citation2019; Statistics South Africa, Citation2019). The benefit cost is projected to be 3.2%–3.3% of GDP each year from 2018/2019 to 2021/2022 (National Treasury, Citation2019). Hence the cost of grants in South Africa is already higher than many international norms. South Africa’s tax-to-GDP ratio has been between 25.5% and 25.9% between 2014/2015 and 2017/2018 (National Treasury & South African Revenue Service, Citation2018) which highlights the fact that tax collections and GDP may not move strictly in concert.
3.2.4. Funders
Studies have shown that South African middle- and lower-income groups face relatively large tax burdens due to VAT suggesting some regressive aspects of the tax system (Samson et al., Citation2001). However, the personal income tax system is strongly progressive, with the highest-earning 14.4% of taxpayers contribute 65.6% of the personal income tax (National Treasury & South African Revenue Service, Citation2018).
4. Materials and methods
The authors aimed to construct a model to measure the cost of the core grants and associated administrative expenses in the social assistance system as a percentage of GDP from 2018/2019 to 2039/2040. The projection year runs from 1 April to 31 March for consistency with the government financial year. The model measures efficiency, affordability and sustainability, given decisions around beneficiaries and benefits. Detailed output also includes the coverage in each year.
4.1. Model structure and operation
The model relies on a population projection model to estimate the number of beneficiaries. It also projects forward the real value of the GDP, grants and expenses. There is no feedback between the economic projections, coverage and population. This is a limitation that will be discussed in greater detail in section 6.
4.2. Model parameters
The model has input model parameters in six sections. Historic data and analysis thereon, which is described in section 5.1, was used to inform the assumptions for the results presented in this paper.
4.2.1. Population projection model
The Thembisa population projection models provide detailed demographic projections taking account of the spread and treatment of HIV/AIDS (Johnson et al., Citation2017). The Thembisa model was used because it was publicly available, published and could give year-by-year projections. The Thembisa models produce annual population counts as at 30 June and the projection model year runs from 1 April, so for ease of calculation it was assumed that population movements were linear during the year.
4.2.2. Expenses
The expense level associated with the social assistance scheme as well as the expense inflation that will apply per grant paid per annum over the projection period are variables in the model. The model assumes that expenses per grant paid per month are set in nominal terms each April and are only renegotiated the following year. Hence, expense inflation does not apply during the projection year.
4.2.3. Benefit age structure
The maximum age for the FCG and CSG and the minimum age for the OAGT1 and OAGT2 benefit are input parameters. In the model, the DG is assumed to cease at the age at which the OAGT1 commences.
4.2.4. Economic parameters
The 2018/2019 GDP is used as a departure point and five real GDP growth rates are used to project future GDP levels. The inflation rate is also a variable however the model works in real terms and hence this parameter is not material.
4.2.5. Grant increases
Grant increases have been specified subject to the constraint that the OAGT2 will always be greater than or equal to the OAGT1 benefit. The scenarios presented in this paper assume that, to preserve consistency within the grant structure, the DG and CDG are set equal to the OAGT1. The model accommodates different grant inflation rates for each grant type. The model assumes benefits only increase once annually on 1 April. This means the purchasing power of the grant declines during the year. Similarly, given the assumptions in 4.2.2, the expense cost also declines in real terms during the year.
4.2.6. Coverage and proportion paid
The starting coverage level as a percentage of the age-eligible population and the coverage growth rate are inputs in the model.
The average percentage of the maximum paid is a function of the means-test, which is expected to lower the amount, and back-pay, which is expected to increase it. This is fixed throughout the projection period in the current version of the model. These inputs should all be consistent with the chosen population projection model.
5. Results and discussion
In section 5.1, the results of the experience analysis are given. In section 5.2, actual model outputs are considered together with a sensitivity analysis.
5.1. Experience analysis and default parametrisation
In order to facilitate parameterisation decisions, the authors analysed expenses, grant increases, grant coverage and proportions paid. As SASSA does not produce any statistics on OAGT1 and OAGT2 separately, these benefits were analysed together and assumed to have equal coverage and proportion paid. The results of these analyses are discussed in turn before other default parameters are given. The default, or baseline, parameters are summarised in Appendix A.
5.1.1. Coverage
It was assumed that coverage rates will remain at 2018/2019 levels throughout the projection period. Projecting coverage forward is a function of the age-eligible population, beneficiary education and the number of individuals showing that they pass the means-test. The base scenario uses the current age structure of the social grant framework as shown in . Changes to economic conditions and the means-test would affect coverage (Van Zyl et al., Citation2017) and allowing for this in the model is left for future work.
5.1.2. Proportion paid
SASSA monthly statistical reports provide the number of grant beneficiaries on the system on a monthly basis. If one multiplies the known grant maximum amounts in each month by the number of grant beneficiaries at the end of the previous month and if one adds these together for the benefit year, one obtains an expected benefit amount for the year. This can then be compared to the actual grant amounts paid provided by SASSA (Citation2019) to obtain an estimate of the proportion paid.
It was decided to use the average proportion paid between 2015/2016 and 2018/2019 as the default assumption, which was close to 100%, but in some cases in excess of 100%, as this reflects current practice and provides some implicit provision for other grants.
The authors were concerned by the proportion paid being over 100%. This could suggest that backpayments are significant and means-testing does very little to reduce the benefits. SASSA (Citation2019) states that onboarding time has been reduced in most cases to a day. However, personal correspondence with SASSA indicates that a month delay in onboarding a CSG or DG recipient is typical and the delay may be slightly longer for an FCG recipient.Footnote8 The data thus suggests an inconsistency that merits further investigation.
5.1.3. Expenses
Operational expenses are detailed in SASSA’s annual reports. The actual expenses for 2018/2019, approximately R6.5 billion, were used as the default for the model.
When modelling expenses, it is important to consider whether they are fixed or variable. Fixed expenses are insensitive to volume while variable expenses would change with number of beneficiaries or total benefit cost. In 2018/2019, 49.11% of expenses related to personnel costs. While these are likely to be fixed in the short term, they will be variable in the longer term. The second largest expense item was for cash handling and payments, which makes up 20.19% of the expense cost. This is likely to be variable. Given the longer-term nature of the projections, it was decided to treat all expenses as variable. Hence the expenses were calculated per beneficiary per month and projected forward. It assumes that all expenses are attributable to the core grants, which may overstate the total cost of the core grants.
Expenses per beneficiary per annum have been declining in real terms since 2013/2014 as beneficiary numbers have increased and expenses declined. In particular, expenses in 2018/2019 were markedly lower due to the cancellation of a benefit administration contract and the closure of certain paypoints (SASSA, Citation2019). These structural changes are more likely to be one-off than recurring and thus past experience is likely to be a poor indication of the future. Personnel costs, which make up almost half the expenses, are generally anticipated to increase by 1% real per annum. It was decided to assume expenses would remain fixed in real terms over the projection period.
5.1.4. Grant increases
The FCG has declined by between 1% and 2% per annum in real terms between 2013/2014 and 2018/2019. All other grants have increased by 0%–1% per annum in real terms over the five-year period to 30 March 2019.
Hence, it was decided to project the grants as constant in real terms as the default assumption.
5.1.5. Other default assumptions
The Thembisa 4.2 population model was used as a default as this is the most recent version of the model (Johnson & Dorrington, Citation2019). National Treasury’s estimate of the 2018/2019 GDP was used as the GDP default value (National Treasury, Citation2019). The five scenarios selected are consistent with Cilliers (Citation2015), PricewaterhouseCoopers (PwC)Footnote9 and Indlulamithi South Africa Scenarios 2030 Trust.Footnote10 Cilliers (Citation2015) stated that the South African economy is unlikely to experience real growth of more than 2% each year until the electricity supply improves. This was taken to be the baseline GDP growth scenario. The default inflation assumption was 4.5% as this is the midpoint of the inflation-targeting band.
5.2. Baseline projection
The baseline projection is shown in . The comparison to the medium-term estimate by National Treasury (Citation2019) is shown in . This indicates that the baseline model results are 4–10 basis points lower than National Treasury’s estimates. This difference would be reduced by 2 basis points if an explicit allowance for other grants were made.
Figure 1. Baseline projection.
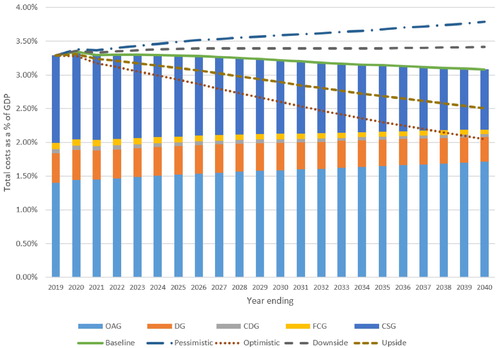
Table 3. Comparison of model and national treasury projections
The model also produces reasonable results if used to backtest the total costs since 2013/2014 as shown in . The fit for 2013/2014 is not good but this does not invalidate the model as:
Reality is subject to random variations which deterministic models cannot capture; and
The model is parametrised using assumptions that would apply in the future, not the past.
Figure 2. Model backtest.
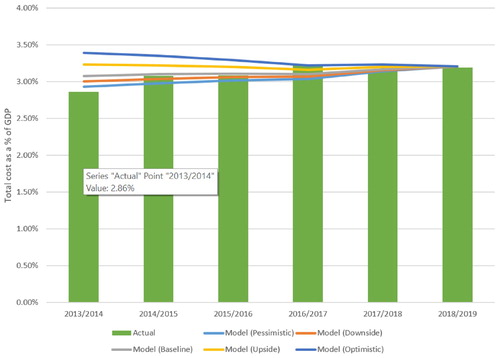
The baseline projection thus shows a good consistency with reality and official estimates.
5.3. Sensitivity analysis
It is important to test how the model output would have changed if other reasonable assumptions were used. In addition to the baseline projection, 26 alternative projections were carried out, each with one assumption altered. Demographic assumptions were not stress-tested apart from the use of an alternative population projection model and this sensitivity analysis is left for future research.
The sensitivity of the output to other assumptions is discussed below.
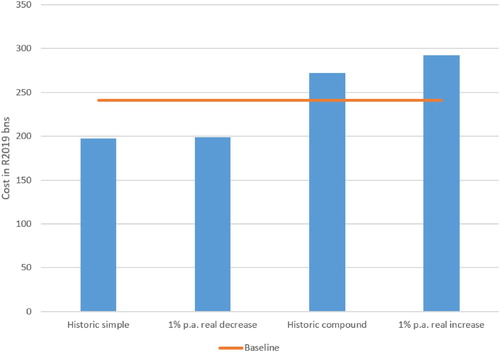
5.3.1. Grant values
Four alternative grant increase scenarios were tested: historic Rand amount increases, 1% per annum reduction in real terms, historic compound increases and 1% per annum increase in real terms. The latter two are more generous than the baseline assumption. This is shown in .
Figure 3. Sensitivity of cost to benefit increases.
5.3.2. Age eligibility: retirement age and children’s benefits
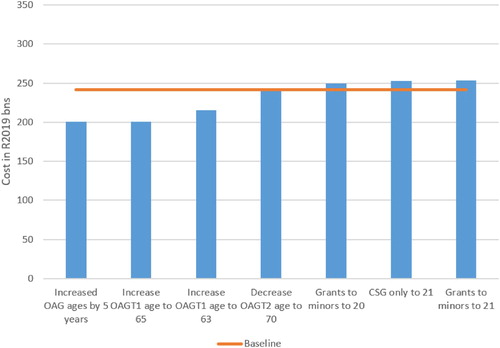
There is little sensitivity to the age eligibility of children. This is because, by 2039/2040, the ratio of age-eligible children to age-eligible older people will decline from approximately 4:1 to 2:1. In addition, the OAG is substantially larger than the CSG. The sensitivity to age structure of the OAG is understandably much more significant. As is shown in , relatively small increases to the starting age for the OAGT1 benefit could fund substantial changes to the CSG.
Figure 4. Sensitivity of cost to age-eligibility requirements.
5.3.3. Proportion paid
Although the benefit cost is directly proportional to the proportion paid, the overall result did not change significantly if other reasonable assumptions were used. This is because the proportion paid is consistently close to 100% on the OAG, which is a principal driver of cost. Applying the average proportions paid over the last three years or using the figures from 2017/2018 made very little difference to the result.
5.3.4. Expense inflation
Costs were generated on six different expense inflation scenarios. The average expense inflation per beneficiary per annum over the last five years produced the lowest cost, but this was still 97.63% of the baseline cost. Calculating expenses by applying historic total expense inflation to total expenses or expenses per beneficiary per annum or simply applying a real expense inflation rate of -1% per beneficiary per annum all resulted in very similar total costs. Even applying a 1% per annum real increase to total expenses or expenses per beneficiary per annum resulted in less than a 1% increase in costs relative to the baseline. Total costs are thus largely insensitive to the expense inflation assumption.
6. Conclusion
6.1. The model and criteria for assessing social assistance schemes
As discussed in section 2, social assistance schemes are assessed in terms of beneficiaries, benefits, costs and funders. The model is focused on cost metrics expressed as a percentage of GDP to allow policy-makers to assess affordability and sustainability. Detailed model output includes coverage rates but beneficiary incidence and the impact of economic conditions on coverage are not modelled. The impact of the grants on poverty are not measured currently by the model and hence it cannot be used to assess benefit levels. Put differently, the model focuses only on cost and not on the effectiveness of the benefit spend.
When parameterising the model, policy-makers should consider what the input parameters mean in terms of benefits and beneficiaries given that the output emphasises cost. The output should also be interpreted with care as the burden on groups or generations of taxpayers is not explored by the model.
6.2. Model sensitivity
A key finding of scenarios tested to date is that the total cost is very sensitive to GDP forecasts, coverage, grant increases and changes to the retirement age.
The model assumes linearity of the GDP growth, which is unlikely to be the case. There will be added fiscal pressure during economic downturns, particularly due to the means-tested nature of the benefits.
Actual coverage rates are erratic and model results are highly sensitive to the coverage assumed. This variability in actual coverage rates is likely to be driven by operational reasons, such as grant recipients having to reapply, or economic factors such as recipients having to prove they pass the means-test. Investigating this is left for future work.
6.3. Limitations
The model ignores the effect of economic conditions on mortality, fertility, migration and grant coverage as well as the effect of population structure on GDP growth. In addition, the model can be used to assess the cost of removing the means-test but not adjusting it. More complex economic modelling including modelling at a household level is left for future work.
6.4. Conclusions for policy-makers
6.4.1. The grant cost is expected to be stable over the next 20 years
On the baseline assumptions, the model projects that over the next 20 years, the cost of the grants as a percentage of GDP is relatively stable at 3% to 3.3% of GDP, with the increased cost of the OAG offsetting the lower cost of the CSG.
6.4.2. An expanded CSG can be funded by changes to the OAGT1
An expansion of the CSG or increase to its value could be funded from a relatively small increase to the age at which the OAGT1 commences. Adjusting the OAGT2 benefit will make very little difference due to its size and low numbers of recipients.
6.4.3. Cutting expenses will do little to grant costs
Expense efficiencies have been realised in recent years. This may free up funds to make a meaningful contribution elsewhere, but further cost savings will not materially reduce the cost of the grant system.
6.4.4. Data suggest high level of backpay
Since 2014/2015, almost all the grants seem to be paid at their maximum level with a considerable degree of backpay. Apart from the hardship caused by delayed grant payments, backpaid amounts typically require manual administration, which increases the cost of onboarding a new beneficiary. This raises questions about the value of the means test relative to its cost.
Acknowledgements
The authors would like to thank Maureen Shabangu at Black Sash for contacts at SASSA. Dianne Dunkerley of SASSA and her team including Edward Mphato Phatlane, Sipho Selby Zwane, and Simon Ntshifhefhe provided missing data and reports. The authors also thank Peter Carswell for advice on the model and Leigh Johnson for his advice on Thembisa models.
Disclosure statement
No potential conflict of interest was reported by the author(s).
Notes
1 For example, http://www.treasury.gov.za/comm_media/presentations/South%20Africa%27s%20long-term%20fiscal%20choices%205%20Nov%202014.pdf or http://www.treasury.gov.za/publications/other/ssrr/Session%20Two%20Papers/Social%20Security%20Projections.pdf. Accessed 3 November 2020.
2 The model is available at http://www.wits.ac.za/stats/social-security-research/. Accessed 3 November 2020.
3 Organisation for Economic Co-operation and Development. http://data.oecd.org/inequality/poverty-rate.htm#indicator-chart. Accessed 7 December 2019.
4 Organisation for Economic Co-operation and Development. http://data.oecd.org/inequality/poverty-gap.htm. Accessed 7 December 2019.
5 Grant booklet available at https://www.sassa.gov.za/Pages/Grant-Booklets.aspx. Accessed 3 November 2020.
6 Authors’ calculations using SASSA (Citation2019) and Thembisa 4.2.
7 Ibid.
8 SASSA, personal correspondence, 4 November 2019.
9 PricewaterhouseCoopers (2018). Investment decisions: Why South Africa, and why now? Forward-looking scenarios for the Ramaphosa presidency (2018–2022). https://www.pwc.co.za/en/assets/pdf/investment-decision-why-sa.pdf. Accessed 30 April 2019.
10 Indlulamithi (2018). Indlulamithi South Africa Scenarios 2030. http://sascenarios2030.co.za/wp-content/uploads/2018/09/SA-Scenarios-2030.pdf. Accessed 30 April 2019.
References
- Aaron, H, 1982. Economic effects of social security. The Brookings Institution, Washington, DC.
- Barrientos, A, 2007. The role of tax-financed social security. International Social Security Review 60(1), 99–117.
- Cichon, M, Scholz, W, van de Meerendonk, A, Hagemejer, K, Plamondon, P & Bertranou, F, 2004. Financing social protection. International Labour Office/International Social Security Association, Geneva.
- Cilliers, J, 2015. South African futures 2035 – can Bafana Bafana still score? Institute for Security Studies Papers 2015 (282), 32. https://repository.up.ac.za/bitstream/handle/2263/51774/Cilliers_South_2015.pdf?sequence=1&isAllowed=y.
- Dixon, J, 2000. A global ranking of national social security systems. International Social Security Review 53, 109–22.
- Forteza, A, 2015. Are social security programs progressive? IZA World of Labour Article, July 2015 172, 1–10.
- Goss, SC, 2010. The future financial status of the social security program. Social Security Bulletin 70(3), 111–25.
- Government Notice R511, 2016. Regulations relating to the application to and payment of social assistance and the requirements or conditions in respect of eligibility for social assistance. Government Gazette 39978, 6 May 2016.
- Guhan, S, 1994. Social security options for developing countries. International Labour Review 133(1), 35–53.
- International Labour Office, 2014. World social protection report 2014/15: building economic recovery, Inclusive development and social Justice. International Labour Office, Geneva.
- Johnson, LF & Dorrington, RE, 2019. Thembisa version 4.2: A model for evaluating the impact of HIV/AIDS in South Africa. University of Cape Town, Cape Town. https://thembisa.org/downloads Accessed 20 November 2019
- Johnson, LF, May, MT, Dorrington, RE, Cornell, M, Boulle, A, Egger, M & Davies, MA, 2017. Estimating the impact of antiretroviral treatment on adult mortality trends in South Africa: A mathematical modelling study. PLoS Medicine 14(12), e1002468.
- Leisering, L, 2009. Extending social security to the excluded. Global Social Policy: An Interdisciplinary Journal of Public Policy and Social Development 9(2), 246–72.
- Mishra, P, 2006. Emigration and brain drain: Evidence from the Caribbean: International monetary fund working paper No. 06-25. International Monetary Fund, Washington, DC. www.imf.org/en/Publications/WP/Issues/2016/12/31/Emigration-and-Brain-Drain-Evidence-From-the-Caribbean-18662. Accessed 17 November 2019.
- National Planning Commission, 2012. National development plan 2030 – our future – make it work. Government Printer, Pretoria.
- National Treasury, 2019. Budget review 2019. National Treasury, Pretoria. http://www.treasury.gov.za/documents/national%20budget/2019/review/FullBR.pdf. Accessed 20 November 2019.
- National Treasury & South African Revenue Service, 2018. 2018 tax statistics. South African Revenue Service, Pretoria. https://www.sars.gov.za/AllDocs/Documents/Tax%20Stats/Tax%20Stats%202018/Tax%20Statistics%202018.pdf. Accessed 15 November 2019.
- Samson, M, Babson, O, Haarmann, C, Haarmann, D, Khathi, G, Mac Quene, K & van Niekerk, I, 2001. The fiscal impact of a basic income grant in South Africa. Economic Policy Research Institute, Cape Town. https://socialprotection.org/discover/publications/fiscal-impact-basic-income-grant-south-africa. Accessed 17 November 2019.
- SASSA (South African Social Security Agency), 2019. Annual report 2018–2019. Government Printer, Pretoria.
- Statistics South Africa, 2019. P0441 – Gross Domestic Product (GDP) 1st quarter 2019. http://www.statssa.gov.za/?page_id=1854&PPN=P0441&SCH=7646. Accessed 9 December 2019.
- Van Ginneken, W, 2003. Extending social security: Policies for developing countries. International Labour Review 142(3), 277–94.
- Van Zyl, N, Melville, W & Muller, D, 2017, 24-25 October. A projection of the SA government’s social security obligations: 2017–2037. Actuarial Society of South Africa Convention, Cape Town, South Africa.
- Woolard, I, Harttgen, K & Klasen, S, 2011. The history and impact of social security in South Africa: experience and lessons. Canadian Journal of Development Studies 32(4), 357–80.
- World Bank, 1994. Averting the old age crisis: Policies to protect the old and promote growth. Oxford University Press, New York.
- World Bank, 2018a. Overcoming poverty and inequality in South Africa: An assessment of drivers, constraints and opportunities. The World Bank, Washington, DC.
- World Bank, 2018b. The state of social safety nets 2018. The World Bank, Washington, DC.
Appendix A
Table A1. Baseline parameters applied across all grants.
Table A2. Baseline Coverage and Percentage Paid Parameters