
Abstract
Optimal foraging theory predicts that in animals both the sizes of prey consumed and the range of prey sizes eaten should increase with increasing predator size. Rodent prey and rodent-eating snakes (their predators) can provide a useful model for testing the ecological correlates of these predictions. In this study, we explore the relationships between species richness of these predators and prey and the prey size and predator size relationships. The analysis was performed at the level of the whole of West and Central Africa. Distribution data and body size for each genus within both rodents and snakes were obtained from the literature, and mapped using the World Map program. Numbers of rodent and snake genera by cell increased significantly from North to South, this being consistent with typical macro-ecological patterns. Snake mean body size per cell and mean rodent body size per cell were not significantly correlated; however, when the same analysis was restricted to only rodent-eating snakes, this relationship became statistically significant. Cell vegetation type significantly affected the mean body size of both snakes and rodents, with body sizes being smaller in dry savannah cells than in Guinea savannah and forests cells.
Keywords::
Introduction
It has been demonstrated that the sizes of prey consumed generally increase with increasing predator size (e.g., Persson Citation1990; Juanes Citation1994) and that the range of prey sizes eaten typically increases in larger predators, with maximum prey size increasing while minimum prey size often changes only slightly over a broad range of predator sizes (e.g., Scharf et al. Citation2000). Hence, there is an evident asymmetric pattern in predator size–prey size relationships. This asymmetric pattern has been interpreted differently, and it has been postulated that the diet of smaller predators is a subset of the diet of larger predators (e.g., Wilson Citation1975; Cohen et al. Citation1993). In general, the positive relationships between prey size and predator size are interpreted as a result of traditional foraging theory predicting that animals should maximize their net rate of energy return when selecting prey (Schoener Citation1971; Charnov Citation1976; Stephens and Krebs Citation1986). Traditional foraging theory also predicts that, for particulate feeders, the largest prey available should be eaten to maximize feeding efficiency (Ivlev Citation1961; Werner and Hall Citation1974; Harper and Blake Citation1988). However, although the theoretical models behind the prey size–predator size relationships are robust, very little research has been devoted on organisms different from aquatic species, mainly fish (e.g., Scharf et al. Citation2000; Brose et al. Citation2006). In addition, there are complications because it has been demonstrated that carnivorous predator–prey body-size ratios vary across different habitats and predator and prey types (Brose et al. Citation2006).
Dietary diversity of a predator is certainly also influenced by the diversity of prey available (Iwasa et al. Citation1981; Green Citation1984; Citation1990; Stephens and Krebs Citation1986), and biodiversity (and hence prey diversity) is not equally distributed through the world (Wilson Citation1992). Instead, there are particular biodiversity “hotspots” in tropical regions and in some continents (MacArthur Citation1972; Rosenzweig Citation1995; Gaston Citation2000), and thus it may be predicted that higher diversity of potential preys may drive higher diversity of their predators. Predictably, this would be especially true for tropical South-America, Asia, and Africa.
In this study, we explore the relationships between (i) species richness of non-aquatic predators and prey and (ii) prey size and predator size in the system rodents (as prey) and snakes (as predators) for a tropical macro-region (West Africa). These two groups are ideal for analyzing these issues given that rodents are the main prey type for most snakes studied to date (Luiselli Citation2006a; Citation2006b).
Materials and methods
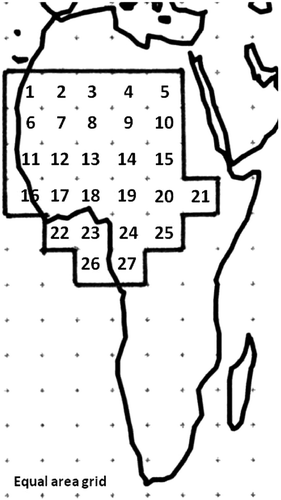
We included the whole of West Africa into our analysis (Figure ). In this paper, we analyzed the data at the genus level. This was done because (i) systematic of complex groups (like most rodents are) is more stable at the genus than at the species level (Amori et al. Citation2009); and (ii) the body mass of several species is not known, whereas the average body mass of each genus can be obtained easily from the literature (Nowak Citation1999). Distribution data for each genus within both rodents and snakes were obtained from the literature (for rodents: data from the Global Mammal Assessment of the IUCN 2012; for snakes: Chippaux Citation2007) and transformed into map form using the World Map program (WMP)(Williams Citation2001). In WMP, the two hemispheres were subdivided from North to South into 23 latitudinal bands (LB) from pole to pole, each one comprising a 10-ft (1 ft = 0.3048 m) latitudinal arc and formed by a set of cells of the same latitude (equal area grid; 36 columns × 24 rows = 864 cells of equal area each 611,000 km2 wide; see Williams Citation2001). A binary matrix was obtained on the basis of the distribution maps of the various genera, with “0” representing those cells with no presence of a given genus, and “1” those in which at least one species of given genus was found. Overall, 27 cells were included in our analyses (Figure ). The major vegetation types for each cell (according to White Citation1983, simplified) were dry savannah = cells 1–10, Guinea savannah = 11–15, forest mosaics = cells 16–21 and 26–27, and tropical lowland rainforest = cells 22–25.
For each genus of rodents and snakes, we compiled the mean body size (total length in cm) by averaging the maximum size of each species in the genus as reported by Nowak (Citation1999) for rodents and by Chippaux (Citation2007) for snakes. We considered that the body size is conserved within clades such that members of the same genus generally have similar sized bodies (although with a few exceptions, for instance, the genus Python; Chippaux Citation2007).
We tested the correlation between (log) mean body sizes of the various rodent genera with the (log) mean body sizes of the various snake species per cell by using the Pearson's correlation coefficient. In this case, we averaged the body size across genera within a particular grid cell (e.g., Python, Causus, and Bitis). When only one genus was found in a given cell, we considered the body size of that genus and not the genus average. In cells where some members of the snake genera eat rodents but others did not, we used for the analyses relative to the relationships between size of rodent-eater snakes and rodent size only the average size of the rodent eaters in the genus.
We also tested the correlation between (i) the number of rodent genera per cell with the number of snake genera per cell and (ii) the number of each cell (as reported in Figure ) with the respective numbers of rodent and snake genera. The two regression lines were then compared by one-way analysis of covariance (ANCOVA).
We also included the variable “vegetation zone” of each cell in ANOVA models to assess whether vegetation category had effect on snake and rodent body sizes. Vegetation zones come from White (Citation1983).
Alpha level was set at 5%, and all tests performed were two-tailed.
Results
The distribution of the various genera of both rodents and snakes in each cell are given in Appendices 1 and 2. In summary, these data showed that there was higher species richness for both rodents and snakes in the cells numbered from 11 to 27 (Figure ).
 ) and snakes (continuous regression line with •) (B). For the statistical details, see the text.
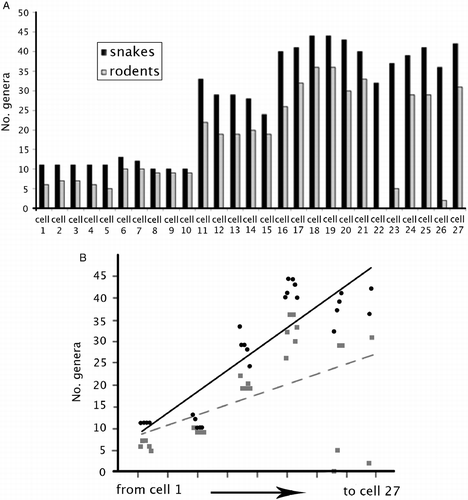
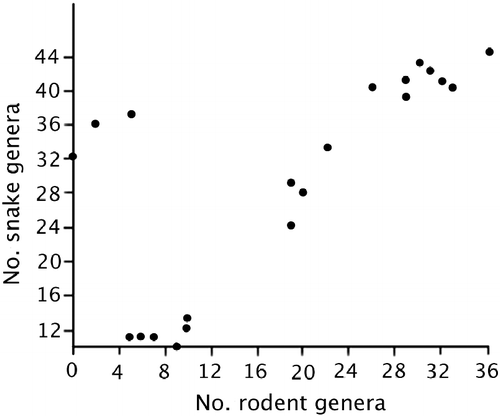
Looking at the patterns in more detail, the results showed that, as expected, the number of both rodent and snake genera by cell increased from North to South, i.e., from the Sahara toward the equator, with the correlations being statistically significant for both snakes (r = 0.88, P < 0.0001) and rodents (r = 0.493, P < 0.01). The two regression lines were heterogeneous, with the slope of the snake regression being higher than that of rodents (one-way ANCOVA: F = 6.713, P = 0.0123) (Figure ). The number of per cell genera of rodents was significantly correlated to that of snakes (r = 0.752, P < 0.0001; Figure ).
The genus richness of both rodents and snakes was significantly positively correlated with mean body size in each cell (for rodents: r = 0.679, P < 0.0002; for snakes: r = 0.888, P < 0.0001), and the slopes of the two regression lines did not differ significantly (ANCOVA: F1,51 = 3.486, P = 0.068).
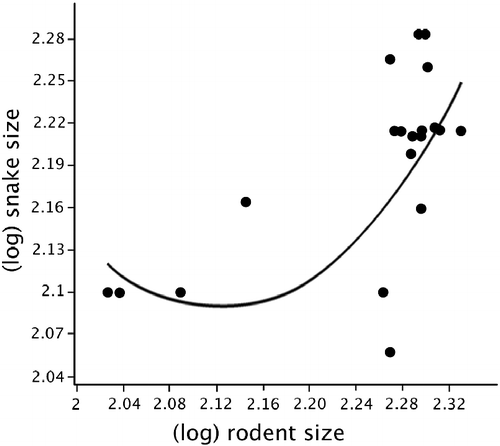
Among the various snake genera observed in West Africa (n = 58), 22 (37.9%) were primarily rodent eaters (data from Chippaux Citation2007). There was no significant relationship between mean snake body size per cell and mean rodent body size per cell (r = 0.067, P = 0.744). However, when we perform the same analysis restricted to only rodent-eating snakes (see Table for their body sizes), this relationship became statistically significant (r2 = 0.403, F = 7.772, P < 0.003; equation: y = 3.651x2–15.48 x+18.49; Figure ), thus showing that the body size of rodents and snakes are significantly associated to each cell, and that this association became stronger in those cells with the body size of rodents being comparably large. In this case, we used a nonlinear relationship because the AICc score relative to it was better compared with the linear model, which was also statistically significant.
Table 1 Body sizes (mean length) of rodent-eating West and Central African snakes (from Chippaux Citation2007).
Cell vegetation type significantly affected the mean snake body size per cell (F3,23 = 6.767, P = 0.002), and Tukey's honest significance post hoc test showed that snake body sizes in dry savannah cells were smaller than those from Guinea savannah (P = 0.003) and from the forests (P = 0.011). Similarly, vegetation type had a significant effect on rodent body size per cell (F3,23 = 38.40, P < 0.0001). Tukey's honest significance post hoc test revealed that forest mosaics and tropical lowland rainforest were nearly identical in terms of mean rodent body size per cell (P = 0.599), whereas dry savannah had rodents with significantly smaller body sizes than Guinea savannah, forest mosaics, and tropical lowland rainforest (in all cases, P < 0.0002).
Discussion
We found, not surprisingly, that both rodent and reptile species richness increases North to South, and from drier areas to forests, with this trend being paralleled at each cell. This pattern can be explained according to latitudinal laws (e.g., the latitudinal gradient theory; see Rapoport Citation1982; Gaston Citation2000; Citation2007). An alternative hypothesis, the niche diversification for predators (Ricklefs Citation1990), probably due to differential availability of resources, is more unlikely because of the deep history of the colonization of the African continent by snakes and rodents. Indeed, the major diversification of snake genera happened around 20–70 millions of years ago (e.g., Ricklefs et al. Citation2007), while rodents (at least murine rodents that constituted the majority of species considered in this paper) did not arrive in Africa until much more recently (7–12 millions of years ago; see Lecompte et al. Citation2008). Hence, our data in this regard fit perfectly with expectations from macro-ecology theory concerning latitudinal gradients.
Interestingly, we determined a by-cell direct correlation between body size of prey (i.e., rodents) and predators (i.e., rodent-eating snakes), whereas the same trend could not be found between rodent size and snake size in general, thus reinforcing the idea of a direct causal-effect reason for this correlational evidence. We stress that this pattern should be due to snakes being gape-limited foragers (e.g., Forsman Citation1996; Forsman and Shine Citation1997). Indeed, it has been demonstrated, for instance, that the giant rats (Cricetomys gambianus Waterhouse, 1840 and Cricetomys emini Whoughton, 1910), which are among the largest West African rodents, are the main prey for the largest African snake, i.e., the African rock python (Python sebae Gmelin, 1788) during the first years of life (Luiselli et al. Citation2001). Therefore, we predict that further data explorations in other continents will confirm the pattern given here. Our data also showed that vegetation type matters, rodent and snake size decreases with increase of aridity. In this regard, it should be stressed that animals (e.g., rodents of the genus Cryptomys) from the arid sites exhibited a reduced individual mass relative to those from the mesic areas, probably as an adaptation to reduce total colony energy expenditure given the elevated foraging costs in arid environments (Spinks et al. Citation2000). In addition, Knight (Citation1988) concluded that giant rats are physiologically adapted to burrowing habits, but only within cool environments, and are precluded from exploiting drier areas. Therefore, we consider that eco-physiological constraints reduce performance (and hence colonization success) of dry tropical regions by large-sized rodents, thus precluding also colonization by large-sized rodent-eating snakes as a consequence. Overall, we conclude that vegetation types influence the body size of both prey and predators, and that there was also a direct influence of prey size on predator size.
References
- AmoriG, GippolitiS, LuiselliL, BattistiC. 2009. Do interlinks between geogaphy and ecology explain diversity patterns in Sciuridae? An approach at the genus level. Canadian Journal of Zoology. 87(3):246–253.
- BroseU, JonssonT, BerlowEL, WarrenP, Banasek-RichterC, BersierLF, BlanchardJL, BreyT, CarpenterSR, Cattin BlandenierMF, et al. 2006. Consumer-resource body-size relationships in natural food webs. Ecology. 87:2411–2417.
- CharnovEL. 1976. Optimal foraging: the marginal value theorem. Theoretical Population Biology. 9:129–136.
- ChippauxJ-P. 2007. Les serpents d'Afrique occidentale et central. Paris: IRD Editions, 278 p.
- CohenJE, PimmSL, YodzisP, SaldanaJ. 1993. Body sizes of animal predators and animal prey in food webs. Journal of Animal Ecology. 62:67–78.
- ForsmanA. 1996. Body size and net energy gain in gape-limited predators: a model. Journal of Herpetology. 30:307–319.
- ForsmanA, ShineR. 1997. Rejection of non-adaptive hypotheses for intraspecific variation in trophic morphology in gape-limited predators. Biological Journal of the Linnean Society. 62:209–223.
- GastonKJ. 2000. Global patterns in biodiversity. Nature. 405:220–227.
- GastonKJ. 2007. Latitudinal gradient in species richness. Current Biology. 17:R574.
- GreenRF. 1984. Stopping rules for optimal foragers. American Naturalist. 123:30–40.
- GreenRF. 1990. Putting ecology back into optimal foraging theory. Comments on Theoretical Biology. 1:387–410.
- HarperD, BlakeRW. 1988. Energetics of piscivorous predator–prey interactions. Journal of Theoretical Biology. 134:59–76.
- IvlevVS. 1961. Experimental ecology of the feeding of fishes. New Haven, CT: Yale University Press, 302 p.
- IwasaY, HigashiM, YamamuraN. 1981. Prey distribution as a factor determining the choice of optimal foraging strategy. American Naturalist. 117:710–723.
- JuanesF. 1994. What determines prey size selectivity in piscivorous fishes? In: StouderDJ, FreshKL, FellerRJ, editors. Theory and application in fish feeding ecology. Columbia, SC: Carolina University Press; p. 79–100.
- KnightMH. 1988. Thermoregulation in the largest African cricetid, the giant rat Cricetomys gambianus. Comparative Biochemistry and Physiology. 89:705–708.
- LecompteE, AplinK, DenisC, KatzeflisF, ChadesM, ChevretP. 2008. Phylogeny and biogeography of African Murinae based on mitochondrial and nuclear gene sequences, with a new tribal classification of the subfamily. BMC Evolutionary Biology. 8:199, 10.1186/1471-2148-8-199.
- LuiselliL. 2006a. Broad geographic, taxonomic and ecological patterns of interpopulation variation in the dietary habits of snakes. Web Ecology. 6:2–16.
- LuiselliL. 2006b. Resource partitioning and interspecific competition in snakes: the search for general geographical and guild patterns. Oikos. 113:385–404.
- LuiselliL, AngeliciFM, AkaniGC. 2001. Food habits of Python sebae in suburban and natural habitats. African Journal of Ecology. 39:116–118.
- MacArthurRH. 1972. Geographical ecology: patterns in the distribution of species. New York: Harper and Row, 275 p.
- NowakRM. 1999. Walker's mammals of the world. Baltimore, MD: John Hopkins University Press, 1936 p.
- PerssonL. 1990. Predicting ontogenetic niche shifts in the field: what can be gained by foraging theory? In: HughesRN, editor. Behavioural mechanisms of food selection. Berlin: Springer-Verlag; p. 303–321.
- RapoportE. 1982. Aerography: geographical strategies of species. New York: Pergamon Press; p. 646.
- RicklefsRE. 1990. Ecology. III ed. New York: Freeman & Co. p. xii+896.
- RicklefsRE, LososJB, TownsendTM. 2007. Evolutionary diversification of clades of Squamate reptiles. Journal of Evolutionary Biology. 20:1751–1762.
- RosenzweigML. 1995. Species diversity in space and time. Cambridge: Cambridge University Press, 460 p.
- ScharfFS, JuanesF, RountreeRA. 2000. Predator size–prey size relationships of marine fish predators: interspecific variation and effects of ontogeny and body size on trophic-niche breadth. Marine Ecology Progress Series. 208:229–248.
- SchoenerTW. 1971. Theory of feeding strategies. Annual Review of Ecology and Systematics. 2:369–404.
- SpinksAC, BennettNC, JarvisJUM. 2000. A comparison of the ecology of two populations of the common mole-rat, Cryptomys hottentotus hottentotus: the effect of aridity on food, foraging and body mass. Oecologia. 125:341–349.
- StephensDW, KrebsJR. 1986. Foraging theory. Princeton, NJ: Princeton University Press, 247 pp.
- WernerEE, HallDJ. 1974. Optimal foraging and the size selection of prey by the bluegill sunfish (Lepomis macrochirus). Ecology. 55:1042–1052.
- WhiteA. 1983. Vegetation of Africa. Paris: UNESCO Press, 356 p.
- WilliamsP. 2001. World map software. London: Natural History Museum.
- WilsonDS. 1975. The adequacy of body size as a niche difference. The American. Naturalist. 109:769–784.
- WilsonEO. 1992. The diversity of life. New York: W.W. Norton & Company, 440 p.