
Abstract
Skin has a highly regulated pH environment of around pH 7.2 but with an acid barrier mantle of around pH 5.5. Trauma, inflammation, and infection are all thought to disrupt this pH environment but the lack of a non-invasive technique to measure pH within discrete locations within skin has hindered investigating what role pH plays in wound healing. In this study, a confocal Raman microspectroscopy method was used for measuring pH in a 3D tissue engineered model of human skin (TE-skin) and evaluated for its ability to detect changes in pH in response to wounding, inflammation and bacterial infection. The state of protonation of phosphate groups within the TE-skin was used to indicate pH in a non-destructive manner exploring depths of skin from the stratum corneum to 600 microns into the dermis. Deliberate wounding or inflammation (induced by IL-17) resulted in a loss of the acid mantle. Detailed scanning of TE-skin infected with Staphylococcus aureus or Pseudomonas aeruginosa revealed heterogeneous pH microenvironments ranging in size from 10 × 10 to 50 × 100 microns and ranging from pH 5 to 9. These microenvironments were not detected if an average pH for the TE-skin model was used.
Keywords:
Introduction
Skin has an upper protective acid barrier of pH 5.5, beneath this pH rises to around 7.0–8.0 (Citation1, Citation2). It is a challenge to investigate the role of pH in wound healing. Do infected or inflamed wounds have altered pH and does this affect wound healing?
Non-destructive pH measurement below the surface of skin is difficult, often requiring destructive tape stripping of the epithelium. For isolated cells, fluorescent ion sensitive dyes work well, but not in whole skin. We initially tried BCECF (2′,7′-Bis-(2-Carboxyethyl)-5-(and-6)-Carboxyfluorescein) but obtained no data in our TE-skin. We then used confocal Raman spectroscopy to measure pH non-invasively in models of wounded, inflamed, and bacterially infected human skin.
Raman spectroscopy is a powerful technique capable of investigating the internal structure of molecules and crystals. Based on inelastic scattering of photons after interaction with a chemical, a fraction of the light from an illuminated tissue undergoes a frequency shift due to interaction with molecular vibrations—Raman scattering. The degree of this shift dependant on the nature of the chemical group. This technique is used to study chemical structural properties of biological molecules (Citation3, Citation4). Spectra show subtle differences in biochemistry without the need for specific labeling, and principal component analysis (PCA) can determine their significance or reliability. Thus, Raman spectroscopy is increasingly popular as a label free non-invasive tool to characterize multiple components within biological samples both in vitro and in vivo (Citation5). We have discriminated between types of breast and oral cancer cells, and between normal tissue and melanoma and peri-tumor areas (Citation3, Citation6, Citation7).
In this study, we used the protonation of phosphate groups to indicate pH. Phosphate is ubiquitous throughout the epithelium, as phosphoric acid and phospholipids. Phosphate group redox state changes with pH, protonation changes the intensity of two specific Raman peaks, their ratio gives data suitable to calculate pH.
We investigated localized pH changes in TE-skin, from the stratum corneum to a depth of 600 microns into the dermis.
Wounding and inflammation disrupted the normal pH gradient. Bacteria affected skin pH in a heterogeneous manner with local pH ranging from pH 5 to 9 in discrete areas.
Results
Production of tissue-engineered skin models of wounding, inflammation, and infection
illustrates TE-skin model production, and their modification to produce a central 1 cm diameter area epithelial wound to study wounding, inflammation, and bacterial infection.
Figure 1. Creation of tissue-engineered skin models (A). Modification of method to create TE-skin wound models by seeding keratinocytes and fibroblasts between concentric steel rings (B).
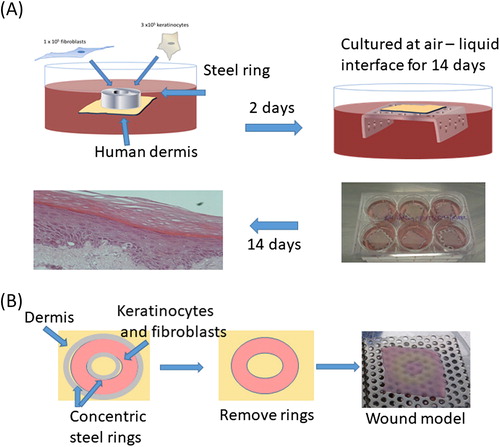
shows maturation of TE-skin model over 14 d culture at an air liquid interface. In this model images i, ii, and iii show wounding with an incisional scalpel cut through to the dermis. Histology and immunohistochemistry of these models is shown beneath, images iv, v, and vi i, ii, and iii showing epithelial maturation and stratum corneum development. Pancytokeratin staining identifies keratinocytes (green) and DAPI staining of nuclei (blue) identifies nucleate keratinocytes capable of proliferation. There is a clear wound visible at day 1 which is healing well by day 7, and completely healed by day 14.
Figure 2. A. Incisional cut wounds in tissue-engineered skin models at 1, 7, and 14 d post-wounding (i, ii, and iii). H&E sections (iv, v, and vi) and Pancytokeratin immunostaining (seen as green) with DAPI nuclear staining (seen as blue) (vi, vii, and viii) of those wounds at days 1, 7, and 14. B. Gram-stained histology sections of the mature tissue-engineered skin which is either uninfected (i) or infected with P. aeruginosa (ii) or S. aureus (iii) for 24 h (×100 magnification). Insets show higher magnification (×400).
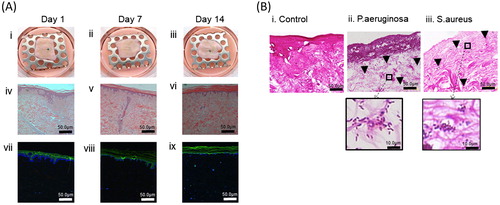
shows Gram stain of the mature TE-skin, which is either uninfected (Bi) or infected with Pseudomonas aeruginosa (Bii) or Staphylococcus aureus (Biii) for 24 h. Higher power images show the punctate nature and distribution of bacteria. By 24 h, P. aeruginosa formed a thick layer on the epidermal surface with penetration of bacteria deep into the dermis (Citation8). Staphylococcus aureus showed a more modest penetration into the dermis within 24 h.
Use of phosphate groups to deduce skin pH
Raman confocal imaging system allows depth profiling, obtaining information from the upper surface into the interior of a sample in a non-destructive and non-contact method. Examination of the Raman spectra gives information about the chemical compounds present and information on their state.
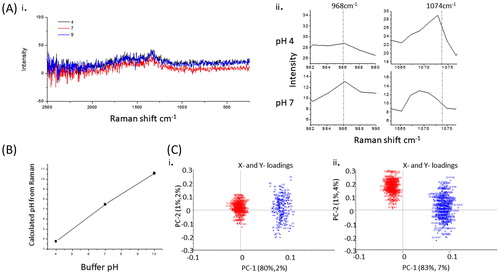
In this study, we selected a chemical species that is sensitive to pH, we then first tested method by calculating pH from spectra taken from saline solutions at different pH. PO32− and POCitation2 give a peaks at 968 and 1074 cm−1, respectively. As pH changes from pH 5.0 to 9, there is a reciprocal change in the intensity of these peaks as phosphates deprotonate. A ratio of the peak intensities can be used to calculate pH. pH = pKa + log10 (base/acid) or pH = pKa + log 10 (Intensity968/Intensity1074).
Examples of spectra are shown in for pH 4, 7, and 9, and the pH-induced changes in pH obtained from these spectra in . The 968 and 1074 cm−1 peaks were used to calculate pH, and shown in .
Figure 3. Raman traces showing peaks at 968 and 1074 for pH 4 and 7, respectively (A). Graph of pH data calculated from Raman data (100 spectra) for saline buffered at pH 4, 7, and 10 (B). Principle component analysis plots of derived from spectra in the range 950–1080 cm−1 comparing pH4 (red) and pH7 (blue) (A), and comparing pH 9 (red) and pH 7 (blue) (C).
pH measurement in TE-skin models
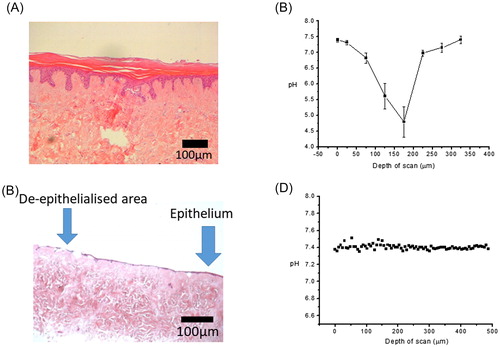
shows an untreated skin model after 7 d of culture showing normal epithelial morphology, a convoluted rete ridge formation at the dermal:epidermal junction, round nucleated cells at the stratum basale, above this are the stratum spinosum, granulosum, and corneum. While there is some detachment of the upper corneum (basket weave), the epidermis is otherwise intact and well adhered to the dermis containing a modest number of dermal fibroblasts. In control regions of epithelium of the TE-skin (), the uppermost surface of the TE-skin is calculated to be 7.4, but this then changes to an acidic pH 4.75 by 150–200 µm beneath the surface of the TE-skin, and then at greater depths (>200 µm) the pH then sharply returns to pH 7.4–7.5.
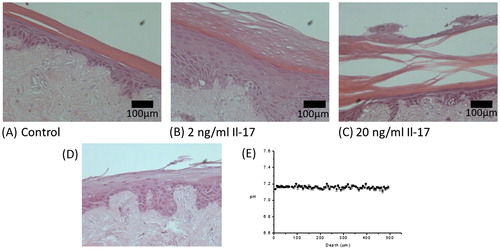
Figure 4. H&E histology and corresponding pH data calculated from Raman data of control (A & B), and wound model TE-skin (C & D). Samples stained with H&E are ×100 magnification, scale bar represents 100 µm, n = 3.
pH measurement in wounded TE-skin model
In the wound model lacking an epithelium (), the acidification seen in the control epithelium was absent (), pH was a uniform 7.4 regardless of the depth of scan. H&E histology verified the lack of an epithelium. This demonstrated simply the intact epithelium is responsible for the pH gradient in this TE-skin model.
pH measurement in inflamed TE-skin model
Treatment of TE-skin with 2 ng/ml Il-17 for 7 d induced increases in the thickness of the spinosum and granulosum, with the appearance of nucleate cells in the thickened corneum which was partly detached from the granulosum (5B). An increase to 20 ng/ml Il-17 gave a thickened epithelium very fragile corneum—often completely detached ().pH was in the range of pH 7.1–7.3 regardless of depth, histology of the models showed this coincided with the lack of an intact corneum.
Figure 5. H&E histology of TE-skin treated for 7 d with Il-17, Control (A), 2 ng/ml (B), and 20 ng/ml (C). H&E histology of TE-skin treated with Il-17 (D), and pH measurements calculated from Raman data (E). Samples are stained with H&E are ×100 magnification, scale bar represents 100 µm, n = 3.
pH measurement in infected TE-skin
Infected TE-skin was subjected to improved extraction of data from the Omnic data collection software, the enlarged data set allowed the creation heat maps of pH vs. skin depth. Following interrogation by Raman confocal, the samples were subjected to conventional H&E staining as shown in .
Figure 6. Measurement of pH in bacterially infected skin. H&E sections (A, C, & E) and pH plots (B, E, & F) of sections through control TE-skin (A&B), S. aureus infected (C&D), and P. aeruginosa infected (E & F) TE-skin. ×100 magnification, scale bar represents 200 µm, n = 3.
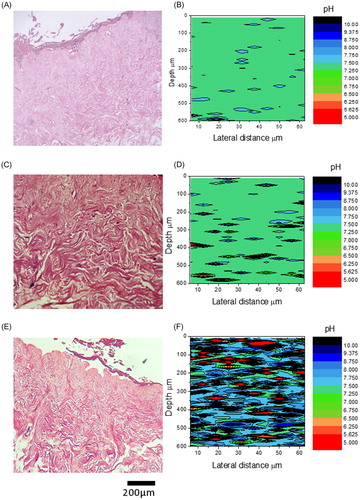
Uninfected wounds were a uniform pH 7.4 (). Infection with Staphylococcus aureus gave a punctate pattern of small isolated colonies of bacteria within the dermis compared to control H&E (), this corresponded to regions of pH 4 to 9–10 in very small patches of around 10 × 10 to 50 × 100 microns diameter (). Pseudomonas aeruginosa infection resulted in a florid infection occupying the entire dermis (), and dramatic deviations of pH in discrete patches within the dermis. The range of pH deviations was similar to S. aureus however the pockets of deviation were more widespread, similar to the pattern of bacterial occupation of the dermis. In fact very little of the dermis appeared to be at physiological pH ().
PCA was performed over the spectral range used in this study (950–1080 cm−1) comparing spectra from regions of pH 4 and pH 9 with regions of pH 7 in the P. aeruginosa-infected models. shows that there was favorable separation between pH 4 and pH 7 ()) between pH 9 and pH 7 ().
Discussion
Our primary motivation for undertaking this study was to assess the impact of bacterial infection on wound pH as there are a few studies suggesting that bacteria induce an acidic environment in skin (Citation9), but when we sought to confirm this using bacterial infection of a human skin model we found that it was experimentally very difficult to measure pH within skin in any meaningful manner.pH electrodes (immersion and surface) while easy-to-use are only appropriate for using in liquids in which they can be immersed or placed in direct contact. Both require disruption and homogenization of tissue to obtain pH measurements beneath the surface of the skin. These would not reflect any variation in pH throughout the tissue. It is possible to obtain meaningful intracellular pH measurements in monolayers of cells and extracellular pH measurements over a wide pH range of 4 to 8 with fluorescent indicators such as pHrodo (Citation10). However, we were unable to obtain any meaningful data with this fluorescent dye within our skin model due to the attenuation of light passing through the tissue, and dermal autofluorescence as well as significant concentration variation of indicator in the epidermis. We followed a methodology for measuring pH within tissues based on Raman spectroscopy (Citation11, Citation12) which was used to measure pH within postmortem porcine tissue (Citation11, Citation12). Using this methodology, we were able to measure pH both longitudinally and laterally within skin in a non-destructive manner.
We obtained Raman spectra of phosphate groups throughout the tissue collecting the intensities of peaks at 968 and 1080cm−1 at different depths within the tissue, pH was calculated using the Henderson-Hasselbalch equation. We confirmed the performance of this technique using pH buffered solutions to demonstrate that it is possible to read between pH 5 and 8 by collecting peak intensities at 968 and 1080 cm−1.
The tissue-engineered skin model used in this study has been developed and studied extensively in our laboratory both experimental and clinical use (Citation13). Decellularised human donor epidermis (DED) retaining basement membrane antigens is reconstructed with keratinocytes and fibroblasts obtained from skin or, as required from oral mucosa. These TE-skin models develop a mature barrier layer equivalent to split thickness skin if cultured at a liquid interface—confirmed by comparing the electrical resistance and transepithelial potential across TE-skin versus freshly excised split thickness skin (Citation14). shows the maturation of the epidermal barrier with time. This becomes impenetrable to bacterial penetration unless we physically wound it either by using an incisional cut as illustrated in (8) or by creating a model lacking epidermis into which bacteria can be placed.
Common commercial skin models (EpiSkin, SkinEthic, and Epiderm) do not have a well-developed barrier layer (Citation15), and have altered barrier ceramide content compared to human skin (Citation16). This is probably due to the lack of a dermal component, showing the need for epithelial/mesenchymal communication in epithelial development (Citation13) and to maintaining good epidermal attachment to the dermis. Our confidence in the physiological relevance of our TE-skin is based on its successful use in contracture release in burns patients (Citation17) and in substitution urethroplasty (Citation18), where 9 years of clinical follow-up shows good graft survival (Citation19).
Raman spectroscopy allows rapid label free non-invasive analysis both in vitro and in vivo (Citation5). It has been used on breast cancer cell lines where it can accurately distinguish between cancer cell lines of varying metastatic potency (Citation6). In tissue-engineered oral mucosa it discriminated between normal, dysplastic, and oral cancer, showing altered lipid, amino acid and nucleic acid composition (Citation7). It has also identified a peri-tumor area in a tissue-engineered melanoma skin model, characterized by increased glycogen, providing new information on the interaction between the tumor and adjacent normal tissue (Citation3).
In this study, we were able to demonstrate that the acidification of the upper epidermal layers (acid mantle) reaches much deeper into the epidermis than reported in vivo measurements from tape stripping/application and the use of a flat pH electrode (Citation1). We also found that damaging the integrity of TE-skin either by creating an epithelial wound or treating it with Il-17 (20 ng/ml, for 7 d) led to the loss of the acid pH environment seen in normal TE-skin.
The upper surface was pH 7, similar to ex vivo and frozen skin (Citation1). When the epidermis was missing, pH was unchanged from the saline hydrating the model, similar to the pH in in vivo wounds where the wound center is pH 7.4, while the wound edges have a more acidic pH where re-epithelialisation is occurring (Citation20). Where we induced inflammation, the acid pH of the corneum was lost. Il-17 was used to induce inflammation, as its release by T-helper cells promotes Il-6 and Il-8 by keratinocytes—leading to abnormal epithelial morphology and function (Citation21). This Il-17 treated model of TE-skin resembles psoriasis where basal cell hyperproliferation causes deranged epithelial morphology (Citation22).
The effects of bacterial infection on the TE-skin model were unexpected, Gram-negative bacteria being the most startling due to the range and density pH microenvironments seen. Pockets of altered pH ranging in size from 10 × 10 to 50 × 100 microns. Pseudomonas aeruginosa has been shown to be more dermally invasive than S. aureus (Citation8) perhaps due to Pseudomonas alkaline protease (Citation23). Alkaline proteases function optimally between pH 8 and 11, hydrolyzing peptide bonds. It is not clear if the pH change is due to the protease itself, however the alkalinity would enhance Ca2+-dependant biofilm creation (Citation24).
Biofilms reduce permeation of antibiotics through extracellular matrix, and bacteria deeper within the biofilm are less metabolically active, which reduce the efficacy of antibiotics (Citation25). Wound pH may also effect on anti-microbial dressings, decreased pH has been shown to improve efficacy of silver alginate dressings (Citation26).
We also observed pockets of acidic pH within both P. aeruginosa- and S. aureus-infected tissue. Chronic wounds have an alkaline pH (Citation27, Citation28), as healing progresses, pH becomes neutral than acidic (Citation28, Citation29). Biofilm pH has previously been shown to be heterogeneous (Citation30) and to vary from intracellular pH (Citation31). It is plausible we are seeing biofilm-related heterogeneous pH microenvironments. Interestingly, when we average the pH values at each depth from the infected models (data not shown) the net pH is unchanged from control—though with an increased variance, indicating the ease with which these small changes in pH could be overlooked.
This is the first study to show pH heterogeneity in bacterially infected skin, and clearly merits further investigation. A key question we must ask is what is the role of these differing pH environments for treating bacterial infections?
Methods
Production of tissue-engineered skin
Tissue-engineered skin was prepared using a modification of the method described by Chakrabarty (Citation32). Skin was obtained anonymously for medical research with written consent from individuals undergoing elective surgery for breast reduction or abdominoplasty under Human Tisse Authority Research Tissue Bank Licence 12179. All reagents were purchased from Sigma-Aldrich, Dorset, UK unless otherwise stated.
Fibroblasts were isolated from digestion of minced dermis by 0.05% collagenase A in DMEM overnight at 37 °C with 5%CO2. The cell suspension was centrifuged at 400g and the pellet resuspended in medium (DMEM supplemented with 10% fetal calf serum (FCS), 0.25 mg.mL−1 glutamine, 0.625 μg.mL−1 amphotericin B, 100 I.U.mL−1 penicillin, and 100 μg.mL−1 streptomycin). Cells were cultured in fibroblast medium in T25 flasks and incubated at 37 °C with 5%CO2. Medium was changed every 2 d, and cells were passaged as needed. Fibroblasts between passage 4 and 9 were used in experiments.
Keratinocytes were extracted from split thickness skin cut into 0.25 cm2 squares and incubated in 10 ml of 1 mg.mL−1 Difco trypsin (Fisher Scientific, Leicestershire, UK) in PBS overnight at 4 °C. Trypsin was neutralized by addition of 5-mL FCS followed by the separation of epidermis from the dermis. The basement membrane region was gently scraped into 10% Green’s medium to retrieve keratinocytes. The cell suspension was then centrifuged at 180g for 5 min. The pellet was resuspended in Green’s medium and transferred to a T75 flask that was previously seeded with 5 × 10⁶ i3T3 to act as a feeder layer. 3T3 fibroblasts were growth arrested by 60Gy of gamma irradiation to create i3T3 cells. Cells were incubated at 37 °C, in a 5%CO2 in a humidified atmosphere. Medium was changed every 2–3 days, keratinocytes were passaged at 70–80% confluency, and passage 1–2 keratinocytes were used for experiments.
Normal human keratinocytes and dermal fibroblasts were seeded into 1 cm diameter seeding rings placed on the papillary surface of 2 cm × 2 cm de-epidermised dermis (DED) prepared from split thickness human skin. Constructs were cultured for 2 d submerged, then for 14 d at an air-liquid interface. Cultures were fed every 2–3 d with 10% Green’s medium (Citation33) as shown in .
Inflamed skin models
Circular patches of epithelium (1 cm in diameter) were grown using the method above. After 3 d at air liquid interface—before the epithelia was deemed mature, Il-17 at 0 to 20 ng/ml was added to the culture media. After a further 7d of culture, samples were fixed in 10% formalin overnight at 4 °C then paraffin embedded.Sections (6 µm thick) were taken and dewaxed in xylene (Fisher Scientific, UK) for 3 min. Samples were then rehydrated in 100%, 90%, 70%, 50% IMS (Fisher Scientific) then dH20 (1 min each) then stained with Harris hematoxylin for 90 s followed by rinsing in tap water for 4 min. Samples were then stained in eosin for 5 min before being dehydrated through 70, 90, and 100% IMS then xylene (1 min each) then mounted using DPX mountant (Fisher Scientific). Models were then created as above, using 20 ng/ml Il-17 which created an inflamed epithelial morphology and examined by confocal Raman spectroscopy.
Histology and immunohistochemistry of tissue-engineered skin models
For histological and immunohistochemical analysis, skin constructs were bisected and fixed 10% formalin, then paraffin embedded and 6 μm sections cut.
For immunohistochemical analysis, sections were fluorescently stained for keratinocytes using mouse monoclonal anti-pancytokeratin PCK-26 (Abcam, Cambridge,UK). High temperature antigen retrieval was performed on dewaxed sections in sodium citrate buffer, pH 6.0, then incubated with primary antibodies at 1:100 in PBS overnight at 4 °C. Secondary antibody (FITC-labelled polyclonal sheep anti-mouse IgG (Abcam)) at 1:200 was incubated for 30 min at room temperature. Following washing with PBS, sections were mounted using a DAPI-containing mountant (Vectashield, Vector Laboratories, Peterborough, UK). Images were captured and processed on a Zeiss Axiovert 200M inverted fluorescence microscope.
Gram staining was performed to visualize bacteria. Sections were dewaxed and rehydrated through xylene and alcohol to water as above. Wet slides were flooded with crystal violet for 1 min, fixed in Gram’s iodine (1 min), destained in iodine–acetone (30 s), and then counterstained with carbol fuschin (1 min).
Bacteria
Bacteria were clinical isolates of Gram-negative P. aeruginosa (SOM-1) and Gram-positive S. aureus (S235) (Citation8), which commonly infect wounds. Bacteria were maintained on brain heart infusion (BHI) agar. For skin infection experiments, they were cultured overnight in BHI broth. Bacterial numbers were measured in a standard bacterial counting chamber and diluted in PBS.
Bacterially infected wound models
Infected wound models were produced by two methods—by making an incisional cut in the epidermis as previously described (Citation8) or by adaptating our previously published method (Citation32). Epithelial wounds (1 cm diameter) extending to the dermis were created by seeding 4.5 × 10⁶ keratinocytes and 1.5 × 10⁶ fibroblasts between concentric steel rings (4.5 cm and 1 cm diameter, respectively; ). After 48 h of culture in Green’s media, rings were removed and the models were cultured for a further 14 d on support grids which raised the upper surface out of the growth media (air/liquid interface).
Prior to inoculation, wound models were placed in antibiotic free Green’s media for 24 h. Bacteria were placed on the bare center of each wound model—the region that was lacking a mature epithelium using suspensions of P. aeruginosa (SOM-1) or S. aureus (S235) at a density of 107 in 20 µl of PBS. Infected models were cultured for 48 h at 37 °C in 5%CO2. Samples were gently dabbed dry and placed on a pad of gauze soaked in phosphate buffered saline on glass microscope slide and Raman spectra were then obtained from the central infected region of each model. Each model was then fixed in 10% formalin and wax embedded for processing to histological sections and hematoxylin and eosin (H&E) staining as above.
Raman spectroscopy measurement of phosphate as pH indicator
Protonation of phosphate groups is influenced by pH. Vibration of PO32− gives a peak at 968 cm−1 while the acidic PO2− gives a peak at 1074 cm−1. As pH changes from 5 to 9, there is a reciprocal change in peak intensity, and these data can be used in the Henderson-Hasselbalch equation—pH = pKa + log10 (base/acid) or pH = pKa + log10 (Intensity968/Intensity1074) (Citation11). pH was recorded in buffered saline solutions at pH 4, 7, and 10. For pH 4, 10 mM ammonium formate was used as pH buffer; for pH 7, 10mM HEPES, and for pH 10, 10mM CAPS (3-(Cyclohexylamino)-1-propanesulfonic acid) was used.
Acquiring Raman spectra in tissue-engineered skin
All samples were analyzed using a DXRxi Raman imaging microscope system (Thermo Scientific, USA). For all TE-skin models in PBS at pH 7.35, Raman data were collected every 15 µm for 150 µm on the epithelium (Y axis), then repeated every 50 µm down into the model to 600 µm into the dermis (Z axis). To reduce autofluorescence, a near-infrared 780 nm 24 mW laser was used with a 0.01 s exposure, a 50× long work distance objective (0.5 N.A. Olympus, Tokyo, Japan) was used with an aperture of 50-µm slit. Spectral data obtained showed peaks at Raman shifts of 1074 cm−1 and 968 cm−1 approx. (Citation11, Citation12). To calculate pH, data of 10 scans per point were collected and averaged. Average pH at each depth in the z plane was calculated. To prevent dehydration during analysis, samples supported by a pad of PBS soaked gauze.
In experiments involving infection, an improved method of extracting bulk spectral data using the OMNICxi software (Thermo Scientific, Massachusetts, USA), allowing pH mapping to indicate local pH in more detail manner.
Acknowledgements
We gratefully acknowledge the Horizon 2020 European grant MOZART for financial support.
Disclosure statement
No potential conflict of interests was reported by the authors.
Additional information
Funding
References
- Wagner, H., Kostka, K. H., Lehr, C. M., and Schaefer, U. F. (2003) pH profiles in human skin: influence of two in vitro test systems for drug delivery testing. Eur. J. Pharmaceut. Biopharmaceut.: Official journal of Arbeitsgemeinschaft fur Pharmazeutische Verfahrenstechnik e.V 55:57–65.
- Denda, M., Hosoi, J., and Asida, Y. (2000) Visual imaging of ion distribution in human epidermis. Biochem. Biophys. Res. Commun. 272 (1):134–137.
- Yorucu, C., Lau, K., Mittar, S., Green, N. H., Raza, A., Rehman, I. U., and MacNeil, S. (2016) Raman spectroscopy detects melanoma and the tissue surrounding melanoma using tissue-engineered melanoma models. Appl. Spectrosc. Rev. 51 (4):243–257.
- Slatopolsky, E., Finch, J., Denda, M., Ritter, C., Zhong, M., Dusso, A., MacDonald, P. N., and Brown, A. J. (1996) Phosphorus restriction prevents parathyroid gland growth. High phosphorus directly stimulates PTH secretion in vitro. J. Clin. Invest. 97 (11):2534–2540.
- Brauchle, E., and Schenke-Layland, K. (2013) Raman spectroscopy in biomedicine – non-invasive in vitro analysis of cells and extracellular matrix components in tissues. Biotechnol. J. 8 (3):288–297.
- Rehman, S., Movasaghi, Z., Tucker, A. T., Joel, S. P., Darr, J., Ruban, A., and Rehman, I. (2007) Raman spectroscopic analysis of breast cancer tissues: Identifying differences between normal, invasive ductal carcinoma and ductal carcinoma in situ of the breast tissue. Journal of Raman Spectroscopy 38 (10): 1345–1351.
- Mian, S. A., Yorucu, C., Ullah, M. S., Rehman, I. U., and Colley, H. E. (2017) Raman spectroscopy can discriminate between normal, dysplastic and cancerous oral mucosa: a tissue-engineering approach. J. Tissue Eng. Regenerat. Med. 11 (11):3253–3262.
- Shepherd, J., Douglas, I., Rimmer, S., Swanson, L., and MacNeil, S. (2009) Development of three-dimensional tissue-engineered models of bacterial infected human skin wounds. Tissue Eng. C Method. 15 (3):475–484.
- Diegelmann, R. F., and Evans, M. C. (2004) Front Biosci. 298:413; Schneider, L. A., Korber, A., Grabbe, S., and Dissemond, J. (2007) Wound healing: an overview of acute, fibrotic and delayed healing. Arch. Dermatol. Res. 9: 283–289.
- Stijlemans, B., Cnops, J., Naniima, P., Vaast, A., Bockstal, V., De Baetselier, P., and Magez, S. (2015) Development of a pHrodo-based assay for the assessment of in vitro and in vivo erythrophagocytosis during experimental trypanosomosis. PLoS Neglect. Trop. Dis. 9 (3):e0003561.
- Scheier, R., and Schmidt, H. (2013) Measurement of the pH value in pork meat early postmortem by Raman spectroscopy. Appl. Phys. B. 111:8.
- Scheier, R., Scheeder, M., and Schmidt, H. (2015) Prediction of pork quality at the slaughter line using a portable Raman device. Meat Sci. 103:96–103.
- MacNeil, S. (2007) Progress and opportunities for tissue-engineered skin. Nature 445 (7130):874–880.
- Bullock, A. J., Barker, A. T., Coulton, L., and MacNeil, S. (2007) The effect of induced biphasic pulsed currents on re-epithelialization of a novel wound healing model. Bioelectromagnetics 28 (1):31–41.
- Netzlaff, F., Lehr, C. M., Wertz, P. W., and Schaefer, U. F. (2005) The human epidermis models EpiSkin, SkinEthic and EpiDerm: an evaluation of morphology and their suitability for testing phototoxicity, irritancy, corrosivity, and substance transport. Eur J Pharmaceut Biopharmaceut.: Official journal of Arbeitsgemeinschaft fur Pharmazeutische Verfahrenstechnik e.V 60 (2):167–178.
- Tfayli, A., Bonnier, F., Farhane, Z., Libong, D., Byrne, H. J., and Baillet-Guffroy, A. (2014) Comparison of structure and organization of cutaneous lipids in a reconstructed skin model and human skin: spectroscopic imaging and chromatographic profiling. Exp. Dermatol. 23 (6):441–443.
- Sahota, P. S., Burn, J. L., Brown, N. J., and MacNeil, S. (2004) Approaches to improve angiogenesis in tissue-engineered skin. Wound Repair Regen. 12 (6):635–642.
- Bhargava, S., Bullock, A. J., Chapple, C. R., and MacNeil, S. (2003) Tissue-engineered oral mucosa for substitution urethroplasty. Br. J. Urol. 91 (2):22.
- Bhargava, S., Chapple, C. R., Bullock, A. J., Layton, C., and MacNeil, S. (2004) Tissue-engineered buccal mucosa for substitution urethroplasty. BJU. Int. 93 (6):807–811; Osman, N. I., Patterson, J. M., MacNeil, S., and Chapple, C. R. (2014) Eur. Urol. 66 (4):790.
- Schreml, S., Meier, R. J., Kirschbaum, M., Kong, S. C., Gehmert, S., Felthaus, O., Kuchler, S., Sharpe, J. R., Woltje, K., Weiss, K. T., Albert, M., Seidl, U., Schroder, J., Morsczeck, C., Prantl, L., Duschl, C., Pedersen, S. F., Gosau, M., Berneburg, M., Wolfbeis, O. S., Landthaler, M., and Babilas, P. (2014) Luminescent dual sensors reveal extracellular pH-gradients and hypoxia on chronic wounds that disrupt epidermal repair. Theranostics. 4 (7):721–735.
- Arican, O., Aral, M., Sasmaz, S., and Ciragil, P. (2005) Serum levels of TNF-alpha, IFN-gamma, IL-6, IL-8, IL-12, IL-17, and IL-18 in patients with active psoriasis and correlation with disease severity. Med. Inflamm. 2005 (5):273–279; Tan, Q., Yang, H., Liu, E. M., and Wang, H. (2017) J. Cutan. Med. Surg. 21 (4):308.
- Harrison, C. A., Layton, C. M., Hau, Z., Bullock, A. J., Johnson, T. S., and MacNeil, S. (2007) Transglutaminase inhibitors induce hyperproliferation and parakeratosis in tissue-engineered skin. Br. J. Dermatol. 156 (2):247–257.
- Morihara, K. (1963) Biochimica et Biophysica Acta. 73: 9; Heck, L. W., Morihara, K., and Abrahamson, D. R. (1986) Pseudomonas aeruginosa proteinase 1: Purification and general properties. Infect. Immun. 54 (1):149.
- Baumann, U., Wu, S., Flaherty, K. M., and McKay, D. B. (1993) Three-dimensional structure of the alkaline protease of Pseudomonas aeruginosa: a two-domain protein with a calcium binding parallel beta roll motif. EMBO J. 12 (9):3357–3364; Korstgens, V., Flemming, H. C., Wingender, J., and Borchard, W. (2001) Water Sci. Technol. 43 (6):49.
- Hoiby, N., Bjarnsholt, T., Givskov, M., Molin, S., and Ciofu, O. (2010) Antibiotic resistance of bacterial biofilms. Int. J. Antimicrob. Agents 35 (4):322–332.
- Slone, W., Linton, S., Okel, T., Corum, L., Thomas, J. G., and Percival, S. L. (2010) The Effect of pH on the Antimicrobial Efficiency of Silver Alginate on Chronic Wound Isolates. J. Am. Coll. Cert. Wound Special. 2 (4):86–90.
- Wilson, I. A., Henry, M., Quill, R. D., and Byrne, P. J. (1979) The pH of varicose ulcer surfaces and its relationship to healing. Vasa. 8 (4):339–342.
- Tsukada, K., Tokunaga, K., Iwama, T., and Mishima, Y. (1992) The pH changes of pressure ulcers related to the healing process of wounds. Wounds. 4 (1):4.
- Gethin, G. (2007) The significance of surface pH in chronic wounds. Wounds UK. 3 (3):4.
- Vroom, J. M., De Grauw, K. J., Gerritsen, H. C., Bradshaw, D. J., Marsh, P. D., Watson, G. K., Birmingham, J. J., and Allison, C. (1999) Depth penetration and detection of pH gradients in biofilms by two-photon excitation microscopy. Appl Environ. Microbiol. 65 (8):3502–3511; Hidalgo, G., Burns, A., Herz, E., Hay, A. G., Houston, P. L., Wiesner, U., and Lion, L. W. (2009) Appl Environ. Microbiol. 75 (23):7426.
- Schlafer, S., Garcia, J. E., Greve, M., Raarup, M. K., Nyvad, B., and Dige, I. (2015) Ratiometric imaging of extracellular pH in bacterial biofilms with C-SNARF-4. Appl Environ. Microbiol. 81 (4):1267–1273.
- Chakrabarty, K. H., Dawson, R. A., Harris, P., Layton, C., Babu, M., Gould, L., Phillips, J., Leigh, I., Green, C., Freedlander, E., and MacNeil, S. (1999) Development of autologous human dermal-epidermal composites based on sterilized human allodermis for clinical use. Br. J. Dermatol. 141 (5):811–823.
- Rheinwald, J. G., and Green, H. (1975) Serial cultivation of strains of human epidermal keratinocytes: the formation of keratinizing colonies from single cells. Cell. 6 (3):331–343.