
Abstract
Analytical technologies that can improve disease diagnosis are highly sought after. Current screening/diagnostic tests for several diseases are limited by their moderate diagnostic performance, invasiveness, costly and laborious methodologies or the need for multiple tests before a definitive diagnosis. Spectroscopic techniques, including infrared (IR) and Raman, have attracted great interest in the medical field, with applications expanding from early disease detection to monitoring and real-time diagnosis. This review highlights applications of IR and Raman spectroscopy, with a focus on cancer and infectious diseases since 2015, and underscores the diverse sample types that can be analyzed, such as biofluids, cells and tissues. Studies involving more than 25 participants per group (disease and control group; if no control group >25 in disease group) were considered eligible, to retain the clinical focus of the paper. Following literature searches, we identified 94 spectroscopic studies on different cancers and 30 studies on infectious diseases. The review suggests that such technologies have the potential to develop into an objective, inexpensive, point-of-care test or facilitate disease diagnosis and monitoring. Up-to-date considerations for the implementation of spectroscopic techniques into a clinical setting, health economics and successful applications of vibrational spectroscopic tests in the clinical arena are also discussed.
Introduction
Amidst the search for novel, cost-effective and rapid medical diagnostic tests, vibrational spectroscopy techniques have attracted increased interest in recent years. Current clinical tests, such as cytological evaluation, immunohistochemistry and imaging techniques have proven extremely efficacious in disease diagnostics. However, they necessitate costly, time-consuming methodologies while they may also lack automation, require user-dependent interpretation or involve a series of tests, some still providing mediocre diagnostic accuracy. In order to address these needs, Infrared (IR) and Raman spectroscopy have been suggested as an alternative means of detecting and diagnosing a broad range of diseases. By providing simultaneous information on multiple biological molecules, such technologies generate a holistic biochemical “fingerprint”, thus indicating the presence or absence of disease, and even the stage of disease progression.
Vibrational spectroscopy techniques employ the interaction of light with matter upon exposure to electromagnetic radiation of specific energy to study molecular vibrations. The vibrational characteristics of the chemical bonds of a molecule are characteristic of that molecule and the spectroscopic signature of transitions between discrete vibrational levels induced by incident light can therefore reveal information on specific molecules present in the sample. IR absorption and Raman, the two main vibrational spectroscopic techniques, have distinct physical origins, being light absorption and inelastic light scattering, respectively (). IR and Raman spectroscopy provide complementary information, due to different selection rules; vibrations are IR active when there is a change in the permanent dipole moment over the course of the vibration, whereas a change in the molecular polarizability is needed for a vibration to be Raman-active. The different experimental variants of IR and Raman, each with distinct benefits and limitations, are provided in [Citation1–6]. Vibrational spectroscopy has been successfully employed as an analytical tool for a number of applications in fields such as pharmacology[Citation7], archaeology[Citation8], forensic[Citation9], food[Citation10] and environmental science[Citation11], homeland security[Citation12] and biomedicine[Citation13].
Figure 1. Principle of vibrational spectroscopic techniques and characteristic biological spectra serving as “fingerprints”. When an incident photon interacts with a molecule, it may be absorbed, during infrared (IR) absorption, or scattered. Vibrational energies are quantized and lie in the mid-IR region of the electromagnetic spectrum. Absorption of light is well defined, resonant frequencies give rise to a spectrum which is characteristic of the vibrations of a material. When light scattering occurs, the energy of incident and scattered photons can either remain the same (elastic or Rayleigh scattering) or differ (inelastic or Raman scattering). Depending on whether energy is lost or gained by the incident photon, Stokes or anti-Stokes scattering are observed, respectively. The spectrum of observed energy differences (Raman shifts) provides a similar fingerprint of the chemical composition of a sample.
(A) Energy diagram illustrating the electronic transitions of a molecule during Raman anti-Stokes and Stokes scattering, Rayleigh scattering and infrared absorption. Where hυ0 = incident energy; hυvib = vibrational energy; hυR = Rayleigh energy; Δυ = Raman shift; υvib = vibrational frequency.
Characteristic spectra generated by analysis of biological samples using (B) IR and (C) Raman spectroscopy. Different spectral regions providing structural information for different biomolecules including proteins, lipids, nucleic acids and carbohydrates are highlighted. The IR spectrum was generated by analysis of human blood serum using Attenuated Total Reflection Fourier-transform IR (ATR-FTIR) whereas the Raman spectrum was obtained from cells of the cervical cancer cell line CaSki. Reproduced with permission from Baker et al.[Citation24], Gray et al.[Citation159] and Ramos et al.[Citation170]
![Figure 1. Principle of vibrational spectroscopic techniques and characteristic biological spectra serving as “fingerprints”. When an incident photon interacts with a molecule, it may be absorbed, during infrared (IR) absorption, or scattered. Vibrational energies are quantized and lie in the mid-IR region of the electromagnetic spectrum. Absorption of light is well defined, resonant frequencies give rise to a spectrum which is characteristic of the vibrations of a material. When light scattering occurs, the energy of incident and scattered photons can either remain the same (elastic or Rayleigh scattering) or differ (inelastic or Raman scattering). Depending on whether energy is lost or gained by the incident photon, Stokes or anti-Stokes scattering are observed, respectively. The spectrum of observed energy differences (Raman shifts) provides a similar fingerprint of the chemical composition of a sample.(A) Energy diagram illustrating the electronic transitions of a molecule during Raman anti-Stokes and Stokes scattering, Rayleigh scattering and infrared absorption. Where hυ0 = incident energy; hυvib = vibrational energy; hυR = Rayleigh energy; Δυ = Raman shift; υvib = vibrational frequency.Characteristic spectra generated by analysis of biological samples using (B) IR and (C) Raman spectroscopy. Different spectral regions providing structural information for different biomolecules including proteins, lipids, nucleic acids and carbohydrates are highlighted. The IR spectrum was generated by analysis of human blood serum using Attenuated Total Reflection Fourier-transform IR (ATR-FTIR) whereas the Raman spectrum was obtained from cells of the cervical cancer cell line CaSki. Reproduced with permission from Baker et al.[Citation24], Gray et al.[Citation159] and Ramos et al.[Citation170]](/cms/asset/4668c4d9-3419-48e7-a1ee-95180ef8646e/laps_a_1946076_f0001_c.jpg)
Table 1. Experimental variants of infrared and Raman spectroscopic techniques along with their benefits and limitations. Graphics reproduced and adapted with permission from[Citation1–6].
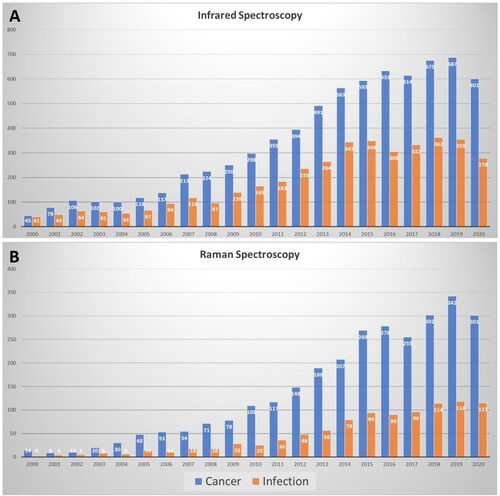
Clinical spectroscopy is attracting increasing interest as an alternative test for the early detection, diagnosis or monitoring of human diseases, including kidney[Citation14], heart[Citation15] and neurodegenerative diseases[Citation16,Citation17], asthma[Citation18], chronic obstructive pulmonary disease[Citation19] and diabetes[Citation20]. The last two decades have also seen a tremendous increase in IR and Raman spectroscopic studies in the fields of cancer (∼15-20 fold increase) and infectious diseases (∼7-30 fold increase) (). Tissues, cells and biological fluids, including blood, urine, saliva or cerebrospinal fluid, are all suitable for spectroscopic analysis, generating characteristic spectra that are indicative of the content of biomolecules such as proteins, lipids, nucleic acids and carbohydrates ().
Figure 2. PubMed search to determine the number of publications that have utilized (A) Infrared and (B) Raman spectroscopy to study cancers and infections during the period 2000-2020. A significant increase of relevant clinical spectroscopy studies is observed in recent years.
This paper will provide a comprehensive review of studies since 2015 that have utilized clinical spectroscopy as a means of studying cancer and infectious diseases toward the development of a cost-effective, rapid diagnostic and/or monitoring test. Studies involving more than 25 participants were deemed eligible for this review, to retain its clinical focus and explore the potential of spectroscopy in a clinical context. Smaller-scale studies have been excluded to avoid those focusing mainly on technology/methodology development. For further information and studies with an emphasis on innovation and emerging trends in biomedical spectroscopy, the readers are directed to the following reviews[Citation1,Citation13,Citation21–28]. Herein, we include both ex vivo and in vivo studies as well as different experimental modes allowing for point spectroscopic assessment or imaging. A health economic evaluation is also provided, to highlight the cost benefit of vibrational spectroscopic techniques in healthcare systems compared to currently used tests. Recent startup companies that have successfully moved forward to translational clinical research are also discussed. Finally, we present a general workflow of clinical spectroscopy and emphasize the requirements for integrating such technologies into a clinical context.
Search strategy: eligibility and exclusion criteria
The literature search was conducted in PubMed for articles that were published between January 2015 and May 2021. Independent reviewers extracted the data and identified eligible studies. Studies were deemed eligible for inclusion if they included more than 25 participants per group (disease and control; if no control group >25 in disease group) to study any cancer type or infectious disease (bacterial, fungal, parasitic, viral). All experimental variants of mid-IR and Raman spectroscopy were considered eligible for inclusion. Studies that analyzed different human sample types (biofluids, cells and tissues) were included.
Articles that used cell lines or non-human samples (animal models) were excluded. Review articles, commentaries and opinion papers were also excluded, as were near-IR studies and those with a focus on drug delivery/development. Non-English articles and those with <25 participants per group (disease and control) were also excluded. The cut off of 25 participants per group was based on the study by Beleites et al. on optimum sample sizes for classification models[Citation29].
IR and Raman spectroscopy in cancer research
Overall, 94 studies were found to satisfy the inclusion criteria: four in bladder cancer, ten studies in brain tumor, five studies in breast cancer, five in colon cancer, seven in gastric cancer, 15 studies in gynaecological cancers (11 cervical precancer/cancer; one endometrial cancer; three ovarian cancer), 17 in head and neck cancers, four in kidney, two in leukemia, three in liver cancer, seven in lung cancer, seven in esophageal cancer, six in skin cancer, two in prostate cancer (). No studies of pancreatic cancer were found with >25 participants.
Figure 3. Clinical spectroscopy in cancer and infectious diseases. Infrared (IR) and Raman spectroscopic techniques have been used for the early detection, diagnosis or monitoring of the depicted cancers and infectious diseases (numbers of identified studies are provided in parenthesis). Different experimental variants, sampling modes and sample types have been used for in vivo or ex vivo clinical studies. Details for each disease and main findings of each study published between 2015-2021 are provided in and .
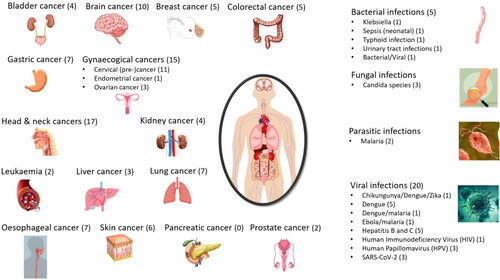
Table 2. Overview of infrared and Raman studies in the field of oncology between January 2015 and May 2021. Studies were deemed eligible for inclusion if they included more than 25 participants per group (disease and control; if no control group >25 in disease group).
Bladder cancer
The literature searches for applications of spectroscopy for the diagnosis of bladder cancer identified four papers that met our inclusion criteria, with two using serum, one using tissue and one using cytology.
Li et al.[Citation30] applied surface enhanced Raman spectroscopy (SERS) to the serum of 36 normal healthy volunteers and 55 patients with bladder cancer. SERS spectra were acquired with a 785 nm laser at 0.5mW and used silver nanoparticles with an acquisition time of 10 seconds. SERS spectra were subjected to genetic algorithms combined with linear discriminant analysis (GA-LDA), which identified six key spectral peaks associated with bladder cancer (associated with proteins, nucleic acids and lipids). Using these six spectral bands it was determined that a sensitivity of 91% and specificity of 100% could be obtained to classify serum derived from normal patients compared to bladder cancer patients. Chen et al.[Citation31] also investigated the use of SERS on serum from bladder cancer patients however focused on the discrimination of muscle invasive bladder cancer from non-muscle invasive bladder cancer, which is a critical determination in the staging, prognosis and treatment options of bladder cancer patients. SERS spectra were acquired from 30 healthy volunteers, 28 non-muscle invasive bladder cancers and 32 muscle invasive bladder cancers. Raman spectra were acquired with a 785 nm laser using silver nanoparticles with a 10 second integration time. Overall diagnostic accuracy using partial least squares-discriminant analysis (PLS-LDA) was found to be 93%, with a 98% accuracy in discriminating between normal and cancer and 93% between non-muscle invasive and muscle invasive bladder cancer.
Fourier transform Infrared spectroscopy (FTIR) has also been investigated for its utility in bladder cancer by Gok et al. using cytology[Citation32] and Witzke et al. on formalin-fixed paraffin embedded (FFPE) tissue sections[Citation33]. Gok et al.[Citation32] examined cytology samples acquired from bladder washes using transmission FTIR from 37 bladder cancer patients and 34 normal controls. This was then confirmed using a separate cohort using attenuated total reflection-FTIR (ATR-FTIR) on 44 bladder cancer patients and 21 normal controls. The cancer group had a mix of carcinomas, papillomas and papillary urothelial neoplasm of low malignant potential. Spectra from both FTIR approaches were subjected to principal component analysis (PCA) and hierarchical clustering analysis (HCA) that led to specificities ranging from 53% to 81% and sensitivities ranging from 82% to 100% depending on the techniques, spectral range analyzed and whether the normal patients were compared to all bladder cancers or just the carcinoma sub-group. Witzke et al.[Citation33] also investigated the application of FTIR in the bladder and combining this approach with identifying regions of interest for laser capture microdissection and later liquid chromatography-mass spectrometry (LC-MS). One part of the study (sample set 2) focused on the application of FTIR imaging to fresh frozen bladder tissues to discriminate between low-grade bladder cancer (19), high grade bladder cancer (43) and severe cystitis (41). Spectra were classified using Random Forest which have 95% sensitivity and specificity when comparing between cancerous and non-cancerous tissue.
Brain tumor
The literature search included the keywords: meningioma, glioblastoma (GBM), astrocytoma and lymphoma. Of the 10 eligible studies, six used a biofluid-based ATR-FTIR/Raman approach, one study included biofluids and brain tissues using a synchrotron-based spectrometer while three studies used tissue samples and ATR-FTIR/Raman.
Hands et al.[Citation34] involved the investigation of blood serum using ATR-FTIR spectroscopy. 122 non-cancer samples were compared against 311 primary tumor samples (gliomas, meningiomas and metastatic). Following a stratified approach, the mean sensitivity and specificity for cancer versus non-cancer was 90% and 78%, which increased to 92% and 83% when using feature selection method via a fed-support vector machine (SVM) approach. In a follow up study by Smith et al.[Citation35], the patient cohort was the same as in the Hands et al. study. However, further feature selection coupled with generalized 2 D correlation analysis to augment the machine learning algorithm was employed to improve the sensitivity and specificity results. Using a random forest model for the second derivate normalized spectra, outputs gave a sensitivity of 93% and a specificity of 92%. Cameron et al.[Citation36] published a study in 2019 which attempted to stratify brain tumor patients by using serum-based ATR-FTIR, aiming particularly to distinguish between glioblastoma and lymphoma patients. 765 samples were analyzed (healthy controls (n = 237), brain tumors (n = 487) and additional lymphoma samples (n = 41)). When assessing healthy versus brain cancer using PLS-DA, the sensitivity and specificity were ∼91%. Using the same technique to differentiate GBM (n = 71) from lymphoma, results accounted for up to 90% sensitivity and 86% specificity. Another study by Cameron et al.[Citation37] delves further into determining brain tumor types using the same method, in order to aid in secondary care. In this study, 87 healthy controls were collected alongside 554 tumor samples which included several subtypes (lymphoma and primary: glioma, meningioma and metastatic). Overall, this test achieved sensitivities and specificities in the high 90% range in distinguishing between brain tumor samples (all subtypes) and healthy controls. When primary and metastatic cancers were compared, 91% sensitivity and 66% specificity were achieved. Butler et al.[Citation38] employed ATR-FTIR spectroscopy to investigate biofluids from the same dataset of 237 non-cancer and 478 cancer samples from Cameron et al.[Citation36] but without the additional lymphoma samples. This study aimed to develop a rapid, high-throughput technique capable of triaging brain cancer patients and yielded 93% sensitivity and sensitivity using an SVM-based classification approach.
The final study involving ATR-FTIR[Citation39], aimed to determine whether a patient with a glioma primary brain tumor possessed the isocitrate dehydrogenase 1 (IDH1) mutation, which indicates a better prognosis, or had IDH1 wild-type lesion. Both serum and tissue samples were investigated, with ATR-FTIR used on the dried serum samples, whilst the tissue samples were investigated using the MIRIAM beamline at the Diamond Light Source synchrotron facility (UK). Serum samples were collected from 36 patients for each IDH1 type and, when investigated using centrifugal filtration coupled with ATR-FTIR, gave a sensitivity and specificity of around 70% respectively. A number of tissue samples (n = 21 for IDH1-mutated and n = 78 for IDH1-wild-type) were lost during sample preparation, and therefore 79 glioma patients were analyzed. Using this method to separate mutated from wild-type IDH1, the authors reported a sensitivity of 82% and a specificity of 83%.
A serum-based Raman study was also completed by Mehta et al.[Citation40] to investigate meningiomas (n = 35) versus controls (n = 35). 25 healthy and 25 meningioma samples underwent PCA and principal component-linear discrimination analysis (PC-LDA), the latter model being subjected to Leave-One-Out Cross-Validation (LOOCV); when tested using an independent test set, the PC-LDA model gave a classification efficiency of 70%. For healthy controls (n = 25) against grade I meningiomas (n = 15), the classification efficiency when tested against an independent test set was 70% and 75% respectively. For healthy (n = 25) against grade II meningiomas (n = 16), the specificity was only 69%, given a number of the meningiomas incorrectly classified; only 10 healthy samples were used for the independent test set which gave a classification efficiency of 80%.
Several studies employed the use of FTIR and Raman spectroscopy on tissue samples to attempt to differentiate between cancer subtypes. Once such study conducted by Lilo et al.[Citation41] used ATR-FTIR to analyze FFPE brain tissue samples coupled with subtype classification via a PLS-LDA model. Utilizing these methods gave a sensitivity and specificity of 80% and 73% for grade I vs grade II meningiomas, 94% sensitivity and 94% specificity for grade I vs grade I recurring and finally 97% sensitivity and 100% specificity for grade II vs grade I recurring meningiomas.
Alternatively, Morais et al.[Citation42] used Raman microspectroscopy imaging to investigate brain tissue samples to determine the grading of the brain tumor. 90 samples were analyzed in total, 66 grade I and 24 grade II meningiomas. The models with the best classification performance were principal component analysis -quadratic discriminant analysis (PCA-QDA) and successive projections algorithm-quadratic discriminant analysis (SPA-QDA). Both models yielded a sensitivity of 86% with a specificity of 100%, with an area under the curve (AUC) of 0.929.
Finally, with regards to tissue sampling, Livermore et al.[Citation43] investigated the use of Raman spectroscopy in classification of gliomas. This study involved the use of fresh tissue (n = 62), FFPE tissues (n = 120), cryosections (n = 79) and LN18 cell lines. For identifying astrocytomas, IDH-wild-type, the PC-LDA model gave a sensitivity of 94% and a specificity of 90%. Astrocytomas with IDH-mutated gave a sensitivity of 91% and specificity of 95% and for Oligodendroglioma, the sensitivity was 79% with 100% specificity. Using the cryosections for astrocytomas with IDH-wild-type, the sensitivity was 78% and specificity 85%, for astrocytomas with IDH-mutant it was 79% and 89% and for oligodendrogliomas, 74% sensitivity and 90% specificity. Finally, for the FFPE sections, astrocytomas with IDH-wild-type the sensitivity was 81% with 84% specificity, for astrocytomas with IDH-mutant the sensitivity and specificity was 72% and 87%, with the oligodendrogliomas having a sensitivity of 79% and a specificity of 93%.
Breast cancer
After the literature search for breast cancer, 54 publications were identified, out of which five were eligible for the current review based on our inclusion and exclusion criteria.
Blood serum of 66 breast cancer patients was investigated by FTIR spectroscopy and compared to blood serum collected from 80 healthy controls[Citation44]. A combinatorial approach of PCA and principal component regression was applied yielding correct identification of cancer cases with sensitivity of 92% and specificity of 87%. These diagnostic values match closely to those of mammography and ultrasound emphasizing the potential of the technique for clinical diagnosis. Similar results were demonstrated by Lin et al.[Citation45], who obtained pre- and post-surgery breast cancer samples along with healthy controls after a serum-based analysis. The approach for surgical evaluation and screening, based on label-free SERS using silver nanoparticles coupled with PCA-LDA, achieved 95% and 100% diagnostic accuracies for pre-surgery versus post-surgery and pre-surgery versus normal groups, respectively. Talari et al. used Raman spectroscopy with PCA and LDA to identify cancer subgroups[Citation46]. To distinguish between luminal A, luminal B, HER2 and triple negative subtypes, 132 tissue microarray breast biopsies were examined. Biochemical alterations linked with lipids, collagen and nucleic acid were identified achieving a specificity of 70%, 100%, and 90% and 97%, for luminal A, luminal B, HER2, and triple negative subtypes respectively. In another study with similar objective, Elmi et al.[Citation47] utilized PCA-LDA to distinguish blood serum samples from 43 breast cancer patients and 43 healthy controls. Differences in FTIR spectra were observed for wavenumbers associated with sugar, collagen, esters and NH stretching region. The results showed that breast cancer could be distinguished from controls with 84% sensitivity, 74% specificity (83% accuracy) in the 3090‐3700 cm‐1 spectral region. The NH stretching vibration in this region was primarily found to be the classifying factor, indicating that the prominent differences in the spectra were due to protein modifications.
Tissue sections in various forms are also frequently analyzed in spectroscopy diagnostic studies. Raman spectral imaging analysis of 82 samples from two sites of cancer patients (safety margin and tumor section) was employed to identify, characterize and discriminate structures in normal and cancerous tissues in a study by Sumacki et al.[Citation48]. The main differences between normal and cancerous tissues were found in regions characteristic of vibrations of carotenoids, fatty acids, proteins and interfacial water. PCA and PLS-DA diagnostic models were built to evaluate the diagnostic value of Raman. The sensitivity and specificity obtained from PLS-DA and cross validation were 86% and 72% respectively, reinforcing Raman imaging as a promising diagnostic tool.
Colon cancer
A literature search identified five papers that met the inclusion criteria for using vibrational spectroscopy to identify colon cancer.
Three papers were focused on measuring biofluids for colon cancer detection. Li et al.[Citation49] used Raman spectroscopy (514.5 nm, 100mW) of serum samples from 75 healthy volunteers, 65 pre-op colon cancers and 60 post-op colon cancers. Spectra were analyzed using PCA and k-nearest neighbors (KNN) and discrimination was identified to be principally due to the nucleic acids, amino acids and chromophores. KNN of the obtained principal components (PCs) demonstrated a diagnostic accuracy of 91%. A study by Moisoiu et al.[Citation50] applied SERS to discriminate between normal (n = 39), and cancers of the colon (n = 109), breast (n = 42), lung (n = 33), oral (n = 17) and ovaries (n = 13) using blood serum. The study used silver nanoparticle and a 532 nm laser at 10mW with a 40 second acquisition time. Derived spectra were analyzed using PCA-LDA and classification of normal from cancer was achieved with a sensitivity of 98% and specificity of 91%. Cancer types were correctly classified with an accuracy of 88% for oral cancer, 86% for colorectal cancer, 80% for ovarian cancer, 76% for breast cancer and 59% for lung cancer. A study by Toraman et al.[Citation51] investigated using FTIR on plasma samples from 30 colon cancer patients and 40 healthy patients. FTIR spectra had 16 spectral features derived which were then subjected to multilayer perceptron neural network and support vector machine (SVM). Numerous classification comparisons were shown with maximum accuracies for SVM of 94 (1300-1000 cm-1 spectral range) and 96 for multilayer perceptron model (1300-1000 cm-1) spectral range.
Two studies were identified which applied spectroscopy to tissue to diagnose colon cancer. Kuepper et al.[Citation52] used transflection mode FTIR imaging to scan tissue microarrays that consisted of 16 well differentiated, 90 moderately differentiated and 19 poorly differentiated colon cancer patients. Spectra were classified using two consecutive random forest classifiers, the first to identify cancerous regions and the second to identify the grade of differentiation. This approach allowed for tumor tissue identification to be made with a 94% sensitivity and 100% specificity. Overall, the classifiers accurately predicted 85% of the cancer grading. Petersen et al.[Citation53] used fiber optic Raman spectroscopy (785 nm, 300mW, 2 second integration) of colon biopsy samples to extract spectra from adenocarcinoma (n = 22), tubular adenomas (n = 141), hyperplastic polyps (n = 79) and normal tissue (n = 101). Classification results demonstrated high-risk lesions could be differentiated from low-risk lesions with a sensitivity of 79% and specificity of 74%, whereas cancer and normal tissue could be discriminated with a sensitivity of 79% and specificity of 83%. This work may allow for future in-vivo measurements to be taken.
Gastric cancer
A literature search identified seven papers that investigated the application of spectroscopic techniques to gastric cancer that met the selection criteria, with five using biofluids and two using tissues.
Three studies used Raman to examine biofluids for the detection of gastric cancer. Bahreni et al.[Citation54] examined whether Raman spectra acquired (532 nm laser, 70mW, 1 second acquisition time) from serum could correlate with traditional enzymatic tests often used for gastric cancer, with correlation above 94% between the Raman spectra and the enzymatic tests. Furthermore, it was shown that 87.5% of samples were correctly classified as being from healthy patients (n = 40) or gastric cancer subjects (n = 20) using PLS regression. A study by Li et al.[Citation55] also examined serum from gastric cancer patients however used SERS (632.8 nm laser, 3.5mW, 10 s exposure time, silver nanoparticles) to discriminate between atrophic gastritis (n = 45), pre-op (n = 43) and post-op (n = 40) gastric cancers and healthy individuals (n = 42). Obtained SERS spectra were subjected to PCA and then with either SVM, LDA or classification and regression tree (CART), with accuracies demonstrated of 97%, 89% and 87% respectively. Another study that was performed using SERS to detect gastric cancer was conducted by Chen et al.[Citation56] using saliva samples. This study used SERS sensors based on graphene oxide nanoscrolls wrapped in gold nanoparticles (785 nm laser at 35mW with a 10 second acquisition time). It was demonstrated that discrimination between early and advanced gastric cancers (n = 104) could be achieved with a specificity over 88% and sensitivity over 80%.
Two studies investigated the use of FTIR on biofluids for gastric cancer diagnosis. A study by Guleken et al.[Citation57] applied FTIR to serum derived from 43 control patients, 45 gastric cancer patients and 45 colon cancer patients. Significant spectral differences were observed in the Amide III and Amide I spectral regions between the cancers and normal patients. PCA analysis demonstrated clustering of the cancers together and separated from the normal cluster. Liu et al.[Citation58] also used FTIR to diagnose gastric cancer however focused on measurements from red blood cells. The study compared the red blood cells spectra from 30 normal patients to 40 gastric cancer patients identified spectral changes associated with protein secondary structures, structure and content of sugars and relative amounts of proteins and sugars. The spectra were subjected to canonical discriminant analysis which gave a 95% sensitivity and 70% specificity.
Two studies were identified that have applied spectroscopy to tissue sections to diagnose gastric cancer, one using ATR-FTIR and one using fiber optic Raman spectroscopy. Ghassemi et al.[Citation59] demonstrated that ATR-FTIR applied to tissue samples could discriminate between normal adjacent and cancerous tissue from the FFPE tissue sections from 30 patients. Data modeling techniques such as PCA, SVM and KNN allowed for classifications with a final classification accuracy of 82% reported. Lin et al.[Citation60] demonstrated the simultaneous use of fingerprint and high-wavenumber Raman spectroscopy with a beveled fiber-optic probe for in-vivo measurements during gastroscopy of the pre-cancerous lesion, gastric intestinal metaplasia. In the study they obtained measurements from 157 gastric patients in which they recorded a total of 4,178 spectra from normal tissue and 432 spectra from gastric intestinal metaplasia. PCA and LDA algorithms were used for classification which resulted in an AUC of 0.92 for disease classification.
Gynaecological cancers
After a literature search for gynaecological cancers since 2015, 214, 53 and 83 studies were identified for cervical, endometrial, and ovarian cancers, respectively, out of which 11, one and three were deemed relevant to the current review based on our inclusion criteria.
Cervical cancer
Women with low- and high-grade cervical precancer as well as invasive carcinoma were investigated. The majority of the studies performed spectroscopic analysis on tissues derived after a biopsy (5/11 studies) and cells that were stored in a preservative medium, namely a liquid-based cytology (LBC) sample (4/11 studies), whereas only 2/11 studies used blood serum samples.
Shrivastava et al.[Citation61] used confocal Raman microscopy in blood serum from controls and cancer patients for diagnostic purposes, achieving 93% sensitivity and 86% specificity. Serial samples were collected from all patients at three different time points (before, during and 6 months post-treatment) to also monitor the effect of treatment. Chemoradiation-related changes were identified in the serial samples with proteins and nucleic acids showing a decrease while phospholipids were elevated. The authors concluded that the observed variations could either be due to treatment or caused by persistence of disease at 6-months, which would therefore necessitate a longer follow-up. Raman profiles from patients after treatment were trending toward the healthy controls, although protein alterations persisted even post-treatment. Such an approach holds promise in disease detection and potentially in treatment monitoring; further studies in longitudinal samples during the course of treatment are required.
In a study using a SERS-based immunoassay of blood serum, two cancer-associated blood biomarkers (squamous cell carcinoma antigen and osteopontin) were simultaneously detected with low detection limits and good selectivity and reproducibility[Citation62]. Healthy subjects as well as histologically confirmed precancer (cervical intraepithelial neoplasia (CIN) 1, 2 and 3) and cancer samples were analyzed with the SERS-based platform and enzyme-linked immunosorbent assay (ELISA) experiments, showing consistent results.
Karunakaran et al.[Citation63] used three different sample preparation approaches (single cells, cell pellets and extracted DNA) to analyze the cytological material from LBC samples. Using a label-free SERS approach, the average diagnostic accuracy for differentiating between normal, high-grade precancer (high-grade-intraepithelial lesions (HSIL)) and cancer samples was higher for single cells and extracted DNA (92-94%), whereas a lower diagnostic accuracy of 74% was achieved in cell pellets.
Three different spectroscopic studies using single cells from LBC samples investigated cervical precancer of low and high grades[Citation64–66]. One study highlighted that cytological samples were suitable for analysis of fresh samples or after storage at −25oC, but not −80oC[Citation64]. After comparison of controls with high-grade precancer across all three studies, the sensitivity and specificity were found to be between 86-100% and 90-100% respectively; sensitivity and specificity for detecting low-grade lesions were 94% and 95-98% respectively. The authors proposed an automated screening system for cervical cancer[Citation65] and also highlighted that histological assessment provided higher diagnostic accuracy in comparison to cytological assessment[Citation66].
Using tissue samples and Raman spectroscopy, five different studies demonstrated high diagnostic accuracies in detecting cervical precancer and cancer[Citation67–71]. Wang et al.[Citation67] classified and identified six different tissue types (inflammation, CIN1, CIN2, CIN3, squamous cell carcinomas and adenocarcinomas) with 86% overall diagnostic accuracy. Precancerous lesions (CIN1-3) were identified with 80-89% accuracy while squamous cell carcinomas and adenocarcinomas were found with 100% and 86% accuracy. Two studies did not include a control group but rather assessed the ability of the approach to differentiate between different cancer subtypes (adenocarcinomas and squamous cell carcinomas)[Citation68,Citation69]. Using different classification algorithms, they achieved diagnostic accuracies ranging between 85-96% in distinguishing the two subtypes of cancer. Using snap frozen tissue sections, Daniel et al.[Citation71] correctly detected normal, precancer and cancer subjects with 70-99% accuracy while also achieving 94% accuracy in detecting well/moderately/poorly differentiated squamous cell carcinomas. Polarized Raman and Raman were both found to accurately discriminate control and cancer subjects, with polarized Raman achieving higher diagnostic values (96% sensitivity, 97% specificity, 97% accuracy versus 92% sensitivity, 72% specificity, 80% accuracy)[Citation71].
Endometrial cancer
One blood-based ATR-FTIR study in endometrial cancer was eligible for inclusion[Citation72]. Using blood plasma samples from healthy controls as well as women with atypical hyperplasia and endometrial cancer of different subtypes, controls were differentiated from all cancers (mixed) with 87% sensitivity and 78% specificity. Endometrioid adenocarcinomas (Type I), the most common subtype of endometrial cancer, were detected with 91% sensitivity and 81% specificity. Precursor lesions of atypical hyperplasia were also identified with high diagnostic accuracy (100% sensitivity and 88% specificity), which may allow fertility sparing management and cancer prevention.
Ovarian cancer
Of the eligible studies for inclusion (n = 3), two performed analysis of biological fluids (ovarian cyst fluid[Citation73] and blood plasma[Citation74] and one used ovarian tissue samples[Citation75].
A SERS-based method was used to detect and quantify haptoglobin (Hp) in ovarian cyst fluid as a diagnostic biomarker for epithelial ovarian cancers[Citation73]. A significantly higher concentration of Hp was identified in malignant in comparison to benign cysts (normalized mean values of 1.85 vs 0.6). Verified against histology, SERS achieved 94% sensitivity and 91% specificity for benign versus malignant samples, while sensitivity was also high (86-100%) for all the different cancer stages (stage I-IV). For comparison, a cancer antigen 125 (CA-125) test was performed on the same patients achieving lower sensitivity and specificity of 85% and 90%, respectively.
Using both Raman and SERS, Paraskevaidi et al. analyzed blood plasma samples from benign and ovarian cancer cases[Citation74]. Both techniques provided satisfactory diagnostic accuracy for the detection of ovarian cancer (stage I-IV) (Raman: 94% sensitivity and 96% specificity; SERS: 87% sensitivity and 89% specificity), as well as for early ovarian cancers (stage I) (Raman: 93% sensitivity and 97% specificity; SERS: 80% sensitivity and 94% specificity). SERS achieved slightly lower diagnostic values, which may be due to poor reproducibility of spectral profiles and intensities. Nevertheless, these findings suggest improved diagnostic accuracy compared to clinically-used molecular biomarkers for ovarian cancer.
Theophilou et al.[Citation75] employed ATR-FTIR spectroscopy to analyze dewaxed FFPE tissues from benign, borderline and cancer patients. Different algorithms were employed (PCA-LDA, successive projections algorithm-LDA (SPA-LDA) and GA-LDA), with GA-LDA providing optimal discrimination between the three classes. Classification of different ovarian carcinoma subtypes (high- and low-grade serous, endometrioid, mixed, mucinous, clear cell and carcinosarcomas) was also performed and achieved overall diagnostic accuracies ranging between 87-100% after two-group comparisons using GA-LDA.
Head and neck cancers
The literature search for Head and Neck cancers included cancer of the pharynx, oropharynx, hypopharynx, larynx, mouth and tongue, and encompassed dysplasia, neoplasia and carcinoma. A total of 278 results were retrieved, 17 of which were deemed to be relevant to the current review (8/17 on biofluids, 2/17 cytology, 5/17 excised tissue, 2/17 in vivo).
Multiple studies have explored the applications of Raman, SERS and IR spectroscopic analysis of human blood plasma and serum for diagnostic applications in human head and neck cancers. Sahu et al.[Citation76] explored the use of using a fiber-optic Raman microprobe (785 nm) of serum samples of 328 subjects belonging to healthy controls, premalignant, disease controls (non-oral cancer), and oral cancer groups. Samples were measured in liquid drop form and PCA-LDA was employed for discriminant analysis, achieving 77% classification efficiency between normal and oral premalignant groups, 89% for normal and disease control groups, and 87% for normal and oral cancer groups. In a four way model, the normal versus abnormal could be differentiated with 64% sensitivity and ∼80% specificity. The study also explored the feasibility of differentiating two different types of cancers (oral and glioma), showing ∼89% efficiency.
A number of studies have sought to enhance the sensitivity of Raman based techniques using SERS, which may be particularly suited to the analysis of relatively dilute biofluids. In the study of Yan et al.[Citation77], the serum of 60 patients with parotid gland tumors was analyzed and compared with that of 31 normal patients. The patients were further stratified into a pleomorphic adenoma group, Wartin’s tumor group and mucoepidermoid carcinoma group. Measurements at 633 nm were made of drops of serum mixed with gold nanoparticles. Using SVM-based analysis, spectra were classified with ∼86% accuracy, ∼90% sensitivity and ∼80% specificity. Tan et al.[Citation78] similarly explored SERS (633 nm) for the analysis of blood serum in liquid form, but for the diagnosis of oral squamous cell carcinoma (OSCC). The study included 135 patients with OSCC, 90 patients with mucoepidermoid carcinoma, selected as the positive control group, while 145 patients with old maxillofacial fracture and healthy volunteers were used as the normal control group. PCA-LDA demonstrated that OSCC could be successfully discriminated from the normal control groups with a sensitivity of 81% and a specificity of 84%. Using similar methodology, Xue et al.[Citation79] analyzed the serum of 135 OSCC patients, grouped according to tumor size, positive lymph nodes, metastases, and histological grade. Accuracies of detection and classification of >85% were achieved for all categories. Lin et al.[Citation80] used a silver nanoparticle serum mixture to measure the SERS response to differentiate 30 nasopharyngeal carcinoma patients and 30 healthy volunteers. Diagnostic sensitivities of 89% and 86%, and corresponding specificities of 71% and 79%, were achieved, using either 785 or 633 nm, respectively. Liang et al.[Citation81] employed SERS for differentiation of benign (n = 30) and malignant (n = 70) thyroid tumors from blood plasma which had been subjected to ultrafiltration, resulting in 90% discrimination accuracy.
Using ATR-FTIR spectroscopy, Adeeba et al.[Citation82] analyzed dried plasma samples of 67 oral cancer patients, 60 "niswar" (a dipping tobacco product) users (considered to be normal, but high risk), and 20 healthy controls. Discriminant analysis resulted in a 90% classification rate.
In an alternative approach, Brindha et al.[Citation83] explored the application of Raman (785 nm) spectroscopy in the high wavenumber region for the analysis of human urine samples, and the detection of oral cancer. Samples from 80 normal subjects, 57 oral premalignant and 60 oral malignant patients were examined, yielding 96% accuracy for classification of normal versus premalignant; 96% accuracy for normal versus malignant; and 93% accuracy across normal, premalignant and malignant groups.
Spectroscopic analysis of oral exfoliated cells has also been employed for oral cancer diagnostics. Sahu et al.[Citation84] harvested samples from 20 healthy volunteers, 20 healthy volunteers with tobacco habits, and 27 with oral premalignant (OPL) conditions. Using Raman spectroscopic analysis (785 nm) of cell pellets, OPL patients could be identified with ∼70% sensitivity in the three-group model, or ∼ 83% in two-group model, indicating that tobacco consumption may be a confounding factor. Sarkar et al.[Citation85] employed a combination of fluorescence, atomic absorption and FTIR to explore the relative expression level of relevant biomolecules in exfoliated cell samples of clinically diagnosed and histopathologically confirmed oral leucoplakia (n = 20) and OSCC (n = 19) patients, compared to those from 20 nonsmokers, 60 smokers. Although no diagnostic classification was undertaken, the study indicated the effect of smoking on cellular bioenergetic and hememetabolic pathways, which may be important for early cancer development.
Clinically relevant studies of tissue samples have been carried out using Raman, SERS and Infrared spectroscopies. Sun et al.[Citation86] examined smears from cancerous (n = 39) and non-cancerous nasopharyngeal tissues (n = 35) using confocal Raman spectroscopy (785 nm), establishing a diagnostic sensitivity of 87% and specificity of 86% for differentiation of the two tissue types. Jeng et al.[Citation87] used a combination of visually enhanced lesion imaging and Raman microspectroscopy to examine cryopreserved tissue samples from 35 oral cancer patients who had undergone surgery. Thirty-five cancer lesions and thirty-five control samples with normal oral mucosa were analyzed. PCA-LDA of Raman spectra resulted in diagnostic accuracy of 83%, sensitivity 80%, and specificity 86%. Regions of interest of the autofluorescence images were differentiated with 90% accuracy, 100% sensitivity, and 80% specificity. The combination of the two techniques differentiated cancer and normal groups with 97% accuracy, 100% sensitivity, and 94 % specificity. Vohra et al.[Citation88] used a functionalized “nanorattle” SERS (785 nm) based technique to target cytokeratin nucleic acid biomarkers specific to head and neck squamous cell carcinoma (HNSCC). Patients were chosen from adults with HNSCC, thyroid papillary carcinoma, lymphoma, or benign lymphoid or tonsillar disease, and 25 samples were obtained from human cervical lymph nodes, tonsils, oropharyngeal mucosa, sinus mucosa, and thyroid gland tissue. Tissues were flash frozen, before RNA extraction and functionalized SERS measurement, resulting in a diagnostic sensitivity of 100% and specificity of 89% in distinguishing HNSCC from other tissue types. Chundayil Madathil et al.[Citation89] designed a novel SERS catheter device and demonstrated its potential using samples from 37 patients with abnormal oral lesions. Regions of oral tissues identified as disease-free, malignant oral squamous cell carcinoma (OSCC), verrucous carcinoma and premalignant leucoplakia were detected and classified with an accuracy of 97%. Correct classification of OSCC tumors into three grades was achieved with an accuracy of 98%. Stimulated Raman Scattering was explored by Hoesli et al.[Citation90] to differentiate normal and cancerous tissue from head and neck cancer patients. 42 tumor samples and 42 normal adjacent controls were derived from 50 patients, and diagnostic sensitivities and specificities of 91 and 95% were achieved, respectively, for neoplastic vs non-neoplastic images.
In vivo Raman studies were carried out by both Malik et al.[Citation91] and Bhatacharjee et al.[Citation92] In the first study, Raman spectroscopy was performed on tumor and contralateral normal mucosa in 99 oral cancer patients. Patients were then followed up to track the reappearance of cancerous lesions. Recurrences of lesions were predicted with a sensitivity of 80% and specificity 30%. The latter study aimed to explore the potential of Raman spectroscopy for prediction of disease-free survival of oral cancer patients. Raman spectra were obtained from the tumor and contralateral regions of 94 OSCC patients. Based on identified spectral markers, a model for disease free survival rates (>1000 days) were established, with a prediction error of <0.25.
Kidney cancer
The literature search for Kidney cancer included kidney and renal cancer, including dysplasia, neoplasia, carcinoma, Grawitz tumor, hypernephroma and nephrocarcinoma. A total of 138 results were retrieved, four of which were deemed to be relevant to the current review.
Renal cell carcinoma in tissue samples has been studied using both Raman[Citation93,Citation94] and SERS[Citation95]. He et al.[Citation93] established a (785 nm) Raman spectroscopy-based SVM model to classify (n = 77 samples) human renal tumor from normal and fat regions of tissue with an accuracy of 93%. Liu et al.[Citation94] collected needle biopsy kidney tissue samples from 63 patients who had received radical or partial nephrectomy. Raman spectroscopy (532 nm), coupled with discriminant analysis, could distinguish tumor and normal tissues with an accuracy of 83%, and malignant versus benign tumors with sensitivity and specificity of 92% and 71%. Low-grade and high-grade tumors were classified with an accuracy of 87%. In addition, clear cell renal carcinoma was differentiated from oncocytoma and angiomyolipoma with accuracies of 100% and 89%, respectively. Histological subtypes of cell carcinoma were distinguished with an accuracy of 94%. Mert et al.[Citation95] employed SERS (830 nm) to examine normal and abnormal homogenized tissue samples collected from 40 patients at different cancer stages. In a range of different diagnostic comparisons, the study demonstrated sensitivity, specificity, and total accuracy as high as 100%
Sablinskas et al.[Citation96] employed the less explored technique of Fiber ATR-IR to examine fresh kidney tissue, resected from patients undergoing surgery. Spectra of tissue were measured inside the operation theater, immediately after resection, using an ATR silver halide fiber probe. A classification accuracy of 79% of kidney tumor was achieved.
Leukemia
The literature search for Leukemia produced a total of 98 results, of which only two blood-based studies were deemed relevant to the current review.
In the study of Bai et al.[Citation97], Raman spectroscopy was employed to study the features of blood plasma of 33 patients with diffuse large B-cell lymphoma (DLBCL) and 39 with chronic lymphocytic leukemia (CLL), compared to 30 healthy volunteers. Measurements were made in droplet form using a 785 nm laser source. Classification models were constructed using orthogonal partial least squares discriminant analysis, resulting in 93% sensitivity and 100% specificity of 100% for the CLL model, whereas for the DLBCL model resulted in 80% sensitivity and 92% specificity.
Féré et al.[Citation98] explored a number of different classification strategies, applied to the (532 nm) Raman spectra of blood smears spread on glass slides, for the diagnosis of chronic lymphocytic leukemia. The study included one group of 61 healthy patients and one group of 79 untreated CLL patients, and explored different scenarios, dependent on the clinical objective, i.e., balanced sensitivity and specificity, maximum sensitivity, or maximum specificity. Classification accuracies of up to ∼88% were achieved.
Liver cancer
After a literature search for spectroscopic techniques to diagnose liver disease, three papers were deemed eligible based on the search criteria.
Two papers, Li et al.[Citation99] and Yu et al.[Citation100] investigated the application of SERS using silver nanoparticles to serum samples from patients with liver diseases. Li et al.[Citation99] used SERS to discriminate between 44 healthy patients, 45 liver cancer patients, 42 post-treatment liver cancer patients and 45 liver cirrhosis patients. Spectra were acquired using a 632 nm laser at 3.5 mw with a 10 second acquisition time. The SERS spectra were subjected to SVM, PLS and artificial neural networks, which resulted in accuracies of 92%, 89% and 90% respectively. Yu et al.[Citation100] also used SERS on blood serum however applied this approach to a different cohort with 104 healthy volunteers, 104 liver cancer patients and 100 nasopharyngeal patients. SERS spectra were acquired using laser at 785 nm at 0.1mW with a 10 second acquisition time and subjected to either PLS or PCA for dimensionality reduction which were then used in SVM with a Gaussian radio basis function. Diagnostic accuracies of 95% were achieved for the training set and 91% for the validation set.
Zhang et al.[Citation101] also investigated the application of SERS with silver nanoparticles to liver disease however took measurements from liver tissues slices from 56 patients, with 46 normal adjacent tissue and 56 from cancer tissue. SERS spectra were acquired using a 532 nm laser with a four second acquisition time. The SERS spectra were subjected to PCA-LDA which resulted in sensitivities and specificities of 100% between cancerous and normal adjacent tissue. They found that 838, 1448, and 1585 cm−1 peaks were significantly altered in the cancerous tissue regions.
Lung cancer
Out of the 55 results obtained from the literature search in lung cancer, seven were deemed eligible for this review (2/7 using biofluids; 5/7 using tissue samples).
In a study by Qian et al.[Citation102], saliva samples of 61 lung cancer patients and 66 healthy controls were examined using a portable SERS system with a nano-modified chip. A SVM diagnostic model was built using random forest algorithms with LOOCV, achieving 95-97% sensitivity and 100% specificity.
Xiao et al.[Citation103] attempted to detect and compare serum metabolic profiles in three cancer types, lung, breast and liver via SERS along with healthy controls. Vibrational frequencies associated with metabolites like tryptophan, phenylalanine, proline, valine, adenine and thymine were used as discriminative factors. Diagnostic accuracy was assessed using an orthogonal PLS-DA (OPLS-DA) multivariate algorithm. All cancers were clearly distinguished from healthy controls as well as between the different cancer types, highlighting the potential of SERS as a label-free, noninvasive approach for metabolites profiling and diagnosis of cancer.
Five different studies investigated lung cancer using tissues (ex vivo or in vivo). Bangaoil et al.[Citation104] used FTIR to analyze benign (n = 66) and malignant (deparaffinized) FFPE tissues (n = 54). PCA and hierarchical cluster analysis distinctly clustered benign from malignant tissues with 98% sensitivity and 93% specificity (95% accuracy), which is in agreement with histopathological assessment. Weng et al.[Citation105] demonstrated the feasibility of applying a deep learning algorithm to automatically differentiate normal and three types of lung cancerous tissues (adenocarcinoma, squamous cell carcinoma and small-cell carcinoma) using coherent anti-Stokes Raman scattering (CARS) imaging. Images were acquired after thawing of tissues that had been snap-frozen and analyzed in real-time. The computational model achieved 89% accuracy in classifying the four classes which could provide instant information and accelerate clinical decision-making. McGregor et al.[Citation106] presented the use of a real-time endoscopy Raman system to improve the diagnostic specificity of localizing lung cancer in central airways. Results were based on data obtained from 280 tissue sites (72 malignant lesions, 208 normal) in 80 patients, subjected to multivariate analyses and waveband selection methods. The model demonstrated that malignant lesions can be detected with 90% sensitivity but lower specificity of 65%. Akalin et al.[Citation107] demonstrated the potential of spectral histopathology by acquiring data from normal and lung cancer cases (commercial tissue microarrays) and benign lesions (standard excised tissues). The hyperspectral data set acquired from tissue imaging was analyzed by multivariate analysis, revealing changes in the biochemical composition between tissue types, and between various stages and states of disease. LOOVC-based SVM classifier could separate benign from malignant lesions with 99% accuracy while clear distinction was seen between the different adenocarcinoma subtypes. Großerueschkamp et al.[Citation108] performed automated marker-free identification of lung tumor classes and subtypes of adenocarcinoma by FTIR imaging and a novel trained random forest classifier. The tissue imaging analysis led to identification of non-small cell lung carcinomas, adenocarcinomas, squamous cell carcinoma, small cell lung cancer, hamartochondroma, carcinoids, thymoma, large cell neuroendocrine carcinoma and diffuse malignant mesothelioma with accuracy of 97% and subclasses of adenocarcinoma tumors with an accuracy of 95%.
Esophageal cancer
A total of 32 results were recovered after a literature search for esophageal cancer, seven of which were considered relevant for the current review (3/7 using biofluids; 4/7 using tissue samples).
Using a number of different biofluids (plasma, serum, saliva and urine), Maitra et al.[Citation109] evaluated the ability of ATR-FTIR to discriminate stages of esophageal transformation into adenocarcinoma. Different chemometric models were applied (PCA-quadratic discriminant analysis (PCA-QDA), SPA-QDA, GA-QDA) to discriminate controls from individuals with disease, with PCA/GA-QDA achieving optimal results (100% sensitivity and specificity) when using blood plasma or urine samples. The same group also analyzed samples from the same cohort of patients using Raman spectroscopy[Citation110], achieving similar results with GA-LDA providing 100% accuracy for all classes when using saliva or urine samples and >90% accuracy when using blood samples. Feng et al.[Citation111] used SERS to obtain the complete biochemical profile of modified nucleosides in urine samples from 52 controls and 55 esophageal cancer patients. The ability of SERS to discriminate cancer from healthy participants was tested using PLS-LDA, which allowed complete separation of the two classes with 100% accuracy.
In a study by Wu et al.[Citation112], synchrotron infrared microspectroscopy was employed to differentiate between healthy controls (n = 32) and esophageal cancer patients (n = 39) using hair samples. Spectral data was analyzed using PCA as an exploratory technique and discriminant analysis as a classification technique. Clear differentiation was observed between the two groups, with a sensitivity of 90% and specificity 88%. A different study by Maitra et al.[Citation113] used Raman microspectroscopy to discriminate stages of esophageal transformation to adenocarcinoma in human tissues. Normal, inflammatory, Barrett's esophagus, low-grade and high-grade dysplasia as well as esophageal adenocarcinoma samples were analyzed and three chemometric techniques were tested for classification (PCA-QDA, SPA-QDA and GA-QDA). Sensitivity and specificity ranged between 90-100% and 71-100% respectively (91-100% accuracy) for identifying each class. Overall GA-LDA provided optimal results. Ishigaki et al.[Citation114] used Raman spectroscopy to detect early-stage esophageal cancer (stage I) using 50 normal and 42 fresh tissues. Through partial least squares regression analysis (PLS-R) and self-organization maps (SOMs), it was possible to discriminate between normal and cancerous samples, although a relatively large overlap was observed. Using LDA on six Raman bands that were statistically different provided an 81% sensitivity and 94% specificity after comparison of normal versus stage I cancerous tissues. Wang et al.[Citation115] evaluated the potential of in vivo Raman spectroscopy as a real-time diagnostic tool for esophageal squamous cell carcinoma (ESCC). Spectra were acquired from 48 esophageal cancer patients using a Raman fiber optic endoscopic tool that was developed for rapid analysis. Using PLS-DA, the sensitivity and specificity for detecting ESCC were 93% and 94% respectively.
Skin cancer
The literature search for Skin cancers included malignant, pre- and neoplastic lesions, involving melanoma and non-melanoma skin cancers (NMSC), such as basal cell skin cancer (BCC), squamous cell carcinoma (SCC) and actinic keratosis (AK) of the skin. Out of 404 studies identified since 2015, six were deemed relevant for this review based on our inclusion criteria. The majority of the studies (5/6) was performed on tissue samples using Raman spectroscopy; only one study included the use of infrared imaging on histological samples.
In 2015, Wald and Goormaghtigh[Citation116] employed FTIR imaging and PLS-DA to analyze histological sections and identify the main cell types found in melanoma tumors, achieving an accuracy of over 90%. The same study compared melanoma cells in patients with primary (n = 26) and metastatic tumors (n = 25), although no class differences were identified. Discrimination of different stages (stage I/II versus stage III/IV) of primary tumors was assessed, achieving 89% sensitivity and 71% specificity.
Two in vivo studies were carried out using Raman spectroscopy to discriminate between cancerous and normal skin. Schleusener et al.[Citation117] collected Raman spectra from subjects with lesions of BCC (n = 35) and SCC (n = 22). BCC samples were successfully discriminated from normal skin (n = 104) with 63% sensitivity and 83% specificity (73% accuracy). All NMSC combined (BCC/SCC, n = 57) versus normal skin (n = 104) resulted in sensitivity and specificity of the PLS-DA model up to 74% and 82% respectively (78% accuracy). Zhao et al.[Citation118] examined skin cancer and precancerous lesions from 74 patients, which were compared to benign lesions from 46 participants. Performing a retrospective analysis using a previous cohort of lesions (n = 518) as training set, the AUC was found to be ∼0.90. Using the same cohort, but including a wavenumber selection-based analysis, the same group improved the diagnostic specificity from a range of 17-65% to 20-75% when sensitivity was fixed to 90-99%[Citation119].
Santos et al.[Citation120] developed a method to improve diagnosis of melanoma based on Raman spectroscopy. High-wavenumber Raman spectra were collected from lesions suspicious for melanoma (common nevi and melanoma in situ: n = 128), with measurements performed on multiple locations within the lesions. A PCA-LDA diagnostic model was developed on a dataset of common nevi and melanoma in situ (n = 78) and then validated on an independent dataset (n = 50). The diagnostic model correctly classified all melanomas in the independent dataset with a highest possible specificity of 44% at a fixed sensitivity of 100%. Feng et al.[Citation121] explored the discriminating power between different types of NMSC (BCC, n = 14; SCC, n = 20; AK, n = 10) and healthy skin regions (n = 44) from the same patients using receiver operating characteristic (ROC) curve analysis; the results showed high sensitivity up to 95% with a rather low specificity of 10%.
Pancreatic cancer
The literature search for pancreatic cancers included malignant, pre- and neoplastic lesions, involving exocrine and endocrine cancers, such as adenocarcinomas (PDAC) and neuroendocrine tumors (NET) of the pancreas. A total of 98 results were found for the chosen time interval, of which 4 studies were deemed to be clinically relevant; however, none of them were based on a required number of patients to be included in this review.
Prostate cancer
The literature search for prostate cancer resulted in 22 studies, of which only 2 blood-based were deemed relevant to the current review.
In a study by Medipally et al.[Citation122], Raman and IR spectra were recorded from blood plasma samples obtained from 33 healthy controls and 43 prostate cancer patients. Significant spectral differences were observed between the spectra of two categories exhibiting different Gleason scores. The acquired spectra were analyzed by PCA, PLS-DA and classical least squares fitting to discriminate samples with and without disease and provide insights into the underlying molecular species. The PLS-DA classifier was able to classify the presence of disease with sensitivities and specificities ranging between 90-99%. The CLS fitting identified several analytes that are involved in the development and progression of prostate cancer. Another study from the same group monitored radiotherapeutic response in blood plasma of prostate cancer patients reflected in the spectral profiles after FTIR analysis[Citation123]. Samples were acquired from 53 prostate cancer patients at five different time points (prior treatment, after hormone treatment, at the end of radiotherapy, two months post radiotherapy and eight months post radiotherapy) and analyzed using PCA. Discrimination was observed between spectra recorded at baseline versus follow up time points, as well as between spectra from patients showing minimal and severe acute and late toxicity. The diagnostic model achieved sensitivity and specificity rates ranging from 80% to 99%[Citation50].
IR and Raman spectroscopy in infectious diseases
Overall, 30 studies were identified in the literature to satisfy the inclusion criteria. Five studies in bacterial/viral (1/5 sepsis, 1/5 Typhoid infection, 1/5 Urinary tract infection, 1/5 Klebsiella and 1/5 bacterial/viral (not specified)), three in fungal (Candida infections, Candida or T. rubrum), two in parasitic (malaria) and 20 in viral infections (Chikungunya; Dengue; Ebola; Hepatitis B and C (HBV and HCV); Human Immunodeficiency Virus (HIV); Human Papillomavirus (HPV); Severe acute respiratory syndrome coronavirus 2 (SARS-CoV-2)) ().
Table 3. Overview of infrared and Raman studies in infectious diseases between January 2015 and May 2021. Studies were deemed eligible for inclusion if they included more than 25 participants per group (disease and control; if no control group >25 in disease group).
Bacterial infections
Patients diagnosed with any bacterial infection were investigated. Five studies were finally included in the review based on the inclusion criteria (biofluid-based: 1/5 using blood serum; 1/5 urine; 1/5 saliva; 1/5 anal and pharyngeal swabs; cytology-based: 1/5 white blood cells).
Naseer et al.[Citation124] used serum-based Raman spectroscopy to discriminate between participants infected with Salmonella typhi (n = 60) and healthy controls (n = 60). PCA was used as an exploratory approach, whereby two principal components (PCs) were chosen (90% of variance). The authors identified characteristic spectral signatures that differed between the two classes. However, no other classification approach was employed. In an exploratory study, Yunanto et al.[Citation125] used FTIR of saliva samples to facilitate the diagnosis of neonatal sepsis. Spectral information was obtained from newborns at risk of sepsis (n = 30) and healthy (n = 30) and significantly different spectral regions were reported, showing changes in nucleic acid/protein regions, which might be resulting from an inflammatory process. Tien et al.[Citation126] used SERS cylindrical chips to identify pathogens in patients with urinary tract infection (UTI) (n = 108). Urine was sent for bacterial culture as a reference method and also analyzed using SERS chips to identify bacteria. Of the 108 patients, 97 samples with a single bacterial species were identified by conventional urine culture. In the others, mixed flora was observed, which was not possible to detect by SERS. SERS identified 93 samples directly, while the remaining four samples required concentration to identify bacteria. The use of SERS in conjunction with the recognition software could allow a quicker and less expensive identification of pathogens.
Using white blood cells and FTIR spectroscopy, Agbaria et al.[Citation127] assessed accessible and inaccessible bacterial and viral infections. In this study, spectra from 343 individuals were collected, including 113 controls, 89 inaccessible bacterial infections, 54 accessible bacterial infections, 60 inaccessible viral infections, and 27 accessible viral infections. The authors used SVM which resulted to the classification between controls vs infected (95% accuracy). It was also possible to identify the etiology of accessible infections with >94% sensitivity and >90% specificity in one hour after blood collection with a < 6% error rate. The authors concluded that the classification results demonstrate the methodology's ability to diagnose the etiology of inaccessible infections with high reliability. Dinkelacker et al.[Citation128] used FTIR spectroscopy as a tool for the rapid typing Klebsiella clinical isolates and compared their results with whole genome sequencing (WGS) (gold standard). Samples from 57 patients were used (anal and pharyngeal swabs − 68 isolates, of which 53 K. pneumoniae; 11 K. varicella; 4 K. quasipneumoniae). 75% similarity was chosen as a cutoff value for grouping, and applying this value to the dendrogram, 28 groups were observed that comprized 8 isolates. The cluster congruence was quantified with the adjusted Rand index (ARI). ARI = 1 means total congruence between two methods. Comparing the FTIR-based to the WGS-based method (gold standard), there was a high similarity, which was reflected in an ARI of 0.837. A congruent result in relation to the WGS phylogeny was obtained for 63 isolates (∼93%). The results demonstrated that FTIR spectroscopy has the ability to evaluate the relationship of Klebsiella strains exhibiting high congruence with the WGS gold standard method.
Fungal infections
Three studies were identified which examined fungal infections (2/3 using biofluids; 1/3 using tissues).
Wohlmeister et al.[Citation129] used FTIR (reflectance mode) associated with Soft Independent Modeling by Class Analogy (SIMCA) to identify of Candida species isolated from vaginal secretions. The study included samples of vaginal secretions from 48 women infected with a Candida species (C. albicans (n = 36), C. glabrata (n = 10), C. krusei (n = 2)). PCA was applied as an exploratory analysis technique, while SIMCA maximized interclass distance and class prediction (internal and external validation). Through the application of SIMCA, ∼93% (n = 45) of the samples were correctly classified. Silva et al.[Citation130] used ATR-FTIR to discriminate clinically relevant Candida species. The analyzed isolates were obtained from different biological samples (vaginal exudate, urine, blood and sputum). In this study, an exploratory analysis of the spectra of these clinical isolates with PCA was performed, and classification analysis was performed with PLS-DA. For the classification, different analyses were performed to discriminate between C. albicans, C. glabrata, C. krusei, C. parapsilosis and C. tropicalis species (most important clinical infections) with PLS-DA achieving ∼100% correct detection of the clinical isolates.
Kourkoumelis et al.[Citation131] evaluated the ability of Raman spectroscopy to detect fungal infections by analyzing healthy (n = 26) and infected nails (n = 52). Using PCA, efficient differentiation of healthy, T. rubrum and Candida species infected nails was achieved. SIMCA and PLS-DA were further applied to generate diagnostic algorithms for the classification of Raman spectra. Both techniques succeeded in classifying clinical nail samples in three groups according to their mycological categories. The authors demonstrated that Raman spectroscopy is a promising method for the differentiation of healthy vs. diseased nails, including efficient differentiation between onychomycosis caused by T. rubrum and Candida species.
Parasitic infections
Studies on parasitic infections including Malaria, Babesiosis and Leishmania were identified since 2015. Out of the 64 results obtained, only two fit into the inclusion criteria. Two studies investigating parasitic infections (malaria) were identified after literature search (1/2 using dried blood spots; 1/2 using red blood cells).
Two independent studies on the detection of malaria parasites have extended spectroscopic approaches to large clinical pilot trials. Heraud et al.[Citation132] tested 318 patients exhibiting malaria symptoms from four regional clinics in Thailand. Blood samples from all patients were pre-analyzed using three different conventional testing methods namely optical microscopy using a Giemsa staining, rapid diagnostic tests (RDT), and qPCR (gold standard). According to qPCR, 151 tested positive while 167 patients tested negative for malaria infection. Spectral data were acquired using a portable ATR-FTIR spectrometer, which can be operated from a laptop computer or a mobile telephone with in-built software that guides the user through the sample measurement. To minimize the effect of confounding variables such as spectral noise, water vapor, background fluctuations, and possible contamination by sample fixation, an independent quality control software suite was designed to ensure each spectrum acquired passed the stipulated criteria for data modeling. PLS-DA and SVM algorithms were employed to create classification models, with PLS-DA achieving 90% sensitivity and 91% specificity while SVM analysis showed better classification with 92% sensitivity and 97% specificity for discriminating P. falciparum malaria infection. Finally, spectral data were encrypted and automatically uploaded to a cloud-based diagnostic system where spectra are pre-processed using the classifier located in the “Cloud”. This system will enable non-experts to rapidly process and receive a malaria diagnosis within 5 minutes.
Mwanga et al.[Citation133] carried out a similar pilot trial in Tanzania. A malaria parasite survey was conducted using RDTs and PCR assays across 1486 households. Blood samples obtained were further re-analyzed by optical microscopy to ascertain the presence of malaria parasites. Finger prick volumes of blood were acquired from all participants and subsequently dried on to filter paper to form a dried blood spot. Altogether, positive (n = 123) and negative (n = 173) PCR pre-confirmed samples were scanned directly using a portable ATR-FTIR spectrometer. Seven independent machine learning algorithms were used to analyze the spectral data including k-nearest neighbors, logistic regression, SVM, naïve Bayes, XGBoost, random forest and Multilayer perceptron. Logistic regression models gave the best results, having an overall classification accuracy of 92% for P. falciparum and 85% for predicting mixed infections of P. falciparum and Plasmodium ovale.
Viral infections
The literature search for viral infections included Human Papillomavirus (HPV), Ebola, Hepatitis B and C (HBV and HCV), Zika, Dengue, Chikungunya, Yellow fever, Human Immunodeficiency Virus (HIV), and Severe acute respiratory syndrome coronavirus 2 (SARS-CoV-2). Of the total 53 studies retrieved, 20 were deemed to be relevant based on the inclusion criteria (7/20 Dengue; 5/20 HBV and HCV; 3/20 HPV; 3/20 SARS-CoV-2; 1/20 HIV; 1/20 Ebola infections)
Dengue & other infections
Globally, diseases caused by viruses are regarded as a major public health issue. Global dengue incidences have risen dramatically in recent decades. There are four distinct but closely related dengue virus (DENV) serotypes, namely DENV-1, DENV-2, DENV-3, and DENV-4. Hitherto, several diagnostic methods have been developed, that includes serological (ELISA) and virological assays (reverse transcriptase–polymerase chain reaction (RT–PCR)). Despite the advancement in the point of care combination tests, considerable challenges endured in the clinical management of dengue-infected patients, including the non-existences of definitive biomarkers[Citation10].
Most of the studies to date are based on serum analysis. In 2016, Khan et al.[Citation134], examined the biochemical changes associated with dengue infections from 40 infected individuals and 25 healthy controls and distinctive Raman peaks were apparent in infected samples. Most notably, a Raman line at 750 cm−1 was assigned to adenosine diphosphate (ADP), which is expected to be excreted into extra-cellular media during cell rupture. However, no chemometric investigation was conducted to prove the diagnostic prediction of the proposed approach. A different study from the same group exploited the combination of Raman spectroscopy and SVM algorithm to elucidate the biochemical disparities between 31 dengue positive and 53 negative samples[Citation135]. Similar Raman bands were observed (750, 850, 1450, and 1660 cm−1 which were assigned to ADP, Tryptophan- immunoglobulin G (IgG), IgG, and Amide I (proteins)) in the dengue-infected samples. When analyzing the spectra of three independent SVM models using kernel functions including Gaussian radial basis function, polynomial function, and a linear function, the best performance was achieved with the polynomial kernel with sensitivity of 73% and a specificity of 93% (85% accuracy).
In another study, two different conventional approaches, such as IgG and immunoglobulin M (IgM) – captured ELISA, were evaluated in comparison with Raman spectroscopy[Citation136]. The sensitivity, specificity, and accuracy for Raman spectroscopy in comparison to IgM and IgG captured with the ELISA assay were 61%, 72%, and 66%, and 43%, 52%, and 47%, respectively. Authors explained the rationale behind the ‘low sensitivity’ concern with Raman analysis as being due to the greater number of false-negative results. There were 21 samples (20%) misdiagnosed as dengue negative with Raman spectroscopy, whilst IgM values of ELISA predicted them as dengue positive. However, the spectroscopic approach provides preferable specificity along with sensitivity and a very low false positive rate in comparison to IgM than IgG assays.
In 2017, Amin et. al[Citation137] identified unique spectral signatures associated with 32 dengue infected serum samples including Raman bands that were not reported earlier. These Raman bands provided an exceptional sensitivity of 93%, specificity of 100%, and diagnostic accuracy of 97% using PCA-LDA. Khan et.al[Citation138] also demonstrated that Raman spectroscopy with a random forest algorithm could correctly classify 100 dengue suspected samples (sensitivity, specificity of 91%). Analysis of the spectra demonstrated discernible variations in the peak intensities and additional Raman bands were observed, which were indicative of elevated lactate level in the infected samples.
A successful attempt has been made to evaluate the potential of ATR-FTIR spectroscopy in conjunction with multivariate classification techniques between healthy versus dengue versus chikungunya versus zika blood samples[Citation139]. Since these viruses belong to the same family (i.e., Flaviviridae) and have similar surface proteins, cross-reactivity is a pertinent concern in clinical diagnostic routines. A combination of ATR-FTIR spectroscopy and different multivariate algorithms (PCA–LDA, SPA-LDA, and GA-LDA) showed an excellent sensitivity and specificity of 100% in healthy, dengue, and chikungunya classes. However, classification of zika samples exhibited a 100% sensitivity and 92% specificity with PCA–LDA and SPA–LDA models whilst GA-LDA showed sensitivity of 92% and specificity of 86%.
Similarly, due to the overlapping clinical symptoms between malaria and dengue infections, a precise diagnosis remains challenging. Recently, Patel et al.[Citation140] reported a Raman spectroscopy-based stratified analysis on 130 subjects (37 malaria, 39 dengue, and 54 healthy controls). The authors showed a classification efficiency of 83% for both dengue and malaria whilst 100% efficacy was achieved with control data sets for the 3-model system (malaria vs dengue vs controls) using PC-LDA and validated using a LOOCV approach. Besides, a ROC displayed a sensitivity/specificity of 0.95 for malaria versus controls and 0.96 for dengue versus controls. As compared with existing diagnostic approaches, the acquired classification efficiency to stratify malaria versus dengue is enhanced. Nevertheless, machine-learning involving larger-cohorts analysis would be highly recommended before clinical translations.
HBV & HCV infections
HBV and HCV cause both acute and chronic infections. In 2018, Sohail et al.[Citation141] analyzed 227 samples, (105 healthy individuals, 122 HCV infected). Raman spectroscopy combined with a proximity-based machine learning technique was utilized to obtain a sensitivity of 97%, specificity of 94%, and a diagnostic accuracy of 95%. Significant spectral changes were observed due to variation peak intensities of lectin, chitin, lipids, ammonia and viral proteins as a consequence of the HCV infection. A better specificity of 100% and an accuracy of 98% was achieved with a Raman spectroscopy-SVM model in differentiating 84 normal sera samples from 119 HBV infected samples[Citation142]. A SVM model was built on two separate kernels i.e., polynomial function and Gaussian RBF for extracting Raman spectral features of control sera and infected sera samples. The best classification performance was achieved using a polynomial kernel of order-2. In another study, Roy et al.[Citation143] employed three sample preparation methodologies including sera deposited onto glass cover slips, airdried and placed onto the ATR crystal, whole serum dried directly onto the ATR crystal, and ultrafiltration to deplete high- and low-molecular weight serum components and the high-molecular weight fraction placed directly onto the ATR-FTIR diamond window and dried. PLS-DA was applied to all three cases and sensitivity of 84%, 80%, and 77% and specificity of 93%, 97%, and 83% were established in HBV versus control, HCV versus control, and HBV versus HCV classification sets with the first approach (direct deposition onto ATR crystal). The depletion of high molecular weight components from low molecular weight fraction slightly enhanced sensitivity and specificity. The sensitivity of 88% and 82%, and specificity of 95% and 90% were achieved in HBV versus control, HCV versus control samples.
Tong et al.[Citation144], applied a combination of Raman spectroscopy and adaptive iterative weighted penalty least squares method, PCA, particle swarm optimization algorithm, and SVM (airPLS-PCA-PSO-SVM) approaches on 500 HBV and 500 non-HBV clinical samples (including suspected bacterial infections with serum procalcitonin (PCT) test results >0.5 μg/L , HCV patients, liver cirrhosis, liver cancer patients) and healthy controls. A sensitivity of 100%, specificity of 88%, and accuracy of 93% were attained. More recently, Lu et al.[Citation145] demonstrated the discrimination potential of Raman spectroscopy with a multiscale convolution independent circulation neural network between 499 healthy people and 435 HBV patients and accuracy of the approach was determined to be 96%.
Ebola & other infections
In regard to Ebola disease diagnosis, point of need diagnostic methods are critical. The initial clinical symptoms of the disease mimicking other endemic diseases, such as malaria, are certainly hindering the effective diagnosis. Sebba et al.[Citation146] developed a multiplexed POC immunoassay platform that uses surface-enhanced Raman scattering (SERS) tags to simultaneously detect antigens from Ebola, Lassa and malaria within a single blood sample. The SERS assay design comprises of a Raman reporter placed on the surface of a gold nanoparticle which enhances the strength of the scattering (∼4-8 orders of magnitude). The team has showed a sensitivity and specificity of 90% and 98% for Ebola detection (n = 100), whilst 100% for Malaria detection (n = 163). Besides these excellent statistics, the proposed assay does have limitations. The performance of SERS technology in human samples in an outbreak is undetermined. Moreover, the challenges due to the sample matrix including the disparities between fresh versus frozen blood or serum versus whole blood samples are remaining, which affect the potential of this assay technology.
HIV infections
Very recently, Silva et al.[Citation147] successfully detected HIV infection in pregnant women using ATR-FTIR spectroscopy. The authors used blood plasma samples from 80 healthy controls and 40 HIV-positive patients obtaining a sensitivity of 83% and specificity of 92% after using GA-LDA.
HPV infections
In 2020, three spectroscopic studies focused on HPV infection, out of which two studies exploited Raman spectroscopy whilst the other study utilized FTIR. Chen et al.[Citation148] applied Raman spectroscopy in cervical secretions with a combination of a few multivariate data analysis techniques (airPLS-PLS-GA-SVM model), which achieved 94% sensitivity and 100% specificity (99% accuracy). Similarly, Zheng et al.[Citation149] analyzed Raman spectral data from 33 normal and 30 high-risk HPV positive cervical exfoliated cell samples using a LOOCV method, which provided 100% sensitivity, 97% specificity and 98% accuracy. Mo et al.[Citation150] investigated the performance of FTIR combined with PCA-LDA to facilitate the rapid and noninvasive screening of 50 high-risk HPV infections using cervical exfoliated cell samples. The method was able to produce sensitivity and specificity of 98%.
SARS-CoV-2 infections
SARS-CoV-2 has been emerged as a threat to humanity due to its severity in swift spreading of infection. As yet there are only three studies on the utilization of vibrational spectroscopic approaches for SARS-CoV-2 diagnosis. Barauna et al.[Citation151] proposed the exploitation of ATR-FTIR spectroscopy with a GA-LDA algorithm to detect and discriminate infected from healthy control samples. In total, saliva samples from 111 SARS-CoV-2 negative patients and 70 SARS-CoV-2 positive patients were used (confirmed by RT-PCR) and provided a 95% blind sensitivity and 89% specificity. Interestingly infrared spectra of the purified virus showed no evidence of amide modes. Carlomagno et al.[Citation152] used a Raman-based deep learning classification model to discriminate the signal collected from COVID-19 saliva samples with accuracy, precision, sensitivity and specificity of more than 95%. However, the control versus SARS-CoV-2 positive versus negative sample model provided 84% sensitivity and 92% specificity (88% accuracy) by LOOCV. More recently, Wood et al.[Citation153] investigated the utilization of infrared spectroscopy for the rapid point-of-care detection of COVID-19 markers in saliva from 29 SARS-CoV-2 positive patients and 28 negative using a portable infrared spectrometer with a purpose-built transflection accessory. This study demonstrated a sensitivity of 93 % (27/29) and a specificity of 82 % (23/28) using a Monte Carlo Double Cross Validation algorithm with 50 randomized test and model sets. Furthermore, they isolated and purified the virion particles from cell culture and identified the specific infrared and Raman marker bands associated with SARS-CoV-2 virus from RNA, proteins and lipids. The isolation of the virion particles was confirmed by transmission electron microscopy that clearly showed the virion particles with the characteristic corona and glycoprotein spikes.
Health economic considerations
The extensive research reported is a testament to the potential of vibrational spectroscopy as a platform in medical analysis. Whilst the capability of these approaches and applications has been explored comprehensively, the barriers to translation still exist, as is shown by the number of technologies and products that have actually entered the medical market. A potential reason for this lack of translation is perhaps a predisposition in research to focus upon the technology performance in a given clinical niche, or a more superficial exploration of the medical application itself. Interaction with key opinion leaders and close consideration of the wider influences in health care are essential for translation.
For any new medical technology, it is essential that it is safe and effective, but also that it contains healthcare expenditures – essentially creating a balance between efficacy and cost[Citation154]. As well as providing the evidence required for approval for use, health economic assessments are a recommended way of further exploring the use of a technology within a clinical area and establishing clinical utility.
In the area of IR and Raman spectroscopy, the subject of ‘cost’ is predominantly associated with the cost of instrumentation, substrates, and occasionally reagents[Citation155–158]. It could be assumed that the gross value of these components together would infer the relative cost of a technology. However, health economics is not simply a comparison of these costs between different instruments, or approaches. The entire clinical pathway, and the technology’s position within it, needs to be assessed so that comparisons within that pathway can be made. A topical example would be a [hypothetical] technology that was positioned as a screening test for COVID-19, which would need to compete with the existing test (PCR) in terms of cost per analysis, as well as critical factors such as sample throughput. Whereas a low-cost device may be able to compete, some instrumentation may be unsuitable. In this example there is an obvious comparator technology; however, in some instances this may not be the case, and a close economic evaluation will be required to truly understand the cost-benefit implications.
A series of health economic studies have been published with regards to a blood serum test for brain tumor detection[Citation159,Citation160]. Initially, the current clinical pathway for brain cancer diagnosis is described, and the position of the test within that pathway is explored[Citation159]. This study took into consideration proof-of-principal results, and factored this test performance into a cost-effectiveness calculation, showing that the spectroscopic test could provide cost savings in a primary and secondary care setting. A follow-up study explored the health economic model further, by using prospective data, as well as an additional cost-consequence analysis for tumor type discrimination[Citation160]. These studies are invaluable for enabling translation, and the examples described here are good resources for future studies and applications.
Successful startups toward clinical translation
Over the last 5 − 10 years there has been a welcome increase in entrepreneurial activity within the clinical spectroscopic field. However, we start this section with a discussion of an early trailblazer, River D (formerly known as River Diagnostics) (https://www.riverd.com/). River D was formed in 2002 and is a spin-out of the Erasmus Medical Center in Rotterdam, Netherlands. River D’s main product within a clinical application is the gen2-SCA, a highly sensitive confocal Raman system for in vivo skin analysis that can determine molecular concentration profiles from the skin surface within minutes and with high spatial resolution. This can help to study penetration and transdermal delivery of topically applied materials. PitchBook shows that River D is a well-established company with its latest deal as a Series B (https://pitchbook.com/profiles/company/58999-87).
Other companies backed by strong patent portfolios are appearing in the space (note some of the authors are directors of these companies). Dxcover Ltd is a spin-out of the Department of Pure and Applied Chemistry at the University of Strathclyde (https://www.dxcover.com/). Dxcover Ltd formed in 2016 and spun out in 2019 with a seed funding. To date they have raised £5.1 M to progress their novel spectroscopic liquid biopsy for the detection of cancer. Glyconics is a spin-out from research performed at the University of Swansea and are developers of medical diagnostics device design for early detection of exacerbation (https://glyconics.com/). Glyconics use FTIR to diagnose and monitor acute and chronic diseases from the molecular analysis of sputum to detect chronic obstructive pulmonary disease in patients with respiratory problems. Invenio (https://www.invenio-imaging.com) are pioneering Stimulated Raman Histology (SRH) that allows 3-D imaging of thick tissue specimens for the detection of disease. This technology enables analysis that does not required physical sectioning, performing a spectroscopic measurement at each point and displaying the results as a pseudo-colour image for each molecular species. Crunchbase shows that Invenio Imaging is based upon research from the Department of Chemistry and Chemical Biology at Harvard University and have rasied $7.5 M in funding and now have headquarters in silicon valley (https://www.crunchbase.com/organization/invenio-imaging).
There is also a burgeoning market in new instrumentation represented by new companies and mergers / acquisitions of other companies within the spectroscopic field. These companies do not have the company mission of translating clinical spectroscopy in a similar fashion to the companies named above but worth noting is the acquisition of Cobalt Light Systems by Agilent. The instrumentation developed by Cobalt can rapidly and accurately identify materials hidden inside objects or through barriers (such as the skin). IRsweep are developing the next generation of fast broadband and high-resolution dual-comb spectrometers (https://irsweep.com/) and Photothermal Spectroscopy Group who have pioneered the development of instruments for optical Photothermal Infrared (O-PTIR) (https://www.photothermal.com).
The descriptions above are by no means exhaustive and are representative of a developing area within spectroscopy and exemplify innovation that originated in research for both clinical spectroscopy and spectroscopic instrumentation that is progressing toward / completed commercial application.
Considerations for the translation of clinical spectroscopy
Translation of vibrational spectroscopy into the clinical environment has been relatively slow[Citation23]. The field of clinical spectroscopy would greatly benefit from multidisciplinary research centers that would not only assess the clinical potential of such technologies but also explore routes to the market and secure funding for large-cohort randomized clinical trials, which would facilitate and expedite clinical translation.
Standardization of pre-analytical, analytical and post-analytical steps is crucial for any analytical method intended for clinical implementation[Citation2,Citation161–164]. Multinational networks, such as the International Society for Clinical Spectroscopy (CLIRSPEC) (https://clirspec.org/) and Raman4Clinics (https://www.raman4clinics.eu/) founded in 2015, aim to pool expertise and develop collaborations between scientists, chemometricians, industrial and clinical partners in a concerted effort to promote the translation of spectroscopic techniques into the clinic. The objectives of these networks range from optimizing sample preparation protocols and determining instrumentation requirements suitable for clinical use, to developing data analysis/sharing protocols and assessing spectroscopy’s clinical value and patient benefit.
Depending on the study design, the performance of spectroscopy needs to be evaluated as a screening/triage, diagnostic, prognostic or monitoring tool in large multi-center studies. In case the proposed spectroscopic test provides comparable or even superior accuracy to currently available tests, then it could be considered for implementation into the routine clinical practice. However, apart from assessing the diagnostic performance, other factors, such as health economics, automation, time for analysis and ease-of-use, should be taken into consideration and compared head-to-head with clinically validated approaches. Disruption of the normal clinical workflow should also be kept minimal to gain the support of the medical community. A general workflow of clinical spectroscopy is depicted in , whereas suggested steps for clinical translation, from a preclinical phase to clinical trials along with technical considerations are provided in [Citation3,Citation171].
Figure 4. General workflow of clinical spectroscopy.
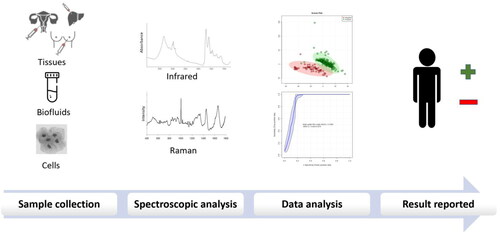
Figure 5. Steps toward clinical translation of vibrational spectroscopy. Reproduced with permission from Butler et al.[Citation3].
![Figure 5. Steps toward clinical translation of vibrational spectroscopy. Reproduced with permission from Butler et al.[Citation3].](/cms/asset/50bd83df-373b-4b92-9353-b6b4f3649a58/laps_a_1946076_f0005_c.jpg)
The ability of spectroscopy to analyze different sample types opens the technology up to different clinical applications. For instance, a highly-sensitive spectroscopic test of easily-accessible biofluids or cells (blood, urine, exfoliated cervical cells) would be valuable as a first-line screening tool, which may then require a secondary, more invasive (cerebrospinal fluid, tissue) but also specific test for a definite diagnosis. Such a two-step workflow has the potential to minimize unnecessary referrals to a secondary setting (as first-step highly sensitive) but also avoid over-diagnosis and over-treatment (as secondary-step highly specific).
Technological advancements in the field of spectroscopy have allowed the advent of portable, hand-held and miniaturized devices to permit point-of-care testing[Citation13]. The emergence of quantum cascade lasers (QCLs), as high intensity light sources permitting IR measurements at discrete frequencies, is another important step forward into future clinical translation as they can decrease acquisition time and increase signal-to-noise ratio and resolution, thus enhancing the diagnostic capability[Citation165–168]. Development of fiber probes has also permitted in vivo applications for disease diagnostics or evaluation of surgical margin intra-operatively[Citation169]. However, despite the fact that fiber-based spectroscopy has proven its potential to facilitate diagnosis and guide treatment, large-scale trials confirming the promising results from proof-of-concept studies are still lacking. The requirements of instrumentation, such as resolution, portability, ease-of-use, speed of data acquisition/analysis, should be determined based on their clinical application and the setting for which these instruments are destined for (remote field trial, primary/secondary care, intra-operative).
Conclusion
It is clear that biomedical vibrational spectroscopy has shown promise in different clinical applications, from disease screening and diagnosis to treatment and monitoring of disease progression. Over the past last twenty years (2000 − 2020), there was a dramatic increase in the literature outputs for research in both IR and Raman spectroscopy for diagnosis of both cancer and infectious disease, although the rate of increase slowed significantly since ∼ 2016. Notably, of the studies identified by the inclusion criteria, only ∼10% of these were considered clinically relevant, based on the exclusion criteria, in the case of cancer diagnostics. This was highest for the case of esophageal cancer (∼22%), in which tissue studies, including in vivo, dominate. Amongst the cancer studies deemed eligible, biofluid based diagnostics were most prevalent (∼47%), followed by tissue (∼45%). Clinically relevant cytological based studies were relatively few, although they featured strongly for bladder (25%) and gynaecological (27%) cancer diagnostics. In the area of infectious disease, clinically relevant virology studies dominated (∼67%), and these were almost exclusively (90%) performed on biofluids.
The analysis of the literature first and foremost leads to the conclusion that increasing emphasis must be placed by the scientific community on the clinical relevance of studies intended to prove the concept of the applicability of vibrational spectroscopic techniques for clinical diagnostic applications. The exclusion criterion of <25 participants per group (disease and control) neglects many valuable fundamental and proof of concept studies[Citation1,Citation13,Citation21–27]. However, credible prospects of clinical translation can only be based on credible statistical analyses.
The predominance of biofluid based studies is also noteworthy. They are spatially homogeneous in their liquid form, or, as measured using the increasingly popular technique of ATR, the spatial inhomogeneity of dried droplets is automatically integrated in a single measurement. Time consuming and computationally demanding spatial imaging/mapping therefore is not required, as it is for tissue. Lower cost, portable/miniaturized IR and Raman instrumentation has become increasingly available, potentially for point-of-care diagnostics, and it is therefore not surprising that the past 5 years have seen significant activity toward the commercialization of biofluid based diagnostic techniques, supported in some cases by health economics studies to demonstrate the feasibility of clinical translation. In histo/cytological applications, progress toward the realization of clinical translation has advanced less rapidly. Although the proof-of-concept has been demonstrated, in many cases, with clinically relevant cohorts, feasibility in terms of clinical workflow and health economics may rely on emerging and further instrumental and data processing developments, to reduce acquisition and analysis times.
Increasing bibliometric attention has been mostly given to disease diagnostics which highlights the need for further large-scale studies into the latter clinical applications. Nevertheless, continuous advancements in the field will undoubtedly shed light on these applications in the years to come.
Herein, we have reported human studies of mid-IR and Raman spectroscopy investigating cancer and infectious diseases since 2015. Although the potential of such technologies in these diseases has been demonstrated, larger emphasis should be placed on the requirements for clinical translation. Standardization of study design and protocols, collaborations between the scientific, medical and industrial community, as well as randomized clinical trials are all of imminent importance for the translation of promising analytical tools into the clinic. This review has also considered the health economics of vibrational spectroscopy in the clinical arena and presented successful startup companies with a clinical focus.
References
- Wang, D.; He, P.; Wang, Z.; Li, G.; Majed, N.; Gu, A. Z. Advances in Single Cell Raman Spectroscopy Technologies for Biological and Environmental Applications. Curr. Opin. Biotechnol. 2020, 64, 218–229. doi:https://doi.org/10.1016/j.copbio.2020.06.011 (2020).
- Butler, H. J.; Ashton, L.; Bird, B.; Cinque, G.; Curtis, K.; Dorney, J.; Esmonde-White, K.; Fullwood, N. J.; Gardner, B.; Martin-Hirsch, P. L.; et al. Using Raman Spectroscopy to Characterize Biological Materials. Nat. Protoc. 2016, 11, 664–687. doi:https://doi.org/10.1038/nprot.2016.036
- Butler, H. J.; Cameron, J. M.; Jenkins, C. A.; Hithell, G.; Hume, S.; Hunt, N. T.; Baker, M. J. Shining a Light on Clinical Spectroscopy: Translation of Diagnostic IR, 2D-IR and Raman Spectroscopy towards the Clinic. Clin. Spectrosc. 2019, 1, 100003. doi:https://doi.org/10.1016/j.clispe.2020.100003
- Nicolson, F.; Kircher, M. F.; Stone, N.; Matousek, P. Spatially Offset Raman Spectroscopy for Biomedical Applications. Chem. Soc. Rev. 2021, 50, 556–568. doi:https://doi.org/10.1039/D0CS00855A
- Gebrekidan, M. T.; Erber, R.; Hartmann, A.; Fasching, P. A.; Emons, J.; Beckmann, M. W.; Braeuer, A. Breast Tumor Analysis Using Shifted-Excitation Raman Difference Spectroscopy (SERDS). Technol. Cancer Res. Treat. 2018, 17, 1533033818782532. doi:https://doi.org/10.1177/1533033818782532
- Gardner, B.; Stone, N.; Matousek, P. Non-Invasive Chemically Specific Measurement of Subsurface Temperature in Biological Tissues Using Surface-Enhanced Spatially Offset Raman Spectroscopy. Faraday Discuss. 2016, 187, 329–339. doi:https://doi.org/10.1039/c5fd00154d
- Wartewig, S.; Neubert, R. H. Pharmaceutical Applications of Mid-IR and Raman Spectroscopy. Adv. Drug Deliv. Rev. 2005, 57, 1144–1170. doi:https://doi.org/10.1016/j.addr.2005.01.022
- Martínez Cortizas, A.; López-Costas, O. Linking Structural and Compositional Changes in Archaeological Human Bone Collagen: An FTIR-ATR Approach. Sci. Rep. 2020, 10, 17888. doi:https://doi.org/10.1038/s41598-020-74993-y
- de Oliveira Penido, C. A. F.; Pacheco, M. T. T.; Lednev, I. K.; Silveira, L. Raman Spectroscopy in Forensic Analysis: identification of Cocaine and Other Illegal Drugs of Abuse. J. Raman Spectrosc. 2016, 47, 28–38. doi:https://doi.org/10.1002/jrs.4864
- Li-Chan, E.; Chalmers J. M.; Griffiths P. R.. Applications of vibrational spectroscopy in food science. John Wiley & Sons; 2010. https://www.google.co.uk/books/edition/Applications_of_Vibrational_Spectroscopy/MTLoO-IJJYIC?hl=en&gbpv=0
- Ong, T. T.; Blanch, E. W.; Jones, O. A. Surface Enhanced Raman Spectroscopy in Environmental Analysis, Monitoring and Assessment. Sci. Total Environ. 2020, 720, 137601. doi:https://doi.org/10.1016/j.scitotenv.2020.137601
- Ben-Jaber, S.; Peveler, W. J.; Quesada-Cabrera, R.; Cortés, E.; Sotelo-Vazquez, C.; Abdul-Karim, N.; Maier, S. A.; Parkin, I. P. Photo-Induced Enhanced Raman Spectroscopy for Universal Ultra-Trace Detection of Explosives, Pollutants and Biomolecules. Nat. Commun. 2016, 7, 12189. doi:https://doi.org/10.1038/ncomms12189
- Pahlow, S.; Weber, K.; Popp, J.; Wood, B. R.; Kochan, K.; Rüther, A.; Perez-Guaita, D.; Heraud, P.; Stone, N.; Dudgeon, A.; et al. Application of Vibrational Spectroscopy and Imaging to Point-of-Care Medicine: A Review. Appl. Spectrosc. 2018, 72, 52–84. doi:https://doi.org/10.1177/0003702818791939
- Bispo, J. A. M.; de Sousa Vieira, E. E.; Silveira, L.; Fernandes, A. B. Correlating the Amount of Urea, Creatinine, and Glucose in urine from Patients with Diabetes Mellitus and Hypertension with the Risk of Developing Renal Lesions by Means of Raman Spectroscopy and Principal Component Analysis. J. Biomed. Opt. 2013, 18, 087004–087004. doi:https://doi.org/10.1117/1.JBO.18.8.087004
- Haas, S. L.; Müller, R.; Fernandes, A.; Dzeyk-Boycheva, K.; Würl, S.; Hohmann, J.; Hemberger, S.; Elmas, E.; Brückmann, M.; Bugert, P.; et al. Spectroscopic Diagnosis of Myocardial Infarction and Heart Failure by Fourier Transform Infrared Spectroscopy in Serum Samples. Appl. Spectrosc. 2010, 64, 262–267. doi:https://doi.org/10.1366/000370210790918508
- Nabers, A.; Hafermann, H.; Wiltfang, J.; Gerwert, K. Aβ and Tau Structure-Based Biomarkers for a Blood- and CSF-Based Two-Step Recruitment Strategy to Identify Patients with Dementia Due to Alzheimer's Disease. Alzheimers Dement. (Amst) 2019, 11, 257–263. doi:https://doi.org/10.1016/j.dadm.2019.01.008
- Paraskevaidi, M.; Morais, C. L. M.; Lima, K. M. G.; Snowden, J. S.; Saxon, J. A.; Richardson, A. M. T.; Jones, M.; Mann, D. M. A.; Allsop, D.; Martin-Hirsch, P. L.; et al. Differential Diagnosis of Alzheimer's Disease Using Spectrochemical Analysis of Blood. Proc. Natl. Acad. Sci. U. S. A. 2017, 114, E7929–E7938. doi:https://doi.org/10.1073/pnas.1701517114
- Sahu, A.; Dalal, K.; Naglot, S.; Aggarwal, P.; Krishna, C. M. Serum Based Diagnosis of Asthma Using Raman Spectroscopy: An Early Phase Pilot Study. Plos One. 2013, 8, e78921. doi:https://doi.org/10.1371/journal.pone.0078921
- Whiteman, S. C.; Yang, Y.; Jones, J. M.; Spiteri, M. A. FTIR Spectroscopic Analysis of Sputum: preliminary Findings on a Potential Novel Diagnostic Marker for COPD. Ther. Adv. Respir. Dis. 2008, 2, 23–31. doi:https://doi.org/10.1177/1753465807087972
- Scott, D. A.; Renaud, D. E.; Krishnasamy, S.; Meriç, P.; Buduneli, N.; Cetinkalp, S.; Liu, K.-Z. Diabetes-Related Molecular Signatures in Infrared Spectra of Human Saliva. Diabetol. Metab. Syndr. 2010, 2, 48. doi:https://doi.org/10.1186/1758-5996-2-48
- Ralbovsky, N. M.; Lednev, I. K. Towards Development of a Novel Universal Medical Diagnostic Method: Raman Spectroscopy and Machine Learning. Chem. Soc. Rev. 2020, 49, 7428–7453. doi:https://doi.org/10.1039/D0CS01019G
- Baker, M. J.; Byrne, H. J.; Chalmers, J.; Gardner, P.; Goodacre, R.; Henderson, A.; Kazarian, S. G.; Martin, F. L.; Moger, J.; Stone, N.; et al. Clinical Applications of Infrared and Raman Spectroscopy: state of Play and Future Challenges. Analyst 2018, 143, 1735–1757. doi:https://doi.org/10.1039/C7AN01871A
- Byrne, H. J.; Baranska, M.; Puppels, G. J.; Stone, N.; Wood, B.; Gough, K. M.; Lasch, P.; Heraud, P.; Sulé-Suso, J.; Sockalingum, G. D. Spectropathology for the Next Generation: Quo Vadis? Analyst 2015, 140, 2066–2073. doi:https://doi.org/10.1039/C4AN02036G
- Baker, M. J.; Hussain, S. R.; Lovergne, L.; Untereiner, V.; Hughes, C.; Lukaszewski, R. A.; Thiéfin, G.; Sockalingum, G. D. Developing and Understanding Biofluid Vibrational Spectroscopy: A Critical Review. Chem. Soc. Rev. 2016, 45, 1803–1818. doi:https://doi.org/10.1039/C5CS00585J
- Chan, K. L. A.; Kazarian, S. G. Attenuated Total Reflection Fourier-Transform Infrared (ATR-FTIR) Imaging of Tissues and Live Cells. Chem. Soc. Rev. 2016, 45, 1850–1864. doi:https://doi.org/10.1039/c5cs00515a
- Kazarian, S. G. Perspectives on Infrared Spectroscopic Imaging from Cancer Diagnostics to Process Analysis. Spectrochim. Acta A. Mol. Biomol. Spectrosc. 2021, 251, 119413. doi:https://doi.org/10.1016/j.saa.2020.119413
- Lazaro-Pacheco, D.; Shaaban, A. M.; Rehman, S.; Rehman, I. Raman Spectroscopy of Breast Cancer. Appl. Spectrosc. Rev. 2020, 55, 439–475. doi:https://doi.org/10.1080/05704928.2019.1601105
- Kochan, K.; Perez-Guaita, D.; Adegoke, J.; Veettil, T. C.; Martin, M.; Roy, S.; Pebotuwa, S.; Heraud, P.; Wood, B. EXPRESS: Infrared Spectroscopy of Blood. Appl. Spectrosc. 2021, 71, 611–646. doi:https://doi.org/10.1177/0003702820985856
- Beleites, C.; Neugebauer, U.; Bocklitz, T.; Krafft, C.; Popp, J. Sample Size Planning for Classification Models. Anal. Chim. Acta. 2013, 760, 25–33. doi:https://doi.org/10.1016/j.aca.2012.11.007
- Li, S.; Li, L.; Zeng, Q.; Zhang, Y.; Guo, Z.; Liu, Z.; Jin, M.; Su, C.; Lin, L.; Xu, J.; et al. Characterization and Noninvasive Diagnosis of Bladder Cancer with Serum Surface Enhanced Raman Spectroscopy and Genetic Algorithms. Sci. Rep 2015, 5, 1–7. doi:https://doi.org/10.1038/srep09582
- Chen, S.; Zhu, S.; Cui, X.; Xu, W.; Kong, C.; Zhang, Z.; Qian, W. Identifying Non-Muscle-Invasive and Muscle-Invasive Bladder Cancer Based on Blood Serum Surface-Enhanced Raman Spectroscopy. Biomed. Opt. Express. 2019, 10, 3533–3544. doi:https://doi.org/10.1364/BOE.10.003533
- Gok, S.; Aydin, O. Z.; Sural, Y. S.; Zorlu, F.; Bayol, U.; Severcan, F. Bladder Cancer Diagnosis from Bladder Wash by Fourier Transform Infrared Spectroscopy as a Novel Test for Tumor Recurrence. J. Biophotonics. 2016, 9, 967–975. doi:https://doi.org/10.1002/jbio.201500322
- Witzke, K. E.; Großerueschkamp, F.; Jütte, H.; Horn, M.; Roghmann, F.; von Landenberg, N.; Bracht, T.; Kallenbach-Thieltges, A.; Käfferlein, H.; Brüning, T.; et al. Integrated Fourier Transform Infrared Imaging and Proteomics for Identification of a Candidate Histochemical Biomarker in Bladder Cancer. Am. J. Pathol. 2019, 189, 619–631. doi:https://doi.org/10.1016/j.ajpath.2018.11.018
- Hands, J. R.; Clemens, G.; Stables, R.; Ashton, K.; Brodbelt, A.; Davis, C.; Dawson, T. P.; Jenkinson, M. D.; Lea, R. W.; Walker, C.; et al. Brain Tumour Differentiation: rapid Stratified Serum Diagnostics via Attenuated Total Reflection Fourier-Transform Infrared Spectroscopy. J. Neurooncol. 2016, 127, 463–472. doi:https://doi.org/10.1007/s11060-016-2060-x
- Smith, B. R.; Ashton, K. M.; Brodbelt, A.; Dawson, T.; Jenkinson, M. D.; Hunt, N. T.; Palmer, D. S.; Baker, M. J. Combining Random Forest and 2D Correlation Analysis to Identify Serum Spectral Signatures for Neuro-Oncology. Analyst 2016, 141, 3668–3678. doi:https://doi.org/10.1039/c5an02452h
- Cameron, J. M.; Butler, H. J.; Smith, B. R.; Hegarty, M. G.; Jenkinson, M. D.; Syed, K.; Brennan, P. M.; Ashton, K.; Dawson, T.; Palmer, D. S.; et al. Developing Infrared Spectroscopic Detection for Stratifying Brain Tumour Patients: glioblastoma Multiforme vs. Analyst 2019, 144, 6736–6750. doi:https://doi.org/10.1039/C9AN01731C
- Cameron, J. M.; Rinaldi, C.; Butler, H. J.; Hegarty, M. G.; Brennan, P. M.; Jenkinson, M. D.; Syed, K.; Ashton, K. M.; Dawson, T. P.; Palmer, D. S.; et al. Stratifying Brain Tumour Histological Sub-Types: The Application of ATR-FTIR Serum Spectroscopy in Secondary Care. Cancers (Basel) 2020, 12, 1710. doi:https://doi.org/10.3390/cancers12071710
- Butler, H. J.; Brennan, P. M.; Cameron, J. M.; Finlayson, D.; Hegarty, M. G.; Jenkinson, M. D.; Palmer, D. S.; Smith, B. R.; Baker, M. J. Development of High-Throughput ATR-FTIR Technology for Rapid Triage of Brain Cancer. Nat. Commun. 2019, 10, 4501. doi:https://doi.org/10.1038/s41467-019-12527-5
- Cameron, J. M.; Conn, J. J. A.; Rinaldi, C.; Sala, A.; Brennan, P. M.; Jenkinson, M. D.; Caldwell, H.; Cinque, G.; Syed, K.; Butler, H. J.; et al. Interrogation of IDH1 Status in Gliomas by Fourier Transform Infrared Spectroscopy. Cancers 2020, 12, 3682. doi:https://doi.org/10.3390/cancers12123682
- Mehta, K.; Atak, A.; Sahu, A.; Srivastava, S.; C, M. K. An Early Investigative Serum Raman Spectroscopy Study of meningioma. Analyst 2018, 143, 1916–1923. doi:https://doi.org/10.1039/C8AN00224J
- Lilo, T.; Morais, C. L. M.; Ashton, K. M.; Pardilho, A.; Davis, C.; Dawson, T. P.; Gurusinghe, N.; Martin, F. L. Spectrochemical Differentiation of Meningioma Tumours Based on Attenuated Total Reflection Fourier-Transform Infrared (ATR-FTIR) Spectroscopy. Anal. Bioanal. Chem. 2020, 412, 1077–1086. doi:https://doi.org/10.1007/s00216-019-02332-w
- Morais, C. L. M.; Lilo, T.; Ashton, K. M.; Davis, C.; Dawson, T. P.; Gurusinghe, N.; Martin, F. L. Determination of Meningioma Brain Tumour Grades Using Raman Microspectroscopy Imaging. Analyst 2019, 144, 7024–7031. doi:https://doi.org/10.1039/c9an01551e
- Livermore, L. J.; Isabelle, M.; Bell, I. M.; Scott, C.; Walsby-Tickle, J.; Gannon, J.; Plaha, P.; Vallance, C.; Ansorge, O. Rapid Intraoperative Molecular Genetic Classification of Gliomas Using Raman Spectroscopy. Neurooncol. Adv. 2019, 1, vdz008. doi:https://doi.org/10.1093/noajnl/vdz008
- Sitnikova, V. E.; Kotkova, M. A.; Nosenko, T. N.; Kotkova, T. N.; Martynova, D. M.; Uspenskaya, M. V. Breast Cancer Detection by ATR-FTIR Spectroscopy of Blood Serum and Multivariate Data-Analysis. Talanta 2020, 214, 120857. doi:https://doi.org/10.1016/j.talanta.2020.120857
- Lin, D.; Wang, Y.; Wang, T.; Zhu, Y.; Lin, X.; Lin, Y.; Feng, S. Metabolite Profiling of Human Blood by Surface-Enhanced Raman Spectroscopy for Surgery Assessment and Tumor Screening in Breast Cancer. Anal. Bioanal. Chem. 2020, 412, 1611–1618. doi:https://doi.org/10.1007/s00216-020-02391-4
- Talari, A. C.; Rehman, S.; Rehman, I. U. Advancing Cancer Diagnostics with Artificial Intelligence and Spectroscopy: identifying Chemical Changes Associated with Breast Cancer. Expert Rev. Mol. Diagn. 2019, 19, 929–940. doi:https://doi.org/10.1080/14737159.2019.1659727
- Elmi, F.; Movaghar, A. F.; Elmi, M. M.; Alinezhad, H.; Nikbakhsh, N. Application of FT-IR Spectroscopy on Breast Cancer Serum Analysis. Spectrochim. Acta A. Mol. Biomol. Spectrosc. 2017, 187, 87–91. doi:https://doi.org/10.1016/j.saa.2017.06.021
- Surmacki, J.; Brozek-Pluska, B.; Kordek, R.; Abramczyk, H. The Lipid-Reactive Oxygen Species Phenotype of Breast Cancer. Raman Spectroscopy and Mapping, PCA and PLSDA for Invasive Ductal Carcinoma and Invasive Lobular Carcinoma. Molecular Tumorigenic Mechanisms beyond Warburg Effect. Analyst 2015, 140, 2121–2133. doi:https://doi.org/10.1039/c4an01876a
- Li, X.; Yang, T.; Li, S.; Wang, D.; Song, Y.; Zhang, S. Raman Spectroscopy Combined with Principal Component Analysis and k Nearest Neighbour Analysis for Non-Invasive Detection of Colon Cancer. Laser Phys. 2016, 26, 035702. doi:https://doi.org/10.1088/1054-660X/26/3/035702
- Moisoiu, V.; Stefancu, A.; Gulei, D.; Boitor, R.; Magdo, L.; Raduly, L.; Pasca, S.; Kubelac, P.; Mehterov, N.; Chiș, V.; et al. SERS-Based Differential Diagnosis between Multiple Solid Malignancies: breast, Colorectal, Lung, Ovarian and Oral Cancer. Int. J. Nanomedicine. 2019, 14, 6165–6178. doi:https://doi.org/10.2147/ijn.S198684
- Toraman, S.; Girgin, M.; Üstündağ, B.; Türkoğlu, İ. Classification of the Likelihood of Colon Cancer with Machine Learning Techniques Using FTIR Signals Obtained from Plasma. Turk. J. Elec. Eng. & Comp. Sci. 2019, 27, 1765–1779. doi:https://doi.org/10.3906/elk-1801-259
- Kuepper, C.; Großerueschkamp, F.; Kallenbach-Thieltges, A.; Mosig, A.; Tannapfel, A.; Gerwert, K. Label-Free Classification of Colon Cancer Grading Using Infrared Spectral Histopathology. Faraday Discuss. 2016, 187, 105–118. doi:https://doi.org/10.1039/c5fd00157a
- Petersen, D.; Naveed, P.; Ragheb, A.; Niedieker, D.; El-Mashtoly, S. F.; Brechmann, T.; Kötting, C.; Schmiegel, W. H.; Freier, E.; Pox, C.; et al. Raman Fiber-Optical Method for Colon Cancer Detection: Cross-Validation and Outlier Identification Approach. Spectrochim. Acta. A. Mol. Biomol. Spectrosc. 2017, 181, 270–275. doi:https://doi.org/10.1016/j.saa.2017.03.054
- Bahreini, M.; Hosseinzadegan, A.; Rashidi, A.; Miri, S. R.; Mirzaei, H. R.; Hajian, P. A Raman-Based Serum Constituents' Analysis for Gastric Cancer Diagnosis: In Vitro Study. Talanta 2019, 204, 826–832. doi:https://doi.org/10.1016/j.talanta.2019.06.068
- Li, X.; Yang, T.; Li, S.; Wang, D.; Song, Y.; Yu, K. Different Classification Algorithms and Serum Surface Enhanced Raman Spectroscopy for Noninvasive Discrimination of Gastric Diseases. J. Raman Spectrosc. 2016, 47, 917–925. doi:https://doi.org/10.1002/jrs.4924
- Chen, Y.; Cheng, S.; Zhang, A.; Song, J.; Chang, J.; Wang, K.; Zhang, Y.; Li, S.; Liu, H.; Alfranca, G.; et al. Salivary Analysis Based on Surface Enhanced Raman Scattering Sensors Distinguishes Early and Advanced Gastric Cancer Patients from Healthy Persons. J. Biomed. Nanotechnol. 2018, 14, 1773–1784. doi:https://doi.org/10.1166/jbn.2018.2621
- Guleken, Z.; Bulut, H.; Gültekin, G. İ.; Arıkan, S.; Yaylım, İ.; Hakan, M. T.; Sönmez, D.; Tarhan, N.; Depciuch, J. Assessment of Structural Protein Expression by FTIR and Biochemical Assays as Biomarkers of Metabolites Response in Gastric and Colon Cancer. Talanta 2021, 231, 122353. doi:https://doi.org/10.1016/j.talanta.2021.122353
- Liu, H.; Su, Q.; Sheng, D.; Zheng, W.; Wang, X. Comparison of Red Blood Cells from Gastric Cancer Patients and Healthy Persons Using FTIR Spectroscopy. J. Mol. Struct. 2017, 1130, 33–37. doi:https://doi.org/10.1016/j.molstruc.2016.10.019
- Ghassemi, M.; Barzegari, S.; Hajian, P.; Zham, H.; Mirzaei, H. R.; Shirazi, F. H. Diagnosis of Normal and Malignant Human Gastric Tissue Samples by FTIR Spectra Combined with Mathematical Models. J. Mol. Struct. 2021, 1229, 129493.
- Lin, K.; Wang, J.; Zheng, W.; Ho, K. Y.; Teh, M.; Yeoh, K. G.; Huang, Z. Rapid Fiber-Optic Raman Spectroscopy for Real-Time in Vivo Detection of Gastric Intestinal Metaplasia during Clinical Gastroscopy. Cancer Prev Res (Phila). 2016, 9, 476–483. doi:https://doi.org/10.1158/1940-6207.CAPR-15-0213
- Shrivastava, A.; Aggarwal, L. M.; Krishna, C. M.; Pradhan, S.; Mishra, S. P.; Choudhary, S.; Patel, C. B.; Singla, S.; Singh, R. K. Diagnostic and Prognostic Application of Raman Spectroscopy in Carcinoma Cervix: A Biomolecular Approach. Spectrochim. Acta, Part A. 2021, 250, 119356.
- Lu, D.; Ran, M.; Liu, Y.; Xia, J.; Bi, L.; Cao, X. SERS Spectroscopy Using Au-Ag Nanoshuttles and Hydrophobic Paper-Based Au Nanoflower Substrate for Simultaneous Detection of Dual Cervical Cancer-Associated Serum Biomarkers. Anal. Bioanal. Chem. 2020, 412, 7099–7112. doi:https://doi.org/10.1007/s00216-020-02843-x
- Karunakaran, V.; Saritha, V. N.; Joseph, M. M.; Nair, J. B.; Saranya, G.; Raghu, K. G.; Sujathan, K.; Kumar, K. S.; Maiti, K. K. Diagnostic Spectro-Cytology Revealing Differential Recognition of Cervical Cancer Lesions by Label-Free Surface Enhanced Raman Fingerprints and Chemometrics. Nanomedicine 2020, 29, 102276. doi:https://doi.org/10.1016/j.nano.2020.102276
- Traynor, D.; Duraipandian, S.; Bhatia, R.; Cuschieri, K.; Martin, C. M.; O'Leary, J. J.; Lyng, F. M. The Potential of Biobanked Liquid Based Cytology Samples for Cervical Cancer Screening Using Raman Spectroscopy. J. Biophotonics. 2019, 12, e201800377. doi:https://doi.org/10.1002/jbio.201800377
- Jusman, Y.; Isa, N. A. M.; Ng, S.-C.; Hasikin, K.; Osman, N. A. A. Automated Cervical Precancerous Cells Screening System Based on Fourier Transform Infrared Spectroscopy Features. J. Biomed. Opt. 2016, 21, 75005. doi:https://doi.org/10.1117/1.JBO.21.7.075005
- Ramos, I. R.; Meade, A. D.; Ibrahim, O.; Byrne, H. J.; McMenamin, M.; McKenna, M.; Malkin, A.; Lyng, F. M. Raman Spectroscopy for Cytopathology of Exfoliated Cervical Cells. Faraday Discuss. 2016, 187, 187–198. doi:https://doi.org/10.1039/c5fd00197h
- Wang, J.; Zheng, C. X.; Ma, C. L.; et al. Raman Spectroscopic Study of Cervical Precancerous Lesions and Cervical Cancer. Lasers Med. Sci. 2021, 1–10. doi:https://doi.org/10.1007/s10103-020-03218-5
- Zhang, H.; Cheng, C.; Gao, R.; Yan, Z.; Zhu, Z.; Yang, B.; Chen, C.; Lv, X.; Li, H.; Huang, Z. Rapid Identification of Cervical Adenocarcinoma and Cervical Squamous Cell Carcinoma Tissue Based on Raman Spectroscopy Combined with Multiple Machine Learning Algorithms. Photodiagnosis Photodyn. Ther. 2021, 33, 102104. doi:https://doi.org/10.1016/j.pdpdt.2020.102104
- Zheng, C.; Qing, S.; Wang, J.; Lü, G.; Li, H.; Lü, X.; Ma, C.; Tang, J.; Yue, X. Diagnosis of Cervical Squamous Cell Carcinoma and Cervical Adenocarcinoma Based on Raman Spectroscopy and Support Vector Machine. Photodiagnosis Photodyn. Ther. 2019, 27, 156–161. doi:https://doi.org/10.1016/j.pdpdt.2019.05.029
- Daniel, A.; Prakasarao, A.; Ganesan, S. Near-Infrared Raman Spectroscopy for Estimating Biochemical Changes Associated with Different Pathological Conditions of Cervix. Spectrochim. Acta. A. Mol. Biomol. Spectrosc. 2018, 190, 409–416. doi:https://doi.org/10.1016/j.saa.2017.09.014
- Daniel, A.; Prakasarao, A.; Dornadula, K.; Ganesan, S. Polarized Raman Spectroscopy Unravels the Biomolecular Structural Changes in Cervical Cancer. Spectrochim. Acta A. Mol. Biomol. Spectrosc. 2016, 152, 58–63. doi:https://doi.org/10.1016/j.saa.2015.06.053
- Paraskevaidi, M.; Morais, C. L. M.; Ashton, K. M.; Stringfellow, H. F.; McVey, R. J.; Ryan, N. A. J.; O’Flynn, H.; Sivalingam, V. N.; Kitson, S. J.; MacKintosh, M. L.; et al. Detecting Endometrial Cancer by Blood Spectroscopy: A Diagnostic Cross-Sectional Study. Cancers 2020, 12, 1256. doi:https://doi.org/10.3390/cancers12051256
- Perumal, J.; Mahyuddin, A.; Balasundaram, G.; Goh, D.; Fu, C. Y.; Kazakeviciute, A.; Dinish, U. S.; Choolani, M.; Olivo, M. SERS-Based Detection of Haptoglobin in Ovarian Cyst Fluid as a Point-of-Care Diagnostic Assay for Epithelial Ovarian Cancer. CMAR. 2019, 11, 1115–1124. doi:https://doi.org/10.2147/CMAR.S185375
- Paraskevaidi, M.; Ashton, K. M.; Stringfellow, H. F.; Wood, N. J.; Keating, P. J.; Rowbottom, A. W.; Martin-Hirsch, P. L.; Martin, F. L. Raman Spectroscopic Techniques to Detect Ovarian Cancer Biomarkers in Blood Plasma. Talanta 2018, 189, 281–288. doi:https://doi.org/10.1016/j.talanta.2018.06.084
- Theophilou, G.; Lima, K. M. G.; Martin-Hirsch, P. L.; Stringfellow, H. F.; Martin, F. L. ATR-FTIR Spectroscopy Coupled with Chemometric Analysis Discriminates Normal, Borderline and Malignant Ovarian Tissue: classifying Subtypes of Human Cancer. Analyst 2016, 141, 585–594. doi:https://doi.org/10.1039/C5AN00939A
- Sahu, A. K.; Dhoot, S.; Singh, A.; Sawant, S. S.; Nandakumar, N.; Talathi-Desai, S.; Garud, M.; Pagare, S.; Srivastava, S.; Nair, S.; et al. Oral Cancer Screening: serum Raman Spectroscopic Approach. J. Biomed. Opt. 2015, 20, 115006. doi:https://doi.org/10.1117/1.JBO.20.11.115006
- Yan, B.; Li, B.; Wen, Z.; Luo, X.; Xue, L.; Li, L. Label-Free Blood Serum Detection by Using Surface-Enhanced Raman Spectroscopy and Support Vector Machine for the Preoperative Diagnosis of Parotid Gland Tumors. BMC Cancer 2015, 15, 1–9. doi:https://doi.org/10.1186/s12885-015-1653-7
- Tan, Y.; Yan, B.; Xue, L.; Li, Y.; Luo, X.; Ji, P. Surface-Enhanced Raman Spectroscopy of Blood Serum Based on Gold Nanoparticles for the Diagnosis of the Oral Squamous Cell Carcinoma. Lipids Health Dis. 2017, 16, 1–9. doi:https://doi.org/10.1186/s12944-017-0465-y
- Xue, L.; Yan, B.; Li, Y.; Tan, Y.; Luo, X.; Wang, M. Surface-Enhanced Raman Spectroscopy of Blood Serum Based on Gold Nanoparticles for Tumor Stages Detection and Histologic Grades Classification of Oral Squamous Cell Carcinoma. Int. J. Nanomedicine. 2018, 13, 4977–4986. doi:https://doi.org/10.2147/IJN.S167996
- Lin, H.; Zhou, J.; Wu, Q.; Hung, T.-M.; Chen, W.; Yu, Y.; Chang, J. T.-C.; Pan, J.; Qiu, S.; Chen, R. Human Blood Test Based on Surface-Enhanced Raman Spectroscopy Technology Using Different Excitation Light for Nasopharyngeal Cancer Detection. IET Nanobiotechnol. 2019, 13, 942–945. doi:https://doi.org/10.1049/iet-nbt.2019.0221
- Liang, X.; Miao, X.; Xiao, W.; Ye, Q.; Wang, S.; Lin, J.; Li, C.; Huang, Z. Filter-Membrane-Based Ultrafiltration Coupled with Surface-Enhanced Raman Spectroscopy for Potential Differentiation of Benign and Malignant Thyroid Tumors from Blood Plasma. Int. J. Nanomedicine. 2020, 15, 2303–2314. doi:https://doi.org/10.2147/IJN.S233663
- Adeeba; Siddiqui, A. J.; Sherazi, S. T.; Ahmed, S.; Choudhary, M. I.; Rahman, A.; Musharraf, S. G. A Comparative Profiling of Oral Cancer Patients and High Risk Niswar Users Using FT-IR and Chemometric Analysis. Spectrochim. Acta. Part A: Mol. Biomol. Spectrosc. 2018, 203, 177–184. doi:https://doi.org/10.1016/j.saa.2018.05.107
- Brindha, E.; Rajasekaran, R.; Aruna, P.; Koteeswaran, D.; Ganesan, S. High Wavenumber Raman Spectroscopy in the Characterization of Urinary Metabolites of Normal Subjects, Oral Premalignant and Malignant Patients. Spectrochim. Acta A. Mol. Biomol. Spectrosc. 2017, 171, 52–59. doi:https://doi.org/10.1016/j.saa.2016.06.048
- Sahu, A.; Gera, P.; Pai, V.; Dubey, A.; Tyagi, G.; Waghmare, M.; Pagare, S.; Mahimkar, M.; Murali Krishna, C. Raman Exfoliative Cytology for Oral Precancer Diagnosis. J. Biomed. Opt. 2017, 22, 1–12. doi:https://doi.org/10.1117/1.JBO.22.11.115003
- Sarkar, R.; Chatterjee, K.; Ojha, D.; Chakraborty, B.; Sengupta, S.; Chattopadhyay, D.; RoyChaudhuri, C.; Barui, A. Liaison between Heme Metabolism and Bioenergetics Pathways-a Multimodal Elucidation for Early Diagnosis of Oral Cancer. Photodiagn. Photodyn. Ther. 2018, 21, 263–274. doi:https://doi.org/10.1016/j.pdpdt.2018.01.002
- Sun, L.; Xu, Z.; Huang, W.; Wu, S.; Lin, X.; Zhu, F.; Liu, N.; Huang, M.; Chen, R.; Zeng, H. Preliminary Study of Differentiating Smears from Cancerous and Non-Cancerous Nasopharyngeal Tissue Using Confocal Raman Spectroscopy. J. Cancer Res. Clin. Oncol. 2016, 142, 823–831. doi:https://doi.org/10.1007/s00432-015-2082-3
- Jeng, M.-J.; Sharma, M.; Sharma, L.; Huang, S.-F.; Chang, L.-B.; Wu, S.-L.; Chow, L. Novel Quantitative Analysis Using Optical Imaging (VELscope) and Spectroscopy (Raman) Techniques for Oral Cancer Detection. Cancers 2020, 12, 3364. doi:https://doi.org/10.3390/cancers12113364
- Vohra, P.; Strobbia, P.; Ngo, H.; Lee, W.; Vo-Dinh, T. Rapid Nanophotonics Assay for Head and Neck Cancer Diagnosis. Sci. Rep. 2018, 8, 1–7. doi:https://doi.org/10.1038/s41598-018-29428-0
- Chundayil Madathil, G.; Iyer, S.; Thankappan, K.; Gowd, G. S.; Nair, S.; Koyakutty, M. A Novel Surface Enhanced Raman Catheter for Rapid Detection, Classification, and Grading of Oral Cancer. Adv. Healthcare Mater. 2019, 8, 1801557. doi:https://doi.org/10.1002/adhm.201801557
- Hoesli, R. C.; Orringer, D. A.; McHugh, J. B.; Spector, M. E. Coherent Raman Scattering Microscopy for Evaluation of Head and Neck Carcinoma. Otolaryngol. Head Neck Surg. 2017, 157, 448–453. doi:https://doi.org/10.1177/0194599817700388
- Malik, A.; Sahu, A.; Singh, S. P.; Deshmukh, A.; Chaturvedi, P.; Nair, D.; Nair, S.; Murali Krishna, C. In Vivo Raman Spectroscopy-Assisted Early Identification of Potential Second Primary/Recurrences in Oral Cancers: An Exploratory Study. Head Neck. 2017, 39, 2216–2223. doi:https://doi.org/10.1002/hed.24884
- Bhattacharjee, A.; Hole, A.; Malik, A.; Sahu, A.; Singh, S. P.; Deshmukh, A.; Nair, S.; Chaturvedi, P.; Krishna, C. M. Risk Prediction by Raman Spectroscopy for Disease-Free Survival in Oral Cancers. Lasers Med. Sci. 2021, 1–10.
- He, C.; Wu, X.; Zhou, J.; Chen, Y.; Ye, J. Raman Optical Identification of Renal Cell Carcinoma via Machine Learning. Spectrochim. Acta A. Mol. Biomol. Spectrosc. 2021, 252, 119520. doi:https://doi.org/10.1016/j.saa.2021.119520
- Liu, Y.; Du, Z.; Zhang, J.; Jiang, H. Renal Mass Biopsy Using Raman Spectroscopy Identifies Malignant and Benign Renal Tumors: potential for Pre-Operative Diagnosis. Oncotarget 2017, 8, 36012–36019. doi:https://doi.org/10.18632/oncotarget.16419
- Mert, S.; Özbek, E.; Ötünçtemur, A.; Çulha, M. Kidney Tumor Staging Using Surface-Enhanced Raman Scattering. J. Biomed. Opt. 2015, 20, 047002. doi:https://doi.org/10.1117/1.JBO.20.4.047002
- Sablinskas, V.; Bandzeviciute, R.; Velicka, M.; Ceponkus, J.; Urboniene, V.; Jankevicius, F.; Laurinavičius, A.; Dasevičius, D.; Steiner, G. Fiber Attenuated Total Reflection Infrared Spectroscopy of Kidney Tissue during Live Surgery. J. Biophotonics. 2020, 13, e202000018. doi:https://doi.org/10.1002/jbio.202000018
- Bai, Y.; Yu, Z.; Yi, S.; Yan, Y.; Huang, Z.; Qiu, L. Raman Spectroscopy-Based Biomarker Screening by Studying the Fingerprint Characteristics of Chronic Lymphocytic Leukemia and Diffuse Large B-Cell Lymphoma. J. Pharm. Biomed. Anal. 2020, 190, 113514. doi:https://doi.org/10.1016/j.jpba.2020.113514
- Féré, M.; Gobinet, C.; Liu, L. H.; Beljebbar, A.; Untereiner, V.; Gheldof, D.; Chollat, M.; Klossa, J.; Chatelain, B.; Piot, O. Implementation of a Classification Strategy of Raman Data Collected in Different Clinical Conditions: application to the Diagnosis of Chronic Lymphocytic Leukemia. Anal. Bioanal. Chem. 2020, 412, 949–962. doi:https://doi.org/10.1007/s00216-019-02321-z
- Li, X.; Yang, T.; Li, S.; Jin, L.; Wang, D.; Guan, D.; Ding, J. Noninvasive Liver Diseases Detection Based on Serum Surface Enhanced Raman Spectroscopy and Statistical Analysis. Opt. Express. 2015, 23, 18361–18372. doi:https://doi.org/10.1364/OE.23.018361
- Yu, Y.; Lin, Y.; Xu, C.; Lin, K.; Ye, Q.; Wang, X.; Xie, S.; Chen, R.; Lin, J. Label-Free Detection of Nasopharyngeal and Liver Cancer Using Surface-Enhanced Raman Spectroscopy and Partial Lease Squares Combined with Support Vector Machine. Biomed. Opt. Express. 2018, 9, 6053–6066. doi:https://doi.org/10.1364/BOE.9.006053
- Zhang, K.; Hao, C.; Man, B.; Zhang, C.; Yang, C.; Liu, M.; Peng, Q.; Chen, C. Diagnosis of Liver Cancer Based on Tissue Slice Surface Enhanced Raman Spectroscopy and Multivariate Analysis. Vib. Spectrosc 2018, 98, 82–87. doi:https://doi.org/10.1016/j.vibspec.2018.07.010
- Qian, K.; Wang, Y.; Hua, L.; Chen, A.; Zhang, Y. New Method of Lung Cancer Detection by Saliva Test Using Surface‐Enhanced Raman Spectroscopy. Thorac. Cancer. 2018, 9, 1556–1561. doi:https://doi.org/10.1111/1759-7714.12837
- Xiao, R.; Zhang, X.; Rong, Z.; Xiu, B.; Yang, X.; Wang, C.; Hao, W.; Zhang, Q.; Liu, Z.; Duan, C.; et al. Non-Invasive Detection of Hepatocellular Carcinoma Serum Metabolic Profile through Surface-Enhanced Raman Spectroscopy. Nanomed. Nanotechnol. Biol. Med. 2016, 12, 2475–2484. doi:https://doi.org/10.1016/j.nano.2016.07.014
- Bangaoil, R.; Santillan, A.; Angeles, L. M.; Abanilla, L.; Lim, A.; Ramos, M. C.; Fellizar, A.; Guevarra, L.; Albano, P. M. ATR-FTIR Spectroscopy as Adjunct Method to the Microscopic Examination of Hematoxylin and Eosin-Stained Tissues in Diagnosing Lung Cancer. PloS One 2020, 15, e0233626. doi:https://doi.org/10.1371/journal.pone.0233626
- Weng, S.; Xu, X.; Li, J.; Wong, S. T. Combining Deep Learning and Coherent anti-Stokes Raman Scattering Imaging for Automated Differential Diagnosis of Lung Cancer. J. Biomed. Opt. 2017, 22, 1–10. doi:https://doi.org/10.1117/1.JBO.22.10.106017
- McGregor, H. C.; Short, M. A.; McWilliams, A.; Shaipanich, T.; Ionescu, D. N.; Zhao, J.; Wang, W.; Chen, G.; Lam, S.; Zeng, H. Real-Time Endoscopic Raman Spectroscopy for in Vivo Early Lung Cancer Detection. J. Biophotonics. 2017, 10, 98–110. doi:https://doi.org/10.1002/jbio.201500204
- Akalin, A.; Mu, X.; Kon, M. A.; Ergin, A.; Remiszewski, S. H.; Thompson, C. M.; Raz, D. J.; Diem, M. Classification of Malignant and Benign Tumors of the Lung by Infrared Spectral Histopathology (SHP). Lab. Invest. 2015, 95, 406–421. doi:https://doi.org/10.1038/labinvest.2015.1
- Großerueschkamp, F.; Kallenbach-Thieltges, A.; Behrens, T.; Brüning, T.; Altmayer, M.; Stamatis, G.; Theegarten, D.; Gerwert, K. Marker-Free Automated Histopathological Annotation of Lung Tumour Subtypes by FTIR Imaging. Analyst 2015, 140, 2114–2120. doi:https://doi.org/10.1039/C4AN01978D
- Maitra, I.; Morais, C. L. M.; Lima, K. M. G.; Ashton, K. M.; Date, R. S.; Martin, F. L. Attenuated Total Reflection Fourier-Transform Infrared Spectral Discrimination in Human Bodily Fluids of Oesophageal Transformation to Adenocarcinoma. Analyst 2019, 144, 7447–7456. doi:https://doi.org/10.1039/c9an01749f
- Maitra, I.; Morais, C. L. M.; Lima, K. M. G.; Ashton, K. M.; Date, R. S.; Martin, F. L. Raman Spectral Discrimination in Human Liquid Biopsies of Oesophageal Transformation to Adenocarcinoma. J. Biophotonics. 2020, 13, e201960132. doi:https://doi.org/10.1002/jbio.201960132
- Feng, S.; Zheng, Z.; Xu, Y.; Lin, J.; Chen, G.; Weng, C.; Lin, D.; Qiu, S.; Cheng, M.; Huang, Z.; et al. A Noninvasive Cancer Detection Strategy Based on Gold Nanoparticle Surface-Enhanced Raman Spectroscopy of Urinary Modified Nucleosides Isolated by Affinity Chromatography. Biosens. Bioelectron 2017, 91, 616–622. doi:https://doi.org/10.1016/j.bios.2017.01.006
- Wu, Q.; Li, C.; Qi, Z.; Zong, L.; Hu, C.; Li, J.; Wang, X. Comparison of Hair Medulla from Esophageal Cancer Patients and Healthy Persons Using Synchrotron Radiation Infrared Microspectroscopy. Infrared Phys. Technol. 2020, 105, 103201. doi:https://doi.org/10.1016/j.infrared.2020.103201
- Maitra, I.; Morais, C. L. M.; Lima, K. M. G.; Ashton, K. M.; Bury, D.; Date, R. S.; Martin, F. L. Discrimination of Oesophageal Transformation Stages to Adenocarcinoma in Human Tissue Samples Using Raman Microspectroscopy. Vib. Spectrosc. 2020, 111, 103141. doi:https://doi.org/10.1016/j.vibspec.2020.103141
- Ishigaki, M.; Maeda, Y.; Taketani, A.; Andriana, B. B.; Ishihara, R.; Wongravee, K.; Ozaki, Y.; Sato, H. Diagnosis of Early-Stage Esophageal Cancer by Raman Spectroscopy and Chemometric Techniques. Analyst 2016, 141, 1027–1033. doi:https://doi.org/10.1039/c5an01323b
- Wang, J.; Lin, K.; Zheng, W.; Yu Ho, K.; Teh, M.; Guan Yeoh, K.; Huang, Z. Simultaneous Fingerprint and High-Wavenumber Fiber-Optic Raman Spectroscopy Improves in Vivo Diagnosis of Esophageal Squamous Cell Carcinoma at Endoscopy. Sci. Rep. 2015, 5, 1–10. doi:https://doi.org/10.1038/srep12957
- Wald, N.; Goormaghtigh, E. Infrared Imaging of Primary Melanomas Reveals Hints of Regional and Distant Metastases. Analyst 2015, 140, 2144–2155. doi:https://doi.org/10.1039/c4an01831a
- Schleusener, J.; Gluszczynska, P.; Reble, C.; Gersonde, I.; Helfmann, J.; Fluhr, J. W.; Lademann, J.; Röwert-Huber, J.; Patzelt, A.; Meinke, M. C. In Vivo Study for the Discrimination of Cancerous and Normal Skin Using Fibre Probe-Based Raman Spectroscopy. Exp. Dermatol. 2015, 24, 767–772. doi:https://doi.org/10.1111/exd.12768
- Zhao, J.; Lui, H.; Kalia, S.; Zeng, H. Real-Time Raman Spectroscopy for Automatic in Vivo Skin Cancer Detection: An Independent Validation. Anal. Bioanal. Chem. 2015, 407, 8373–8379. doi:https://doi.org/10.1007/s00216-015-8914-9
- Zhao, J.; Zeng, H.; Kalia, S.; Lui, H. Wavenumber Selection Based Analysis in Raman Spectroscopy Improves Skin Cancer Diagnostic Specificity. Analyst 2016, 141, 1034–1043. doi:https://doi.org/10.1039/c5an02073e
- Santos, I. P.; van Doorn, R.; Caspers, P. J.; Schut, T. C.; Barroso, E. M.; Nijsten, T. E.; Hegt, V. N.; Koljenović, S.; Puppels, G. J. Improving Clinical Diagnosis of Early-Stage Cutaneous Melanoma Based on Raman Spectroscopy. Br. J. Cancer 2018, 119, 1339–1346.
- Feng, X.; Moy, A. J.; Nguyen, H. T. M.; Zhang, Y.; Zhang, J.; Fox, M. C.; Sebastian, K. R.; Reichenberg, J. S.; Markey, M. K.; Tunnell, J. W. Raman Biophysical Markers in Skin Cancer Diagnosis. J. Biomed. Opt. 2018, 23, 1–10. doi:https://doi.org/10.1117/1.JBO.23.5.057002
- Medipally, D. K. R.; Cullen, D.; Untereiner, V.; Sockalingum, G. D.; Maguire, A.; Nguyen, T. N. Q.; Bryant, J.; Noone, E.; Bradshaw, S.; Finn, M.; et al. Vibrational Spectroscopy of Liquid Biopsies for Prostate Cancer Diagnosis. Ther. Adv. Med. Oncol. 2020, 12, 1758835920918499. doi:https://doi.org/10.1177/1758835920918499
- Medipally, D. K. R.; Nguyen, T. N. Q.; Bryant, J.; Untereiner, V.; Sockalingum, G. D.; Cullen, D.; Noone, E.; Bradshaw, S.; Finn, M.; Dunne, M.; et al. Monitoring Radiotherapeutic Response in Prostate Cancer Patients Using High Throughput FTIR Spectroscopy of Liquid Biopsies. Cancers 2019, 11, 925. doi:https://doi.org/10.3390/cancers11070925
- Naseer, K.; Saleem, M.; Qazi, J. Optical Diagnosis of Typhoid Infection in Human Blood Sera Using Raman Spectroscopy. Spectrosc. Lett. 2020, 53, 249–255. doi:https://doi.org/10.1080/00387010.2020.1734841
- Yunanto, A.; Utama, A. A.; Muthmainnah, N.; Suhartono, E. Early detection of neonatal sepsis using fourier transformation infrared spectroscopy (FTIR). in AIP Conference Proceedings. Jun 4, 2019 Jun 4; (Vol. 2108, No. 1, p. 020026) (AIP Publishing LLC). DOI: https://doi.org/10.1063/1.5110001
- Tien, N.; Lin, T.-H.; Hung, Z.-C.; Lin, H.-S.; Wang, I.-K.; Chen, H.-C.; Chang, C.-T. Diagnosis of Bacterial Pathogens in the Urine of Urinary-Tract-Infection Patients Using Surface-Enhanced Raman Spectroscopy. Molecules 2018, 23, 3374. doi:https://doi.org/10.3390/molecules23123374
- Agbaria, A. H.; Beck, G.; Lapidot, I.; Rich, D. H.; Kapelushnik, J.; Mordechai, S.; Salman, A.; Huleihel, M. Diagnosis of Inaccessible Infections Using Infrared Microscopy of White Blood Cells and Machine Learning Algorithms. Analyst 2020, 145, 6955–6967. doi:https://doi.org/10.1039/D0AN00752H
- Dinkelacker, A. G.; Vogt, S.; Oberhettinger, P.; Mauder, N.; Rau, J.; Kostrzewa, M.; Rossen, J. W. A.; Autenrieth, I. B.; Peter, S.; Liese, J.; et al. Typing and Species Identification of Clinical Klebsiella Isolates by Fourier Transform Infrared Spectroscopy and Matrix-Assisted Laser Desorption Ionization–Time of Flight Mass Spectrometry. J. Clin. Microbiol. 2018, 56, e00843-18. doi:https://doi.org/10.1128/JCM.00843-18
- Wohlmeister, D.; Vianna, D. R. B.; Helfer, V. E.; Calil, L. N.; Buffon, A.; Fuentefria, A. M.; Corbellini, V. A.; Pilger, D. A. Differentiation of Candida albicans, Candida glabrata, and Candida krusei by FT-IR and Chemometrics by CHROMagar™ Candida. J. Microbiol. Methods. 2017, 141, 121–125. doi:https://doi.org/10.1016/j.mimet.2017.08.013
- Silva, S.; Tobaldini-Valerio, F.; Costa-de-Oliveira, S.; Henriques, M.; Azeredo, J.; Ferreira, E. C.; Lopes, J. A.; Sousa, C. Discrimination of Clinically Relevant Candida Species by Fourier-Transform Infrared Spectroscopy with Attenuated Total Reflectance (FTIR-ATR). RSC Adv. 2016, 6, 92065–92072. doi:https://doi.org/10.1039/C6RA16769A
- Kourkoumelis, N.; Gaitanis, G.; Velegraki, A.; Bassukas, I. D. Nail Raman Spectroscopy: A Promising Method for the Diagnosis of Onychomycosis. An Ex Vivo Pilot Study. Med. Mycol. 2018, 56, 551–558. doi:https://doi.org/10.1093/mmy/myx078
- Heraud, P.; Chatchawal, P.; Wongwattanakul, M.; Tippayawat, P.; Doerig, C.; Jearanaikoon, P.; Perez-Guaita, D.; Wood, B. R. Infrared Spectroscopy Coupled to Cloud-Based Data Management as a Tool to Diagnose Malaria: A Pilot Study in a Malaria-Endemic Country. Malar. J. 2019, 18, 348. doi:https://doi.org/10.1186/s12936-019-2945-1
- Mwanga, E. P.; Minja, E. G.; Mrimi, E.; Jiménez, M. G.; Swai, J. K.; Abbasi, S.; Ngowo, H. S.; Siria, D. J.; Mapua, S.; Stica, C.; et al. Detection of Malaria Parasites in Dried Human Blood Spots Using Mid-Infrared Spectroscopy and Logistic Regression Analysis . Malar. J. 2019, 18, 341. doi:https://doi.org/10.1186/s12936-019-2982-9
- Khan, S.; Ullah, R.; Saleem, M.; Bilal, M.; Rashid, R.; Khan, I.; Mahmood, A.; Nawaz, M. Raman Spectroscopic Analysis of Dengue Virus Infection in Human Blood Sera. Optik 2016, 127, 2086–2088. doi:https://doi.org/10.1016/j.ijleo.2015.11.060
- Khan, S.; Ullah, R.; Khan, A.; Wahab, N.; Bilal, M.; Ahmed, M. Analysis of Dengue Infection Based on Raman Spectroscopy and Support Vector Machine (SVM)). Biomed. Opt. Express. 2016, 7, 2249–2256. doi:https://doi.org/10.1364/BOE.7.002249
- Khurram, M.; Khan, S.; Ali, H.; Ullah, R.; Khan, A.; Mahmood, A.; Ahmed, M. Evaluation of Raman Spectroscopy in Comparison to Commonly Performed Dengue Diagnostic Tests. J. Biomed. Opt. 2016, 21, 95005. doi:https://doi.org/10.1117/1.JBO.21.9.095005
- Amin, A.; Ghouri, N.; Ali, S.; Ahmed, M.; Saleem, M.; Qazi, J. Identification of New Spectral Signatures Associated with Dengue Virus Infected Sera. J. Raman Spectrosc. 2017, 48, 705–710. doi:https://doi.org/10.1002/jrs.5110
- Khan, S.; Ullah, R.; Khan, A.; Sohail, A.; Wahab, N.; Bilal, M.; Ahmed, M. Random Forest-Based Evaluation of Raman Spectroscopy for Dengue Fever Analysis. Appl. Spectrosc. 2017, 71, 2111–2117. doi:https://doi.org/10.1177/0003702817695571
- Santos, M. C. D.; Nascimento, Y. M.; Monteiro, J. D.; Alves, B. E. B.; Melo, M. F.; Paiva, A. A. P.; Pereira, H. W. B.; Medeiros, L. G.; Morais, I. C.; Fagundes Neto, J. C.; et al. ATR-FTIR Spectroscopy with Chemometric Algorithms of Multivariate Classification in the Discrimination between Healthy vs. dengue vs. chikungunya vs. zika Clinical Samples. Anal. Methods 2018, 10, 1280–1285. doi:https://doi.org/10.1039/C8AY90116C
- Patel, S. K.; Rajora, N.; Kumar, S.; Sahu, A.; Kochar, S. K.; Krishna, C. M.; Srivastava, S. Rapid Discrimination of Malaria- and Dengue-Infected Patients Sera Using Raman Spectroscopy. Anal. Chem. 2019, 91, 7054–7062. doi:https://doi.org/10.1021/acs.analchem.8b05907
- Sohail, A.; Khan, S.; Ullah, R.; Qureshi, S. A.; Bilal, M.; Khan, A. Analysis of Hepatitis C Infection Using Raman Spectroscopy and Proximity Based Classification in the Transformed Domain. Biomed. Opt. Express. 2018, 9, 2041–2055. doi:https://doi.org/10.1364/BOE.9.002041
- Khan, S.; Ullah, R.; Khan, A.; Ashraf, R.; Ali, H.; Bilal, M.; Saleem, M. Analysis of Hepatitis B Virus Infection in Blood Sera Using Raman Spectroscopy and Machine Learning. Photodiagnosis Photodyn. Ther. 2018, 23, 89–93. doi:https://doi.org/10.1016/j.pdpdt.2018.05.010
- Roy, S.; Perez-Guaita, D.; Bowden, S.; Heraud, P.; Wood, B. R. Spectroscopy Goes Viral: Diagnosis of Hepatitis B and C Virus Infection from Human Sera Using ATR-FTIR Spectroscopy. Clin. Spectrosc. 2019, 1, 100001. doi:https://doi.org/10.1016/j.clispe.2020.100001
- Tong, D.; Chen, C.; Zhang, J.; Lv, G.; Zheng, X.; Zhang, Z.; Lv, X. Application of Raman Spectroscopy in the Detection of Hepatitis B Virus Infection. Photodiagnosis Photodyn. Ther. 2019, 28, 248–252. doi:https://doi.org/10.1016/j.pdpdt.2019.08.006
- Lu, H.; Tian, S.; Yu, L.; Lv, X.; Chen, S. Diagnosis of Hepatitis B Based on Raman Spectroscopy Combined with a Multiscale Convolutional Neural Network. Vib. Spectrosc. 2020, 107, 103038. doi:https://doi.org/10.1016/j.vibspec.2020.103038
- Sebba, D.; Lastovich, A. G.; Kuroda, M.; Fallows, E.; Johnson, J.; Ahouidi, A.; Honko, A. N.; Fu, H.; Nielson, R.; Carruthers, E.; et al. A Point-of-Care Diagnostic for Differentiating Ebola from Endemic Febrile Diseases. Sci. Transl. Med. 2018, 10, eaat0944. doi:https://doi.org/10.1126/scitranslmed.aat0944
- Silva, L. G.; Péres, A. F. S.; Freitas, D. L. D.; Morais, C. L. M.; Martin, F. L.; Crispim, J. C. O.; Lima, K. M. G. ATR-FTIR Spectroscopy in Blood Plasma Combined with Multivariate Analysis to Detect HIV Infection in Pregnant Women. Sci. Rep. 2020, 10, 1–7. doi:https://doi.org/10.1038/s41598-020-77378-3
- Chen, C.; Wang, J.; Chen, C.; Tang, J.; Lv, X.; Ma, C. Rapid and Efficient Screening of Human Papillomavirus by Raman Spectroscopy Based on GA-SVM. Optik 2020, 210, 164514. doi:https://doi.org/10.1016/j.ijleo.2020.164514
- Zheng, X.; Wang, J.; Yin, L.; Luo, B.; Lv, X.; Wu, G. Label-Free Detection of High-Risk Human Papillomaviruses Infection Using Raman Spectroscopy and Multivariate Analysis. Laser Phys. Lett. 2020, 17, 115601. doi:https://doi.org/10.1088/1612-202X/abafbf
- Mo, H.; Yang, L.; Wu, G.; Zheng, X.; Wang, J.; Yin, L.; Lv, X. Rapid and Non-Invasive Screening of High-Risk Human Papillomavirus Using Fourier Transform Infrared Spectroscopy and Multivariate Analysis. Optik 2020, 206, 164292. doi:https://doi.org/10.1016/j.ijleo.2020.164292
- Barauna, V. G.; Singh, M. N.; Barbosa, L. L.; Marcarini, W. D.; Vassallo, P. F.; Mill, J. G.; Ribeiro-Rodrigues, R.; Campos, L. C. G.; Warnke, P. H.; Martin, F. L. Ultrarapid on-Site Detection of SARS-CoV-2 Infection Using Simple ATR-FTIR Spectroscopy and an Analysis Algorithm: High Sensitivity and Specificity. Anal. Chem. 2021, 93, 2950–2958. doi:https://doi.org/10.1021/acs.analchem.0c04608
- Carlomagno, C.; Bertazioli, D.; Gualerzi, A.; Picciolini, S.; Banfi, P. I.; Lax, A.; Messina, E.; Navarro, J.; Bianchi, L.; Caronni, A.; et al. COVID-19 Salivary Raman Fingerprint: innovative Approach for the Detection of Current and past SARS-CoV-2 Infections. Sci. Rep. 2021, 11, 1–13. doi:https://doi.org/10.1038/s41598-021-84565-3
- Wood, B. R.; Kochan, K.; Bedolla, D. E.; Salazar-Quiroz, N.; Grimley, S.; Perez-Guaita, D.; Baker, M. J.; Vongsvivut, J.; Tobin, M.; Bambery, K.; Christensen, D.; et al. Infrared Based Saliva Screening Test for COVID‐19. Angewandte Chemie 2021, 133, 2–8.
- Simoens, S. Health Economic Assessment: A Methodological Primer. IJERPH. 2009, 6, 2950–2966. doi:https://doi.org/10.3390/ijerph6122950
- Cui, L.; Butler, H. J.; Martin-Hirsch, P. L.; Martin, F. L. Aluminium Foil as a Potential Substrate for ATR-FTIR, Transflection FTIR or Raman Spectrochemical Analysis of Biological Specimens. Anal. Methods 2016, 8, 481–487. doi:https://doi.org/10.1039/C5AY02638E
- Finlayson, D.; Rinaldi, C.; Baker, M. J. Is Infrared Spectroscopy Ready for the Clinic? Anal. Chem. 2019, 91, 12117–12128. doi:https://doi.org/10.1021/acs.analchem.9b02280
- Wilson, B. C.; Jermyn, M.; Leblond, F. Challenges and Opportunities in Clinical Translation of Biomedical Optical Spectroscopy and Imaging. J. Biomed. Opt. 2018, 23, 1–13. doi:https://doi.org/10.1117/1.JBO.23.3.030901
- Jamieson, L. E.; Byrne, H. J. Vibrational Spectroscopy as a Tool for Studying Drug-Cell Interaction: Could High Throughput Vibrational Spectroscopic Screening Improve Drug Development? Vib. Spectrosc 2017, 91, 16–30. doi:https://doi.org/10.1016/j.vibspec.2016.09.003
- Gray, E.; Butler, H. J.; Board, R.; Brennan, P. M.; Chalmers, A. J.; Dawson, T.; Goodden, J.; Hamilton, W.; Hegarty, M. G.; James, A.; et al. Health Economic Evaluation of a Serum-Based Blood Test for Brain Tumour Diagnosis: exploration of Two Clinical Scenarios. BMJ Open. 2018, 8, e017593. doi:https://doi.org/10.1136/bmjopen-2017-017593
- Gray, E.; Cameron, J. M.; Butler, H. J.; Jenkinson, M. D.; Hegarty, M. G.; Palmer, D. S.; Brennan, P. M.; Baker, M. J. Early Economic Evaluation to Guide the Development of a Spectroscopic Liquid Biopsy for the Detection of Brain cancer. Int. J. Technol. Assess. Health Care. 2021, 37, e41. doi:https://doi.org/10.1017/s0266462321000143
- Baker, M. J.; Trevisan, J.; Bassan, P.; Bhargava, R.; Butler, H. J.; Dorling, K. M.; Fielden, P. R.; Fogarty, S. W.; Fullwood, N. J.; Heys, K. A.; et al. Using Fourier Transform IR Spectroscopy to Analyze Biological Materials. Nat. Protoc. 2014, 9, 1771–1791. http://www.nature.com/nprot/journal/v9/n8/abs/nprot.2014.110.html. #supplementary-information (2014). doi:https://doi.org/10.1038/nprot110
- Morais, C. L. M.; Paraskevaidi, M.; Cui, L.; Fullwood, N. J.; Isabelle, M.; Lima, K. M. G.; Martin-Hirsch, P. L.; Sreedhar, H.; Trevisan, J.; Walsh, M. J.; et al. Standardization of Complex Biologically Derived Spectrochemical Datasets. Nat. Protoc. 2019, 14, 1546–1577. doi:https://doi.org/10.1038/s41596-019-0150-x
- Yang, H.; Yang, S.; Kong, J.; Dong, A.; Yu, S. Obtaining Information about Protein Secondary Structures in Aqueous Solution Using Fourier Transform IR Spectroscopy. Nat. Protoc. 2015, 10, 382–396. doi:https://doi.org/10.1038/nprot.2015.024
- Afara, I. O.; Shaikh, R.; Nippolainen, E.; Querido, W.; Torniainen, J.; Sarin, J. K.; Kandel, S.; Pleshko, N.; Töyräs, J. Characterization of Connective Tissues Using near-Infrared Spectroscopy and Imaging. Nat. Protoc. 2021, 16, 1297–1329. doi:https://doi.org/10.1038/s41596-020-00468-z
- Kuepper, C.; Kallenbach-Thieltges, A.; Juette, H.; Tannapfel, A.; Großerueschkamp, F.; Gerwert, K. Quantum Cascade Laser-Based Infrared Microscopy for Label-Free and Automated Cancer Classification in Tissue Sections. Sci. Rep. 2018, 8, 1–10. doi:https://doi.org/10.1038/s41598-018-26098-w
- Bassan, P.; Weida, M. J.; Rowlette, J.; Gardner, P. Large Scale Infrared Imaging of Tissue Micro Arrays (TMAs) Using a Tunable Quantum Cascade Laser (QCL) Based Microscope. Analyst 2014, 139, 3856–3859. doi:https://doi.org/10.1039/c4an00638k
- Pilling, M. J.; Henderson, A.; Gardner, P. Quantum Cascade Laser Spectral Histopathology: Breast Cancer Diagnostics Using High Throughput Chemical Imaging. Anal. Chem. 2017, 89, 7348–7355. doi:https://doi.org/10.1021/acs.analchem.7b00426
- Pilling, M. J.; Henderson, A.; Bird, B.; Brown, M. D.; Clarke, N. W.; Gardner, P. High-Throughput Quantum Cascade Laser (QCL) Spectral Histopathology: A Practical Approach towards Clinical Translation. Faraday Discuss. 2016, 187, 135–154. doi:https://doi.org/10.1039/c5fd00176e
- Stevens, O.; Petterson, I. E. I.; Day, J. C.; Stone, N. Developing Fibre Optic Raman Probes for Applications in Clinical Spectroscopy. Chem. Soc. Rev. 2016, 45, 1919–1934. doi:https://doi.org/10.1039/c5cs00850f
- Ramos, I. R. M.; Malkin, A.; Lyng, F. M. Current Advances in the Application of Raman Spectroscopy for Molecular Diagnosis of Cervical Cancer. BioMed. Res. Int. 2015, 2015, 1–9. doi:https://doi.org/10.1155/2015/561242
- Pilling, M. J.; Henderson, A.; Shanks, J. H.; Brown, M. D.; Clarke, N. W.; Gardner, P. Infrared Spectral Histopathology Using Haematoxylin and Eosin (H&E) Stained Glass Slides: A Major Step Forward towards Clinical Translation. Analyst 2017, 142, 1258–1268. doi:https://doi.org/10.1039/c6an02224c