
Abstract
This paper investigates the economic valuation of the benefits accruing to farmers derived from expected water quality improvements stemming from the adoption of best management practices (BMPs). The study applies the stated-choice experiments administered on a sample of farmers located in the Chaudière and Etchemin watersheds just south of Quebec City to characterize the preferences of farmers in terms of the mean and standard deviation of phosphorus and coliform reductions, and the costs borne by local farmers and by taxpayers in the province of Quebec to support the adoption of BMPs. The results show significant observed and unobserved heterogeneity regarding farmers’ marginal utility of phosphorus and coliform reductions. The distribution of risk attitudes encompasses all three types: risk aversion, risk neutrality and risk loving. Benefit valuation decreases with age, but the age effect is smaller than the heterogeneity across farmers of a given age. Farmers experience disutility when their own cost or taxpayers’ cost increases, but a private dollar is worth substantially more to farmers than a public one.
Cet article s’intéresse à l’évaluation économique des bénéfices des agriculteurs provenant de l’amélioration de la qualité de l’eau par l’adoption des meilleures pratiques agroenvironnementales (PAG). L’étude utilise les expériences de choix énoncés administrés sur un échantillon d’agriculteurs situés dans les bassins versants de la Chaudière et Etchemin, situés au sud de Québec, pour caractériser les préférences des agriculteurs en termes de la moyenne et de l’écart type des réductions de phosphore et de coliformes, et des coûts supportés par les agriculteurs locaux et les contribuables du Québec pour soutenir l’adoption des PAG. Les résultats montrent une hétérogénéité observée et non observée significative en ce qui concerne l’utilité marginale des agriculteurs pour la réduction de phosphore et des coliformes. La répartition des comportements des producteurs face au risque couvrent les trois types de comportement: l’aversion au risque, l’indifférence à l’égard du risque et l’amour du risque. L’évaluation des bénéfices économiques diminue avec l’âge; cependant l’effet de l’âge est inférieur à l’hétérogénéité entre les agriculteurs du même âge. Les agriculteurs connaissent la désutilité lorsque leur propre coût ou les coûts des contribuables augments, mais un dollar privé vaut beaucoup plus aux agriculteurs qu’un dollar public.
Introduction
In most industrialized countries, citizens are increasingly interested in agricultural and environmental issues (Ministère de l’Agriculture, des Pêcheries et de l’Alimentation du Québec [MAPAQ] Citation2008). Environmental concerns are particularly acute in areas where agriculture is practiced intensively. This is true in Quebec, where excessive discharge of nitrogen, phosphorus and sediments associated with hog production caused water quality degradation in rivers and streams and contaminated wells in rural areas. Following a public inquiry, a moratorium on hog expansion was imposed in Quebec between 2002 and 2005. Similar concerns were raised in Manitoba, where a moratorium was also imposed between 2006 and 2008. Since excessive total coliform levels are more likely to be encountered in areas where intensive agriculture is practiced, concerns over the quality of drinking water in rural areas motivated several government agencies to jointly sponsor a study about water quality (Ministère de l’Environnement du Québec [MEQ] Citation2004). The sponsors were the Ministry of the Environment, the Ministry of Health and Social Services, the Ministry of Agriculture, Fisheries and Food and the National Institute of Public Health. While it was concluded that rural residents generally had access to quality water, it was also stated that residents relying on surface wells were more at risk of bacterial and nitrite-nitrate contamination. Stricter environmental regulations followed in the wake of the moratorium. For example, environmental performance assessments are now tied to farm income support programs. Quebec hog farmers must provide an annual phosphorus report to receive payments from the “Assurance stabilisation des revenus agricoles (ASRA)” program, a provincial complement to the national AgriStability program. The phosphorus report must cover all farm productions, including the ones that are not covered by the revenue insurance program. Compensations under the ASRA program are based on the differential between a calculated cost of production and the market price. The compensation per head varies from one year to the next, and most farmers’ premium is one third of the costs. In 2008 (2011), the compensation was $46.09 ($16.39), while the market price was $114.53 ($178.17). Thus, farmers have a strong incentive to be environmentally responsible. The provincial government has also helped with the funding of environmental clubs to promote the adoption of best management practices (BMPs) to mitigate adverse environmental consequences. Recently, the federal government initiated a program to evaluate the economic and water-quality impacts of BMPs. By implementing riparian buffers, reducing herbicide use, incorporating liquid manure directly into the ground, tilling 24 hours after spreading manure and implementing specific crop rotation cycles, farmers can, perhaps, sufficiently diminish water-quality degradation and prevent the imposition of additional regulations.
Total phosphorus is an important indicator of nutrient conditions in freshwater systems. Its effects on phytoplankton growth and eutrophication are well documented (e.g. Sebastia et al. Citation2012). Because BMPs tend to raise production costs (Ghazalian et al. Citation2010) and have mixed effects on indices of productivity and technical and environmental efficiencies (Tamini et al. Citation2012), not all farmers are adopting BMPs, and rates of adoption vary across BMPs (Ghazalian et al. Citation2009). While adoption studies have been useful in defining profiles of non-adopters and, hence, help focus extension efforts, they have not provided insights about the valuation of water-quality benefits stemming from the adoption of BMPs.
Random utility theory posits that people will maximize utility when choosing an alternative in a given choice set. The utility is made up of a deterministic component, which consists of observable attributes characterizing the alternatives, and a stochastic component, which embodies all other conditioning factors that cannot be measured or observed by researchers. The basic idea is to characterize peoples’ preferences through trade-offs between attributes embodied in their selection of an alternative among a set of alternatives. From the estimated parameters of the utility function, a willingness-to-pay measure can be estimated by computing how a monetary variable like a price or a cost must increase to compensate for a given increase in a particular attribute for the utility level to remain unchanged.
The environmental effects of BMPs are conditioned by many factors. Biophysical studies have shown that environmental outcomes resulting from the adoption of BMPs vary across watersheds, within a watershed and even within a given field. Even though farmers possess much information about the topography and soil characteristics of their land, BMP performance can also be influenced by exogenous factors such as rainfall. As a result, farmers face fairly large confidence intervals around their ex-ante predictions regarding BMP-induced environmental benefits. However, because some BMPs have been adopted and implemented by many farmers and promoted by extension agents for some time, individual farmers are likely to have a good idea about the distribution of environmental outcomes associated with BMPs (Tamini Citation2011). Because farmers can assign probabilities to potential environmental outcomes, their decision-making is done under risk. Their information, while incomplete, is far richer than under Knightian uncertainty/ambiguity.
The behaviour of economic agents under risk and uncertainty has motivated a great deal of research. Expected utility theory was for a long time the only framework to model the behaviour of economic agents under risk. Several paradoxes uncovered through experiments motivated the development of alternative theories. Gilboa (Citation2009) provides an insightful synthesis of these alternative theories, including prospect theory, developed by Kahneman and Tversky (Citation1979), which assumes that individuals display loss aversion by being hurt more by losses than by gains relative to a reference point. There is also much work on ambiguity/uncertainty aversion. For example, Asano (Citation2010) and Agliardi and Sereno (Citation2011) show that the optimal timing of emission reductions when the regulator is ambiguity averse differs from when the regulator is risk neutral. This has important implications for the choice of policy instruments, and this is further investigated in Agliadi and Sereno (Citation2011). Even though stated-choice experiments have been used for decades in environmental economics, most studies have assumed that environmental benefits are deterministic (e.g. Kosenius Citation2010). In fairness, it must be said that the introduction of risk in stated-choice experiments poses several challenges, particularly in the design of stated-choice experiments. Some, like Glenk and Colombo (Citation2011), have developed a framework around the concept of delivery failure to investigate the value of greenhouse gas (GHG) emission reductions. This implies that realized benefits are either equal to expected benefits or zero. However, this “all or nothing” set of outcomes is not consistent with what we know about the distribution of BMP-induced water quality benefits.
Many empirical studies about risk rely on model specifications featuring the mean and the standard deviation of outcomes (Chavas Citation2004). The two-moment decision framework is quite flexible and can accommodate complex theoretical concepts such as prudence and temperance (Wagener Citation2002). Defining utility V in terms of mean and standard deviation of benefits , a measure of absolute prudence is:
(1)
The concept of prudence is used to rationalize precautionary savings in an intertemporal setting. Temperance, defined as(2)
is necessary for the demand for a risky asset to fall when independent background wealth becomes riskier. The operational difficulty in explicitly using the standard deviation as a choice attribute is that many respondents are not likely to know what it means, and may find it too time-consuming to get a solid grasp of the concept if a definition and some examples were inserted in a preamble to the choice experiments. It was imperative to develop a simple strategy to introduce risk in the choice sets without confusing respondents or adding too much to the length of time required to complete the stated-choice experiments and the other parts of the questionnaire. Fortunately, the spread between values of a symmetric three-point uniform distribution is the standard deviation, and it is easy to size it up along with the mean at a single glance. This is why instead of presenting respondents with a unique value of a given benefit in the alternatives featured in the choice sets, three values which were said to be equally likely were presented to respondents. This way, the standard deviation is included in the design of the stated-choice experiments without having an explicit standard deviation as an attribute in the actual choice sets.
Two distinct benefits, phosphorus reductions and coliform reductions, were allowed in the experiment. Other attributes included the amount that farmers and taxpayers would have to pay for BMPs to be implemented. The choice sets were generic as they featured two unlabelled alternatives and one “do nothing” alternative. Each of the two unlabelled alternatives presented different trade-offs between phosphorus and coliform reductions and costs to farmers and taxpayers associated with the adoption of unspecified suites of BMPs. The focus in this study is on the value of environmental benefits, not on individual or groups of BMPs. The problem of priors about marginal environmental effects of specific BMPs is then avoided. A producer’s valuation of a specific BMP is likely to depend on whether the BMP was adopted, where it was implemented, and farm and land attributes that are not all likely to be observed by modellers. For these reasons, environmental benefits are the focus in this paper.
The purpose of this study is twofold. The first objective is to evaluate the value of BMP-induced reductions in phosphorus and coliforms by farmers in the Chaudière and Etchemin watersheds located south of Quebec City. The appreciation of water quality improvements can be conditioned by concerns about one’s health and that of family members, neighbours and other rural residents, enjoyment of recreational activities in nearby lakes and rivers, and the health of the aquatic fauna in these lakes and rivers. All of this is valuable, particularly for farmers who feel personally targeted whenever agriculture is blamed for water pollution. It is assumed that ignoring risk in attribute levels when estimating BMP-induced water quality benefits may result in over- or underestimated benefits and, consequently, in flawed program and policy designs. It is also assumed that preferences in the face of risk are likely to be heterogeneous across individuals. Preferences can vary across socio-demographic and farm profiles, and possibly within given profiles. This paper relies on a random-parameter estimator and interaction effects to account for heterogeneity in preferences linked to unobserved and observed characteristics of individuals or farms. The random parameter approach allows for coefficients to vary across individuals according to a given distribution. Farmers with similar observable characteristics can value water quality improvements quite differently. They may also react differently to deviations around expected improvements. This sort of heterogeneity within given socio-demographic profiles cannot be taken into account with fixed regression coefficients. The randomness or fixity of parameters can be validated by a statistical test. The second objective is to evaluate the extent to which farmers care about relying on taxpayers’ contributions to finance BMP implementation on their farm.
The paper is organized as follows. The next section discusses BMP adoption, water-quality valuation and risk. This is followed by a description of the conceptual framework, and a discussion of econometric and data issues. Estimation results and their implications are then discussed. The last section contains a brief summary of the findings and concluding comments.
Best management practices adoption, water-quality valuation and risk
The intensity of agricultural activities has prompted governments to tighten environmental regulations and to encourage the adoption of BMPs. In the United States, adoption was encouraged through a universal and voluntary cost-share program or limited annual incentive payments (Paudel et al. Citation2008). Until 2009, Canada implemented the National Farm Stewardship Program to provide financial incentive for farmers to adopt BMPs. These cost-share programs have been criticized because adoption rates have not been as high as expected, and because the farmers who participate are not necessarily the ones who can be most effective in limiting water-quality degradation. Brethour et al. (Citation2007, 82) report that only 3% of Canadian farmers had requested funding assistance. They argue that BMP adoption is limited by costs and the farmers’ low valuation of benefits. Bartolini et al. (Citation2007) rely on a principal-agent framework to analyze the cost effectiveness of different program designs meant to reduce nitrogen pollution from agricultural activities. They show that some designs can reduce costs by 200% or more. Sauer and Fischer (Citation2010) report very low participation in a program rewarding investment in riparian buffer strips in Germany and show that stated willingness to pay (WTP) obtained through contingent valuation and actual WTP can differ a lot. At the provincial level, and more specifically in Quebec, the 2002 water policy forced farmers to develop environmental plans regarding fertilization, crop rotations and riparian buffers, and to report on environmental performance indicators. The presumption was that farmers would consider BMPs, like surface runoff controls, herbicide dosage reductions and liquid and solid manure management, as a means to achieve environmental targets and avoid additional regulations. Since 2011, Quebec farmers must submit a phosphorus report before May 15 each year to qualify for revenue insurance payments.
Ghazalian et al. (Citation2009) note that adoption rates in the Chaudière watershed south of Quebec City vary significantly across BMPs (15–67%), farmers and farm characteristics. Residing on the farm is a contributing factor, due to health and environmental concerns for one’s family and neighbours. This is coherent with the multi-utility framework developed in Chouinard et al. (Citation2008), which features a social utility component rationalizing farmers’ trading off profits for conservation. Evidence of a strong stewardship ethic influencing the farmers’ adoption process in Australia is also documented by Greiner and Gregg (Citation2011). Ghazalian et al. (Citation2009) also report that, all else being equal, larger farms are more likely to adopt. Since it is well documented that BMP implementation is costly (Ghazalian et al. Citation2010), BMP adoption on smaller farms could be limited by a tighter financial constraint. Some of the smaller farmers may also face a time constraint, having to generate enough off-farm income to support their family. For instance, running an implement to force manure into the soil within 24 hours after spreading may be too costly in time and fuel. Alternatively, owners of smaller farms may not value water-quality benefits as much, perhaps underestimating their own impact and free-riding on larger farmers’ effort to mitigate water-quality degradation. Concerns about one’s image can also be a motivation for BMP adoption. Agricultural farmers are often accused of hurting the environment, and the extent to which farmers are sensitive to such accusations might vary by farm size. Environmental consciousness might also be affected by the age and education of farmers. One could conjecture that younger and more educated farmers have been exposed to more information about environmental issues and BMP implementation and effectiveness. However, during the pre-test of the questionnaire, an older producer volunteered that younger farmers are too concerned about “neatness”, cut too many trees and plow too much. He suggested that farmers of his generation appreciate more the wildlife and outdoor recreational activities in rural areas.
While BMP adoption studies provide some insights about farmers’ valuation of benefits from water-quality improvements, they typically do not disentangle different types of benefits, nor do they address the issue of risk in the delivery of benefits. Studies about water-quality benefit valuation can target different quality indicators, ranging from water clarity/transparency and alkalinity measures to concentrations of herbicides, nitrogen and phosphorus, and bacteria counts. The benefits in the form of percentage phosphorus and coliform reductions are the focus in this paper. Even though Egan et al. (Citation2009) found that individuals can relate to many water-quality variables, a large number of different benefits is avoided because every mean reduction was accompanied by a standard deviation. In addition to increasing the number of parameters to be estimated, the introduction of risk significantly increases the complexity of the trade-offs faced by respondents.
As stated before, risk is introduced in the choice sets by presenting three equally probable reductions as opposed to just the mean reduction. The upper and lower bounds are set symmetrically around the mean, such that the difference between either bound and the mean is the standard deviation. This is done for phosphorus and coliform reductions. Naturally, it is expected that mean reductions will increase utility, while increases in the standard deviation have an a priori ambiguous effect. A negative (positive) coefficient on the standard deviation would imply risk aversion (loving), while a statistically insignificant coefficient would be interpreted as risk neutrality. A risk-loving farmer facing equally probable symmetric deviations from expected water pollution reduction gains more from a larger-than-expected reduction than he loses from a smaller-than-expected reduction. Holding the mean reduction in water pollution constant, a risk-loving farmer will prefer a situation with larger variations around the mean to a situation with smaller variation around the mean. The converse is true for a risk-averse farmer, while a risk-neutral farmer is indifferent to variations around the mean. One would expect preferences toward risk to vary across individuals. There could be variations across different socio-demographic profiles as well as within profiles. A random parameter framework is adopted, and the interaction effects between socio-demographic and farm characteristics and the mean and standard deviation of phosphorus and coliform reductions are tested.
Empirical framework, estimation and data
In a random utility model (RUM), each individual is assumed to be rational. This essentially means that an individual is able to precisely assess each alternative and to state which alternative delivers maximum utility. The alternatives are unlabelled, as attributes fully define the alternatives. The utility is random and can be decomposed into a deterministic component and a random error term. Following Revelt and Train (Citation1998) and Hensher et al. (Citation2005), it is assumed that a sampled individual faces a choice among alternatives in each of
choice occasions. Individual
is assumed to consider the full set of alternatives on choice occasion
and to choose the alternative with the highest utility. The utility that individual
derives from choosing alternative
on choice occasion
is represented in a discrete choice model by a random utility expression of the form:
(3)
in which is a random term that is assumed to be an independently and identically distributed extreme value (Train Citation2003), and
represents the deterministic part of the indirect utility. The
component is conditioned by a vector of attributes
of the alternatives, which can interact with characteristics of the respondents or of their farms. The attributes include the mean and standard deviations of percentage reductions in phosphorus and coliforms, as well as the cost to the farmers and the cost transferred to taxpayers to achieve the expected reductions in phosphorus and coliforms. The beta coefficients can be interpreted as the marginal utilities of the attributes, the effect of increasing a given attribute on the level of utility, holding all else constant. The probability of respondent
choosing alternative
on choice occasion
follows the conditional logit formula (McFadden Citation1974):
(4)
Coefficients associated with the mean and standard deviation of phosphorus and coliform reductions are treated as random and hence vary across individuals , while others are treated as fixed and are the same for all individuals. From discussions with farmers during the pre-test, different values and attitudes about environmental issues are observed, and this is why the mean and standard deviations of phosphorus and coliform reductions are assumed to be random parameters. Experimentation with different combinations of fixed and random parameters confirmed the priors about fixed and random coefficients. A description of the estimation techniques can be found, for example, in Train (Citation2003) and Greene (Citation2007).
The status quo alternative entails no risk and no cost for the farmers and taxpayers, but also no potential environmental benefits. As such, the intercept of the model captures the opportunity cost of private and public funds. The sign of individual fixed coefficients (or mean of random coefficients) tells whether a given attribute for most respondents increases or decreases utility. A variable with a random parameter may have a mean coefficient of zero and still have a significant impact on utility if the standard deviation coefficient is statistically significant. For example, it could be that the average producer does not derive benefits or losses from an increase in the riskiness of an environmental improvement, but that subsets of farmers experience either a significant gain or loss in utility. The WTP for the attributes can be calculated as the ratio of benefit and cost parameters. WTP estimates are the cost increases required to maintain utility constant when phosphorus or coliform concentrations are reduced.
The data used in this paper are based on a survey that featured choice experiments, conducted in the spring of 2012. A first version of the survey had been tested at the Fertilization Club of the Beauce region. Participants had received $50 to fill the survey, answer questions about the survey and offer comments. The final version of the survey was mailed to 1000 farmers located in the Chaudière watershed, south of Quebec City. The choice set design was developed with the software NGene (NGene Citation2012). An efficient design was adopted to optimize the precision of the parameters to be estimated. Dillman’s method to survey management was used by first sending a letter informing farmers that they would be asked to fill out a questionnaire and that they could opt out by contacting us (Dillman Citation1978). A questionnaire was then sent, followed by two reminders and a second questionnaire to farmers who had not yet returned their questionnaire. To encourage participation, for each questionnaire properly filled out and returned, $20 was given to a rural charity giving scholarships to sons and daughters of agricultural farmers. The questionnaire also included questions to build a socio-demographic profile of each respondent, along with questions about the respondent’s farm and perception about water-quality issues. The experimental design contained a total of 12 choice sets divided into two blocks so that each respondent was confronted with one of the two blocks of six choice sets featuring three alternatives, including a “status quo” one. Each individual was presented with six choice sets to complete. The choice experiments were designed to provide plausible attributes, orthogonal over experiments and with no experiment containing a dominating alternative. Each of the two choices contained four attributes indicating a probable percentage reduction in phosphorus, a probable percentage reduction in coliform, and the corresponding farmers’ and taxpayers’ cost. The third choice, which was the status quo, was labelled the current practice with no change in phosphorus and coliform reductions along with no contribution for farmers and taxpayers.
The summation of two perception variables was also included in the model specification, namely the perception about whether the contribution of municipalities and rural residents to water-quality improvement is sufficient, and the perception about whether government ought to regulate municipalities and rural residents to improve water quality. These two variables are ordered Likert-type rating scales. For each of them, a seven-point Likert-scale measure ranging from 0 (strongly disagree) to 6 (strongly agree) is used. The summation of these variables gives a Likert scale ranging from 0 to 12. The data sets contain a total number of 204 farmers who correctly filled out the questionnaire. The summary statistics of the attribute characteristics and the other variables that enter the models are presented in Table . These statistics indicate that there are considerable differences among farmers. The mean value of 8.63 for the variable labelled “Town people should pay” indicates that, on average, most farmers view positively having taxpayers subsidize BMP adoption. The data show that over 71% of farmers strongly support this policy. The average farmer is 50 years old, with a 76% majority of farmers being between 41 and 78 years old.
Table 1. Summary statistics of variables.
Results
Estimation results
The measurement of environmental benefits is predicated upon proper model specification. Heterogeneity in behavioural responses to risk and in environmental sensibility motivated the priors about the fixity of the coefficients for cost variables, and the randomness of coefficients for mean reductions of phosphorus and coliform and their respective associated risk. The validity of these priors was ascertained through a likelihood-ratio test for the joint significance of the standard deviations of random parameters. The evidence reported in Table led us to reject the null hypothesis that all the standard deviations are equal to zero. This rationalizes the use of a random parameter model that accounts for heterogeneity across farmers when it comes to their appreciation of mean environmental improvements and the extent to which they mind or like risk in environmental improvements.
Table 2. Mixed logit estimation of choice models with and without risk.
Very few studies about the valuation of environmental benefits have accounted for risk, and it is legitimate to wonder whether risk variables make a significant contribution to the fit of the model. To make a determination, a likelihood-ratio test was used about the significance of the risk variables. In doing this, a model without risk variables, whose coefficients are reported in Table , is also estimated. The statistic, 2 (465.92 – 385.29) = 161.26, is much higher than the corresponding critical value, and this confirms that farmers consider not only the expected levels of benefits, but also the degree of dispersion of potential benefits, when comparing alternatives. Coefficient estimates for the random parameter model are shown in Table . It can be seen that the mean coefficients about the phosphorus and coliform reductions in the mixed logit that includes the risk variables are larger than their counterparts in the mixed logit without risk variables. Clearly, the exclusion of risk variables in the mixed logit model causes a sizeable downward bias in the parameters associated with coliform and phosphorus reductions. This is indicative that respondents have systematically processed the information about risk. Omitting risk variables would lead to the underestimation of benefits associated with phosphorus and coliform reductions. Glenk and Colombo (Citation2011) report similar findings regarding the importance of incorporating risk. The cases involving different distributions for different random parameters were not considered because this would have forced us to assume that parameters were independently distributed. The estimations using bounded triangular distribution were also tested. The results were very similar to ones obtained with the unbounded multivariate normal distribution, which contrasts with the findings of Egan et al. (Citation2009) who reported more intuitive results with the bounded triangular distributions.
The coefficients for mean reduction of phosphorus and coliform are positive, statistically different from zero at the 95% level and quite close in magnitude to one another. This suggests that farmers value equally both types of reductions. However, the appreciation of coliform and phosphorus reductions varies across farmers. The extent to which this is the case is captured by interaction effects with age, and the standard deviation coefficients that capture the effects of non-observable factors. The hypothesis that random coefficients are correlated can be tested through a likelihood-ratio test about the null hypothesis that all of the off-diagonal elements of the covariance matrix are zero (see Table ). The test statistic, chi-squared distributed with six degrees of freedom, is given by 2 (856.8533 – 820.6073) = 72.492, which exceeds 12.59, the tabulated value. This result implies that it is best to allow for correlation between random coefficients. The age interaction effects have negative coefficients, which implies that benefits perceived from a reduction of a given size are larger for younger farmers than for older ones. The effect of age on the valuation of mean environmental benefits is stronger for coliform than for phosphorus. The standard deviation coefficients are less than half of the mean coefficients, which implies that virtually all farmers value environmental improvements. For example, the distribution of the effect of phosphorus reductions has an estimated mean coefficient of 0.73 and an estimated standard deviation coefficient of 0.28. Thus, the marginal valuations of phosphorus reductions for a 30-year-old farmer can be as low as: 0.73 – (1.96)(0.28) – 0.008(30) = –0.0588, or as high as: 0.73 + (1.96)(0.28) – 0.008(30) = 1.0388. For a 60-year-old farmer, the range goes from –0.2988 to 0.7988. The negative lower bounds result from the assumption that random parameters follow a multivariate normal distribution. They should be interpreted as zero, as some farmers may not care about environmental improvements, but are not expected to derive utility from environmental degradation. A weakly positive bound could be imposed by choosing a log-normal distribution. However, it would not make sense to assume log-normality for risk parameters, and having different parameters following different distributions rules out correlation between the means and standard deviations of reductions in coliforms and phosphorus. The range of marginal valuations is larger for coliform reductions. It is easy to see that the heterogeneity associated with age differences is small relative to the degree of heterogeneity between farmers of the same age. This heterogeneity in perceptions about benefits helps explain why cost-share programs have not had high levels of participation.
Table 3. Covariances between mixed logit coefficients.
The mean risk coefficients are negative, but not statistically different from zero at conventional levels. However, their standard deviations are statistically significant. The interpretation is that some farmers are risk averse, some are risk neutral and some are risk loving. Farmers that are risk averse (loving) have a negative (positive) risk coefficient. The risk effects were allowed to interact with age, and the estimated coefficients for these interaction effects are positive. All else being equal, age lessens the negative effect of risk on utility. Once the magnitudes of all of the relevant coefficients are taken into account, it is found that 64% prefer less risk in phosphorus reductions than more risk. For coliform reductions, 88% prefer less risk to more risk in coliform reductions. These estimates are given by:(5)
where is the cumulative standard normal deviation and bk and sk are the mean and standard deviation, respectively, of the kth coefficient (Hole Citation2007).
Cost variables have coefficients with negative signs that are highly significant, as expected. This suggests that, all else being equal, farmers experience disutility when costs to themselves or taxpayers increase. Clearly farmers do not enjoy free-riding on taxpayers, but the fact that 71% of them indicated that “town people should pay more” suggests that one private dollar is worth a lot more than a “public” dollar to farmers. To properly interpret the cost coefficients, it is important to recall the manner in which cost variables are defined. Respondents were told that a contribution of $2 by an individual taxpayer translates into a transfer of $12 million to subsidize BMP implementation. Likewise, a producer contributing $10/acre ends up spending $3000 if he/she owns 300 acres. From the coefficients, it means that a producer experiences as much disutility from an increase of $4.43 in his/her own (and fellow producers’) cost per acre (or $1329 for a 300-acre farm) as from an extra $6 million in taxpayers’ contributions (i.e. $1 per taxpayer). An interaction effect was allowed between taxpayers’ cost and a Likert-scale variable measuring the belief that “town people should pay more”. The coefficient for this interaction effect is positive, which implies that farmers who believe that town people should contribute more to fund environmental abatement in rural areas experience less disutility when the burden on taxpayers gets heavier than farmers who feel that town people do enough. The fact that farmers are willing to pay more to alleviate the burden of taxpayers supports the cost-share approach currently used in Quebec. The relatively high value of a farmer’s dollar reflects the substantial share of the costs assumed by the provincial government in current and past programs. The current share of the government is 90% when two farmers with adjacent fields invest in BMPs, and 70% when a farmer acts alone. Governments also pay for all administrative costs of cost-share programs, and yet the literature points out that financial constraints are major impediments to BMP adoption (Ghazalian et al. Citation2009; Baumgart-Getz et al. Citation2012).
Table presents the estimated covariance matrix and the t-statistics for each of its elements. Because diagonal elements must be positive and because the sign of the off-diagonal elements is meaningful, one-tailed tests are more appropriate. Thus, -statistics of 1.6 and above for any given element indicate that the element is statistically greater than zero when the element is positive, or statistically less than zero when the element has a negative sign. The null of a zero coefficient can be rejected for half of the off-diagonal elements. The estimated covariance matrix shows that the mean of the phosphorus reduction coefficient is negatively correlated with the mean coefficient for coliform reductions. This implies that farmers who value more phosphorus reductions tend to be less appreciative of coliform reductions, and vice versa. One might attribute this outcome to farmers who have in the past experienced a problem with either phosphorus or coliforms, and who remain mainly concerned about a reoccurrence. The mean coefficient for phosphorus reduction is positively correlated with the coefficient associated to the risk in phosphorus reduction. Farmers who value more phosphorus reductions tend to like risk more, or at least mind it less. Clearly, these farmers must have phosphorus loads well below the threshold above which they would forfeit their ASRA payments, and, hence, are not too concerned about lower-than-expected environmental improvements. The mean coliform reduction coefficient is negatively correlated with the coefficient associated with the risk around coliform reductions, but this effect is statistically weak. Still, it suggests that farmers who most value coliform reductions tend to lose utility when there is risk around the coliform reductions that will actually be achieved. Put differently, they suffer more from smaller-than-expected reductions in coliforms than they gain from larger-than-expected coliform reductions. The mean coliform reduction coefficient is also negatively correlated with the coefficient associated with the risk around phosphorus reduction. This estimate implies that farmers who most value coliform reductions are more likely to experience disutility from risk increases around phosphorus reductions. Finally, the coefficient associated to the risk of phosphorus reduction is positively correlated with the coefficient associated to the risk around coliform reduction, but the significance of this effect is weak. Still, it suggests that farmers who are inconvenienced by risk around phosphorus reductions tend to be more inconvenienced by risk around coliform reductions.
To summarize, there is significant heterogeneity among farmers regarding the marginal utility derived from BMP-induced phosphorus and coliform reductions. There is an “age effect”, with younger farmers having, on average, higher marginal utility from environmental benefits, but the heterogeneity amongst farmers of the same age in their appreciation of environmental improvements is even larger. Risk in the delivery of environmental improvements matters, even though the average producer is risk neutral. The proportion of farmers showing some level of risk aversion is higher than the proportion of farmers who are risk loving. The implications of these results are now considered for the distribution of WTP for phosphorus and coliform reductions.
Willingness to pay for BMP-induced water quality improvements
Since the farm cost coefficients are specified to be fixed, the WTP for an attribute (which is the negative of the ratio of the attribute’s coefficient to the farm cost coefficient) is distributed in the same way as the attribute’s coefficient. As discussed above, the age of the farmer clearly impacts on the utility derived from phosphorus and coliform reductions, and hence on WTP estimates. Table reports the estimated mean WTP and confidence intervals for two age groups based on 5000 draws, accounting for correlations between random coefficients as in Krinsky and Robb (Citation1986, 1991). The mean of WTP is highly significant, but the confidence intervals are wide, indicating that the WTP varies a lot across individuals similar in age. The mean valuation of BMP-induced environmental benefits is larger for young farmers.
Table 4. Willingness to pay (WTP) estimates for two age groups (5000 draws accounting for correlations between random coefficients).
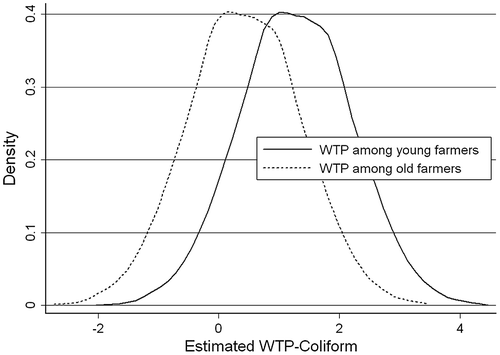
Figure represents the estimated distributions of WTP for phosphorus reduction among young and old farmers, while Figure plots the estimated distributions of WTP for coliform reductions for young and old farmers. These figures clearly show that 30-year-old farmers are willing to pay more, on average, for environmental benefits than 60-year-old farmers. The difference between age groups is even more evident for coliform reductions. This age effect on WTP is not surprising given that younger farmers will enjoy benefits over a longer horizon. However, the WTP distributions are characterized by variances which are so large that heterogeneity between farmers of a given age ends up being more important than the heterogeneity associated with age.
Figure 1. Willingness to pay (WTP) for phosphorus reduction.
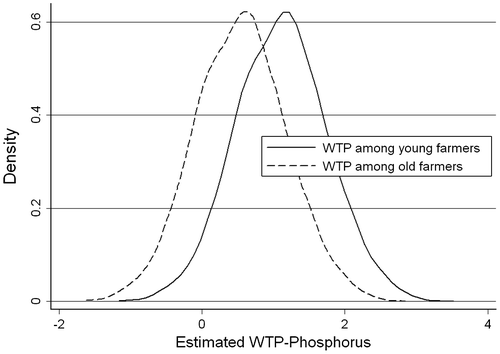
Figure 2. Willingness to pay (WTP) for coliforms reduction.
The results show that a 1% reduction in phosphorus is worth, on average, $1.10 per acre for young farmers. Therefore, the average young farmer would be willing to pay $44 to 66 per acre for reductions of 40–60%. To put this in perspective, Liu et al. (Citation2011) estimate the cost to implement riparian buffers to enhance water quality in a Kentucky River watershed at around US$129 per acre. Unpublished cost estimates about BMPs for Quebec from the Centre de recherche en agriculture et agroalimentaire du Québec (CRAAQ) are a bit lower. This means that the average young farmer is willing to contribute almost half. Clearly, some young farmers are willing to pay a much higher share of the cost, but many others would not pay half the cost.
Policy implications and conclusions
Stated preference methods are commonly used to estimate the value of goods and services for which there are no markets, such as goods that have yet to be commercialized, or environmental benefits associated with air and water quality, for example. For many environmental outcomes, the risk associated with the outcomes may greatly affect the choice of individuals and their willingness to pay for the adoption. In this paper, the risk associated with the delivery of phosphorus and coliform reductions stemming from best management practice (BMP) adoption was considered. It is well documented that environmental outcomes associated with the adoption of BMPs can be influenced by several factors, some of which are beyond the control of farmers. Until recently, uncertainty had been ignored in stated-choice studies about environmental benefits, yet recent advances in the behavioural literature have shown that human decision making is altered in a non-random manner by the presence of risk. BMP adoption is generally costly for individual farmers, and this, along with a lack of know-how about BMP implementation, has had an adverse effect on BMP adoption. Governments have recognized this and have put forth different strategies to encourage BMP adoption. There has been much debate about how government should intervene to maximize environmental improvements in a least-cost manner by taking into account the fact that different farmers have different abatement costs. The paper contributes to the debate by investigating the economic valuation of the benefits accruing to farmers derived from expected water-quality improvements stemming from the adoption of BMPs.
The results show that farmers, particularly younger farmers, value phosphorus and coliform reductions. It is also found that risk in the realized reductions of phosphorus and coliforms affects farmers differently, as some display aversion toward risk while others are neutral, and some even like risk. Allowing for risk in the delivery of environmental improvements is not trivial in stated-choice experiments because respondents are not likely to know much about statistical concepts. This problem is addressed by presenting to respondents a discrete three-point uniform distribution of phosphorus and coliform reductions instead of just the mean reductions. It is assumed that this representation made it easy for respondents to process information about the mean and the standard deviations of environmental improvements. The inclusion of risk has a non-trivial incidence on farmers’ willingness to pay (WTP) for phosphorus and coliform reductions. WTP estimates are downward-biased when risk is ignored. Clearly, risk matters in conditioning choices made by respondents and must be included in stated-choice models. It was also shown that this can be done without having to explain to respondents what a standard deviation is.
The fact that young farmers are found to be willing to pay more, on average, than older farmers for phosphorus and coliform reductions is intuitive, because they have a longer planning horizon and because they are possibly more concerned about health and environmental issues than are older farmers. This is an encouraging result for policymakers because the proportion of farmers sensitive to environmental externalities should grow over time. Still, much heterogeneity was found across producers after controlling for age. This might be attributable to differences in knowledge about the costs and benefits of BMPs, and perceptions about the quality of nearby rivers and streams. Broadly delivered extension activities can probably reduce the heterogeneity across producers. The WTP estimates suggest that most farmers need to be subsidized if they are going to contribute to phosphorus and coliform reductions through the adoption of BMPs. Younger farmers are willing to pay, on average, about half of the cost to implement the standard riparian buffers, but the WTP distribution is quite wide. The policy implication is that universal cost-share programs are likely to be costly if a high adoption rate is aimed for. Auctions designed around the revelation of individual WTP should be a lot more effective in the presence of such heterogeneity, provided that farmers participate in large numbers, and that such mechanisms are given a chance to operate in the first place. In Quebec, the producer’s union (Union des Producteurs Agricoles or UPA) is very influential in program design, and it has traditionally supported universal programs as opposed to programs that would have farmers compete against one another. The results also show that farmers experience disutility when their own cost or taxpayers’ cost increases. Farmers are not free-riders, but a private dollar is worth substantially more to farmers than a public one, a result that explains why past and current shares of the provincial government in cost-share programs have been so high.
Acknowledgements
The authors thank two anonymous referees and the Associate Editors for their comments that improved this paper. Financial support from the Watershed Evaluation of Beneficial Management Practices (WEBs) program is gratefully acknowledged.
References
- Agliardi, E., and L. Sereno. 2011. The effects of environmental taxes and quotas on the optimal timing of emission reductions under Choquet-Brownian uncertainty. Economic Modelling 28: 2793–2802.10.1016/j.econmod.2011.08.015
- Asano, T. 2010. Precautionary principle and the optimal timing of environmental policy under ambiguity. Environmental and Resources Economics 47: 173–196.10.1007/s10640-010-9370-9
- Bartolini, F., V. Gallerani, M. Raggi, and D. Viaggi. 2007. Implementing the water framework directive: Contract design and the cost of measures to reduce nitrogen pollution from agriculture. Environmental Management 40: 567–577.10.1007/s00267-005-0136-z
- Baumgart-Getz, A., L. Stalker Prokopy, and K. Floress. 2012. Why farmers adopt best management practice in the United States: A meta-analysis of the adoption literature. Journal of Environmental Management 96: 17–25.10.1016/j.jenvman.2011.10.006
- Brethour, C., B. Sparling, B. Cortus, M. Klimas, T.-L. Moore, and J. Sadler-Richards. 2007. An economic evaluation of beneficial management practices for crop nutrients in Canadian agriculture. Guelph, ON: George Morris Centre, 150 pp.
- Chavas, J. P. 2004. Risk analysis in theory and practice, San Diego, CA: Elsevier Academic Press, 247 pp.
- Chouinard, H., T. Paterson, P. M. Wandschneider, and A. M. Ohler. 2008. Will farmers trade profits for stewardship? Heterogeneous motivations for farm practice selection. Land Economics 84: 66–82.
- Dillman, D. A. 1978. Mail and telephone surveys: The total design method. New York: John Wiley & Sons, 325 pp.
- Egan, K., J. A. Herriges, C. L. Kling, and J. A. Downing. 2009. Valuing water quality as a function of water quality measures. American Journal of Agricultural Economics 91: 106–123.10.1111/ajae.2009.91.issue-1
- Ghazalian, P. L., B. Larue, and G. E. West. 2009. Best management practices to enhance water quality: Who is adopting them? Journal of Agricultural and Applied Economics 41(3): 663–682.
- Ghazalian, P. L., B. Larue, and G. E. West. 2010. Best management practices and the production of good and bad outputs. Canadian Journal of Agricultural Economics 58: 283–302.
- Gilboa, I. 2009. Theory of decision under uncertainty. Cambridge, MA: Cambridge University Press, 279 pp.10.1017/CBO9780511840203
- Glenk, K., and S. Colombo. 2011. How sure can you be? A framework for considering delivery uncertainty in benefit assessments based on stated preference methods. Journal of Agricultural Economics 62(1): 25–46.10.1111/jage.2011.62.issue-1
- Greene, W. H. 2007. NLOGIT version 4.0: Reference guide. N17. New York: Econometric Software, Inc.
- Greiner, R., and D. Gregg. 2011. Farmers’ intrinsic motivations, barriers to the adoption of conservation practices and effectiveness of policy instruments: Empirical evidence from northern Australia. Land Use Policy 28: 257–265.10.1016/j.landusepol.2010.06.006
- Hensher, D. A., J. Rose, and W. H. Greene. 2005. The implications on willingness to pay of respondents ignoring specific attributes. Transportation 32: 203–222.10.1007/s11116-004-7613-8
- Hole, A. R. 2007. Fitting mixed logit models by using maximum simulated likelihood. The Stata Journal 7(3): 388–401.
- Kahneman, D., and A. Tversky. 1979. Prospect theory: An analysis of decision under risk. Econometrica 47: 263–291.10.2307/1914185
- Kosenius, A.-K. 2010. Heterogeneous preferences for water quality attributes: The case of eutrophication in the Gulf of Finland, the Baltic Sea. Ecological Economics 69: 528–538.10.1016/j.ecolecon.2009.08.030
- Krinsky, I., and L. A. Robb. 1986. On approximating the statistical properties of elasticities. The Review of Economics and Statistics 68(4): 715–719.10.2307/1924536
- Krinsky, I., and L. A. Robb. 1991. Three methods for calculating the statistical properties of elasticities: A comparison. Empirical Economics 16(2): 199–209.10.1007/BF01193491
- Liu, Z., J. Schieffer, W. Hu, and A. Pagoulatos. 2011. Nonpoint source abatement costs in the Kentucky River watershed. Paper presented at the 2011 Annual Meeting of the Agricultural and Applied Economics Association. Pittsburgh, PA, USA, July, 24–26 2011.
- McFadden, D. 1974. Conditional logit analysis of qualitative choice behavior. In Frontiers in econometrics, ed. P. Zerembka, 105–142. New York: Academic Press.
- Ministère de l’Agriculture, des Pêcheries et de l’Alimentation du Québec (MAPAQ). 2008. Rapport de la Commission sur l’avenir de l’agriculture et de l’agroalimentaire québécois. Quebec: MAPAQ, 272 pp.
- Ministère de l’Environnement du Québec (MEQ). 2004. Étude sur la qualité de l’eau potable dans sept bassins versants en surplus de fumier et impacts potentiels sur la santé. http://www.mddep.gouv.qc.ca/eau/bassinversant/sept-bassins/index.htm (accessed February, 2013).
- NGene. 2012. NGene 1.1.1 user manual and reference guide. ChoiceMetrics. http://choice-metrics.com/index.html (accessed May, 2014).
- Paudel, K. P., W. M. Gauthier, J. V. Westra, and L. M. Hall. 2008. Factors influencing and steps leading to the adoption of best management practices by Louisiana dairy farmers. Journal of Agricultural and Applied Economics 40: 203–222.
- Revelt, D., and K. Train. 1998. Mixed logit with repeated choices: Households’ choices of appliance efficiency level. The Review of Economics and Statistics 80: 647–657.10.1162/003465398557735
- Sauer, U., and A. Fischer. 2010. Willingness to pay, attitudes and fundamental values: On the cognitive context of public preferences for diversity in agricultural landscapes. Ecological Economics 70: 1–9.10.1016/j.ecolecon.2010.03.026
- Sebastia, M. T., M. Rodilla, J. A. Sanchis, V. Altur, I. Gadea, and S. Falco. 2012. Influence of nutrient inputs from a wetland dominated by agriculture on the phytoplankton community in a shallow harbour at the Spanish Mediterranean Coast. Agriculture, Ecosystems & Environment 152: 10–20.
- Tamini, L. D. 2011. A nonparametric analysis of the impact of agri-environmental advisory activities on best management practice adoption: A case of Québec. Ecological Economics 70: 1363–1374.10.1016/j.ecolecon.2011.02.012
- Tamini, L. D., B. Larue, and G. E. West. 2012. Technical and environmental efficiencies and best management practices in agriculture. Applied Economics 44(13): 1659–1672.10.1080/00036846.2010.548789
- Train, K. E. 2003. Discrete choice methods with simulations. Cambridge, UK: University Press, 334 pp.10.1017/CBO9780511753930
- Wagener, A. 2002. Prudence and risk vulnerability in two-moment decision models. Economics Letters 74: 229–235.10.1016/S0165-1765(01)00541-9