
Abstract
Results are reported from a 3-year monitoring initiative (2010–2013) of stable water isotopes (δ18O and δ2H) at over 50 hydrometric sites in the lower portion of the Nelson River Basin, a key freshwater–marine corridor in Canada with global significance. Data are collected from annual synoptic surveys and a time-series monitoring program. Water isotope signals exhibit significant long-term average (with reported standard deviation) differences between the upper Nelson River (–10.5‰ δ18O ± 0.18‰) and Burntwood River (i.e. Churchill Basin; –12.8‰ δ18O ± 0.4‰) regions which are attributed to the geographic extent and origin of the water. Upper Nelson River flow-isotope signals suggest a more temperate climate, and exhibit reverse seasonal cycling (i.e. ice-on isotope enrichment; ice-off isotope depletion) due to the connectivity with and influence of Lake Winnipeg. In contrast, the Burntwood River behaves like a snowmelt-dominated river heavily influenced by wetland storage and enrichment during ice-off periods, exhibiting isotopic signals negatively correlated with headwater river discharge. Flow-weighted δ18O and δ2H show decreased variability in both regions at extreme low- and high-flow regimes, indicating a tendency towards a single dominant end member: wetland release (low-flow regime) or snowmelt/rainfall (high-flow regime). Mid- to normal-flow regimes exhibit increased isotopic variability, as do small headwater catchments resulting from varied source water contributions, residence times, mixing patterns and the role of landscape-specific features. The Stable Water Isotope Monitoring Network (SWIMN) presented enables the closure of water-isotope mass balance modelling that will facilitate the understanding of changes to freshwater–marine linkages.
Les résultats sont basés sur une étude d’échantillonnage de 3 ans (2010–2013) d’isotopes stables de l’eau (δ18O et δ2H) à plus de 50 stations hydrométriques dans la partie inférieure du bassin de la rivière Nelson, un corridor marin d’eau fraîche du Canada d’importance mondiale. Les données sont tirées d’études synoptiques annuelles et d’un programme de mesure de séries chronologiques. Les signaux relevés dans les isotopes de l’eau montrent des différences significatives dans les moyennes à long terme (avec écart-type) entre les régions du haut de la rivière Nelson (–10.5‰ δ18O ± 0.18‰) et de la rivière Burntwood (c.-à-d. le bassin de Churchill; –12.8‰ δ18O ± 0.4‰) et sont attribuées à l’étendue géographique et à l’origine de l’eau. Les signaux d’isotopes instables du haut de la rivière Nelson suggèrent un climat plus tempéré et démontrent un cycle saisonnier inversé (c.-à-d. que lorsque les eaux sont recouvertes de gel, il y a enrichissement et qu’autrement, il y tarissement) résultant de la connexité avec le lac Winnipeg et de l’influence de ce dernier. À l’opposé, la rivière Burntwood réagit comme une rivière dominée par la fonte des neiges et fortement influencée par le stockage des terres humides et l’enrichissement au cours des périodes où les eaux ne sont pas recouvertes de glace, présentant des signaux isotopiques négativement corrélés avec les eaux d’amont. Les niveaux de δ18O et δ2H pondérés par le débit de l’eau présentent une diminution de la variabilité dans les deux régions lorsque les débits sont extrêmement bas ou élevés, indiquant une tendance vers une source unique : provenant des terres humides (faible débit) ou de la fonte des neiges ou d’averses de pluie (débit élevé). Les débits moyen à normal présentent une augmentation de la variabilité isotopique – comme c’est le cas pour les petits bassins récepteurs d’eau d’amont formés de sources d’eau variées – du temps de rétention, de la composition des sources et du rôle des caractéristiques spécifiques au paysage terrestre. Le Réseau de contrôle des isotopes d’eau stable (SWIMN) présenté ici permet de préserver l’équilibre du bilan massique des isotopes d’eau, ce qui permettra de mieux comprendre les changements dans les liens entre les eaux douces et marines.
Introduction
Recent studies by the Canadian National Hydrometric Network (CNHN) determined that only 12% of Canadian watersheds meet the minimum gauge density recommended by the World Meteorological Organization (WMO), while the remainder of the country is considered either poorly gauged or ungauged (Mishra and Coulibaly Citation2010; Coulibaly et al. Citation2013). Due to difficulties in establishing and maintaining an adequate hydrometric network in Canada, there is a need for additional “soft” data sources (e.g. stable water isotopes and water chemistry data) to facilitate water-mass balance modelling to understand changes in flow regime using minimal gauging or sampling. Stable isotope tracers provide a method for labelling and disaggregating total flow contributions at both local and regional scales, provided isotopic compositions of water sources are well defined and quantified. The operational value of tracers used in conjunction with hydrometric networks has resulted in a global initiative by the International Atomic Energy Agency (IAEA) to develop a Global Network for Isotopes in Rivers (GNIR), and other regional initiatives in Canada and the United States (Coplen and Kendall Citation2000). To accomplish this, more regional Canadian networks, particularly with global water cycle linkage through the Arctic, are required to advance global mapping of isotopic variability, interpolation methods and isotope mass balance modelling efforts (Gibson et al. Citation2010).
The heavy water isotopes of hydrogen and oxygen (2H and 18O) are ideal tracers for “soft” data applications as they exhibit well-understood and systematic changes due to isotopic fractionation during phase changes and diffusion (Posey and Smith Citation1957; Craig Citation1961; Dansgaard Citation1964; Craig and Gordon Citation1965). The use of such complementary data (Fenicia et al. Citation2008) to better understand the variability and complexity of hydrological processes has been extensively explored, primarily through smaller-scale, short-duration studies (reviewed by Kendall and McDonnell Citation1998). These studies have utilized isotopic tracers to facilitate a more comprehensive understanding of water source and residence time, surface-groundwater exchanges, precipitation variability, snowmelt, and evaporation-transpiration processes in both scientific and operational contexts. Emerging across larger spatial scales and time periods, the integration of water isotopes in hydrological modelling has been shown to constrain parameters driving changes in runoff, reducing uncertainty in model predictions (Kuczera Citation1983; Beven and Binley Citation1992; Kuczera and Mroczkowski Citation1998; Siebert and McDonnell Citation2002; Kirchner Citation2003, Citation2006; Dunn et al. Citation2008; Fenicia et al. Citation2008).
The focus of integrated hydrometric-isotope programs has increased over the last decade to include macro-scale (> 10,000 km2) basin analysis. In 2002, the IAEA initiated a Coordinated Research Project (IAEA-CRP) entitled “Design criteria for a network to monitor isotope compositions of runoff in large rivers,” or GNIR, as described in Gibson et al. (Citation2002) and Vitvar et al. (Citation2007). Macro-scale projects have been established in Canada, within the Canadian Arctic (Cooper et al. Citation2008; McClelland et al. Citation2008; Yi et al. Citation2012) and the Canadian tundra (Yi et al. Citation2010). Results from the aforementioned studies demonstrate the utility of the large-scale isotope monitoring networks in Canada for enhancing the understanding of water cycling in remote regions at both regional and continental scales.
Based on the success of previous isotope networks in Canada, the need to improve network coverage across Canada and the inadequacy of hydrometric data in the northern and central regions of Canada, a Stable Water Isotope Monitoring Network (SWIMN) within the lower Nelson River Basin (LNRB) was launched to establish a record of isotope data to supplement existing hydrometric data for hydrologic assessment and modelling purposes. Understanding hydrologic change and variability within the LNRB is essential to the operation of six generating stations (GS) within the basin, totalling 75% of the generating capacity of Manitoba Hydro (MH, a major Canadian hydroelectric utility). The addition of naturally occurring tracers into an existing operational hydrometric program (operated by MH) provides a viable low-cost integration option for improved understanding and efficient water management within a remote, large-scale basin.
This study examines the large-scale application of two major river regimes in a northern Canadian basin using a coupled hydrometric and water isotope approach. The objectives of this study are to investigate: (1) geographic influence and variability in water isotope signals within LNRB rivers, (2) temporal and flux-weighted evolution of source water contributions to streamflow and (3) mixing characteristics occurring within and between river reaches along the Nelson River en route to Hudson Bay, contributing to initiatives within Canada to enhance regional water isotope data in tandem with hydrometric measurements. Data collected will assist water regulators in the LNRB in understanding regional and inter-annual variability, and will provide a comprehensive data set for hydrologic modelling purposes.
Background
Study region
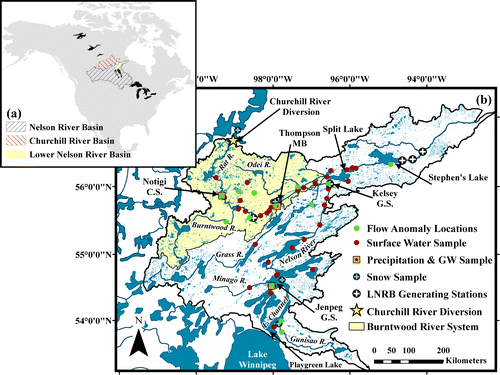
Fresh water from the Saskatchewan River to the west, the Red River to the south and the Winnipeg River system to the east culminates in Lake Winnipeg before it flows north along the Nelson River and drains into Hudson Bay, forming the boundary of the Nelson River basin (Figure a). The LNRB (90,580 km2) is the downstream segment of the Nelson River basin fed by Lake Winnipeg (minimum and maximum discharges from 2010 to 2013 were 1350 to 5615 m3/s, respectively) and discharging to Hudson Bay (Figure b), receiving a majority of the outflow from the drainage area upstream of the Nelson River (970,000 km2). On the northwestern watershed boundary, MH operates the Churchill River Diversion (CRD). Starting in 1977, a portion of the Churchill River Basin (CRB) (license maximum of 850 m3/s) is diverted into the LNRB, regulated at Notigi Lake by the Notigi Control Structure (NCS) on the Rat River, before joining the Burntwood River and entering the Nelson River further downstream at Split Lake (Figure ).
Figure 1. (a) The Nelson River Basin (NRB), Churchill River Basin (CRB) and Lower Nelson River Basin (LNRB) with respect to North America. Watershed boundaries of the NRB, the LNRB and the portion of the CRB from which flow is diverted into the LNRB. (b) The established Stable Water Isotope Monitoring Network (SWIMN) in the LNRB. Locations of the isotope collection sites for the various sources of water are denoted by the indicated symbols. The drainage areas of the major river systems within the LNRB are delineated as marked. Important lakes and rivers are indicated along the main stem of the river or detailed with an arrow. Major rivers and lakes and administrative boundaries are also indicated. Generating stations (GS) are denoted by a circle with a cross in the centre, and the Notigi Control Structure is represented by a star symbol. The Churchill River diversion is indicated with a hollow circle symbol and an arrow. GW: groundwater.
Basin physiography
Situated in the boreal forest, Canadian Shield region of Canada, the LNRB has extremely low relief, with approximately 330 m of topographical relief in the main direction of drainage (south to north). Due to this low gradient, large regions of surface water in the form of small lakes and wetlands are interspersed about the basin in addition to many sections of channelized lakes along the main stems of the Rat and Nelson Rivers (Figure b). Satellite land cover imagery of the basin obtained through GeoBase® (http://www.geobase.ca) indicates that land cover within the LNRB is predominantly coniferous forest of varying densities (34%), followed by a combination of fens and bogs (i.e. connected and disconnected wetlands, respectively; 25%). Shrubland and open water are also prevalent, comprising 16% and 13% of the basin, respectively. The LNRB is located within a sporadic discontinuous permafrost region (10–50% permafrost), predominantly poorly draining fine-grained lacustrine clays, with the most downstream portion of the basin situated in extensive discontinuous permafrost (50–90% permafrost).
Climate and water regime
The LNRB has a continental sub-arctic cool climate as it is located in the subhumid mid-to-high Boreal Ecoclimatic Region of Canada (Ecoregions Working Group Citation1989). Climate normals (1981–2010) from two Class “A” Environment Canada meteorological stations (i.e. stations adhering to WMO standards) within the LNRB are summarized in Table (locations indicated on Figure ). Summers are typically cool and approximately 5 months long with moderate amounts of rainfall (300–500 mm). Winters are very cold, experiencing average daily temperatures below –20°C and –15°C between December and February at Thompson and Cross Lake Jenpeg, respectively.
Table 1. Weather data obtained from the Thompson (Manitoba) Airport station and Jenpeg Generating Station at Cross Lake. Totals and averages are shown for both the study period (January 2010 to October 2013) and climate normals (1981–2010).
During the study period, temperatures were warmest in 2010, while 2011 and 2012 showed similar yet slightly (i.e. 2°) cooler temperatures (Table ). These warmer-than-average winters resulted in less snowfall accumulation (and therefore snowmelt) due to shortened winter periods. The wettest winter during the study period was 2011–2012 with a total snowfall of 182 cm at Thompson and 130 cm at Jenpeg; the driest was 2010–2011 where total snowfall only reached 130 cm at Thompson and 62 cm at Jenpeg. The 2010 and 2011 summers were wet (~135% of normal precipitation) and resulted in high soil moisture content prior to winter freeze-up.
The majority of streamflow in the lower Burntwood and upper Nelson Rivers comes from the CRD and Lake Winnipeg Regulation (LWR) operations, respectively, which govern the Nelson River main stem flow regime. Beginning in May 2011 and throughout the summer of 2011, Jenpeg GS was operated at maximum capacity due to provincial regulation of high water levels on Lake Winnipeg. CRD operations in 2011 showed the opposite trend due to MH significantly decreasing releases through the NCS to mitigate further flooding within the lower Nelson system. The 2012 melt was more gradual than 2011, due to earlier warming and a series of melt and refreeze events throughout March and April that gradually reduced the snowpack. The gauged headwater basins within the LNRB showed varying streamflow response for both timing and magnitude of the 2011 and 2012 spring freshets. In 2013, cooler conditions delayed the start of the melt period by almost 1 month from observations in 2010–2012, and resulted in both a rapid response time for the melt and a reduction in peak runoff. These flow regimes from January 2010 to October 2013 of both the Nelson River near the outlet of Lake Winnipeg, and the Burntwood River, are displayed in Figure .
Figure 2. Total daily precipitation amount from the nearest collection site, daily average streamflow and isotopic composition of oxygen-18 (δ18O) for three locations along each of the Nelson and Burntwood Rivers over the study period. Ice-on periods and snowmelt periods are gray shaded and hatched areas, respectively. Note the different scales for the Nelson and Burntwood River isotopic compositions. G.S., Generating Station; C.S., Control Structure.
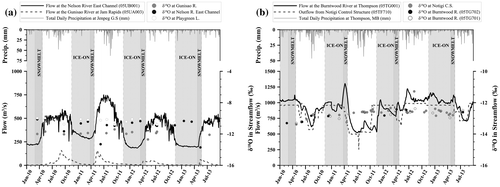
Discharges at NCS are measured from the outlet of the control structure. From Figure , significant correlations between changes in flow and isotopic signature are present and consistent for each location and year of study, indicating isotopic variability is not overly diluted or missed by low-resolution temporal sampling.
Methods
Stable Water Isotope Monitoring Network (SWIMN)
The SWIMN was established at hydrometric gauge locations throughout the LNRB beginning in March 2010. Currently, there are over 50 sites where surface waters from rivers and lakes are sampled, four sites collecting composite isotopes in precipitation, three drive-point piezometers collecting shallow groundwater samples (1.0–1.3m depth) and one Class “A” evaporation pan sampling isotope-enriched surface water (δ*; locations indicated on Figure ). After each precipitation sample is taken, the bucket is emptied and new oil is added to prevent evaporation from occurring. Due to the remoteness of the basin and penetration of frost, winter sampling of piezometers, precipitation buckets and the evaporation pan is not possible. Composite snow samples are collected at five locations within the basin. Starting in 2011, as part of an IAEA-CRP initiative (IAEA Citation2012), depth-dependent snow sampling was incorporated into the program as a means to evaluate best practices for isotope-based snow and snowmelt sampling. Early results indicate that composite snow samples are generally representative of snowmelt compositions in the LNRB (Penna et al. in revision).
Sampling distribution
In addition to sampling during routine hydrometric visits, annual basin-wide synoptic surveys are conducted each summer to provide a snapshot of the isotopic and hydrologic state of the entire LNRB within a 2-day period following the spring freshet (i.e. June or July). Similar to other large-scale river isotope networks, each surface water site is sampled bimonthly on average (6–7 times per year). Precipitation stations (located near cities or at generating stations) are generally sampled at the same frequency as surface water for consistency.
Sampling methods
Site locations were selected based on existing hydrometric maintenance schedules and routes. Field technicians fill two 30-mL water samples in high-density polyethylene Nalgene® bottles at each site from a filled 500-mL sampling bottle attached to an extendable pole that enables sampling from the section of the river experiencing turbulent flow. During ice-on, river and lake samples are collected by auguring through the ice and filling 30-mL sample bottles via a plastic bailer. Grab samples from the near-surface of rivers are considered representative of the isotopic composition of the entire water column so long as flow is turbulent and not within near-shore stagnation zones (Raymond et al. Citation2007). Samples are analyzed by the University of Victoria Environmental Isotope Laboratory managed by Alberta Innovates Technology Futures (AITF) for 2H and 18O. Isotope compositions are analyzed using a Delta V Advantage stable isotope mass spectrometer, using a GasBench II peripheral for δ18O, and an HDevice peripheral for δ2H (Nelson Citation2000). Standardization is accomplished by analyzing in-house internal standards with Vienna Standard Mean Ocean Water (VSMOW2) allowing results to be reported relative to VSMOW as delta (δ) values of per mil (‰). Results are reproducible to ± 0.2‰ and ± 1‰ for δ18O and δ2H, respectively. Additional use was made of the relationship between δ18O and δ2H through the determination of deuterium excess (d-excess) using Equation (1) (Craig Citation1961):(1)
D-excess represents the deviation of isotopic compositions from the global meteoric water line (GMWL), which has a d-excess of 10‰ and corresponds to global patterns of evaporation and condensation of oceanic origin water vapour. Deviations of d-excess from the GMWL are the result of other evaporative conditions influenced by relative humidity, re-evaporation from wetlands, repeated orographic evaporation and condensation over basin and range landscape scales, lake surfaces, and other processes that can imprint d-excess values consistent with the identification of geographical influences (i.e. land cover and topography), moisture source identification and riverine mixing.
Analysis methods
Annual synoptic survey data are used to derive contours of isotopic composition at the time of sampling (Figure ). Similar to other large-scale isotope studies (e.g. Kendell and Coplen Citation2001), interpolation and extrapolation are used to describe isotopic variation throughout the entire basin. Interpolations represent modelled estimates of isotopic signals in rivers or lakes where samples are not collected. Spline interpolation with barriers (i.e. basin boundaries) is used to contour δ18O in streamflow signals. From 2011 to 2013, the number of locations sampled during the synoptic survey increased from 24 to 54 locations to improve spatial distribution throughout the basin. Sampling density is dependent on weather conditions (i.e. wind speed and direction) during the survey, with the maximum sampling coverage at the outlet of Lake Winnipeg downstream to Stephens Lake, and from the Rat River inflow at Southern Indian Lake downstream of the junction of the Burntwood and Nelson Rivers (Figure ).
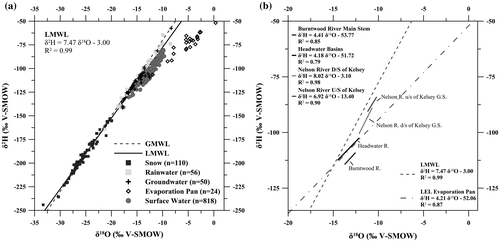
Averaged surface water samples are used with ordinary least squares (OLS) linear regression for rivers within the LNRB on a plot of δ18O versus δ2H (Figure b). Regression lines are derived from mixed surface waters, and will hereafter be referred to as mixing lines. The extent of each mixing line is set by the maximum and minimum weighted value sampled within that reach. The Nelson River is divided into two distinct reaches: Nelson River upstream of Kelsey GS and Nelson River downstream of Kelsey GS. The Burntwood and Grass Rivers join the Nelson downstream of the Kelsey GS spillway where significant mixing of riverine systems occurs.
Figure 3. (a) The global isotope framework for the Lower Nelson River Basin (LNRB) with water sample categories represented by symbols. The number of measurements for each water source (n) is indicated in brackets to the right of the symbol and source water description on the isotope framework. (b) Regression slopes of averaged surface waters within the isotope framework, separated into four different water sources: Nelson River upstream of Kelsey Generating Station (GS), Nelson River downstream of Kelsey GS, Rat/Burntwood River main stem, and headwater basins. Regression lines and equations for the evaporation pan local evaporation line (LEL), and the LNRB Local Meteoric Water Line (LMWL) are displayed. The average isotopic composition of Stephens Lake is also indicated on the figure. GMWL, global meteoric water line; V-SMOW, Vienna Standard Mean Ocean Water.
Results
Isotopic source identification
The isotopic framework developed from data collected over the study period is shown in Figure . Various water sources are denoted by symbols indicating snow, rainfall, groundwater, isotope-enriched waters from the evaporation pan and surface waters (river and lake samples). The number of samples collected from each source, the average (), standard deviation (S) and range (min, max) of δ18O and d-excess are provided in Table .
Table 2. Statistical summary of δ18O and deuterium excess (d-excess) for water sources sampled from March 2010–July 2013 from the SWIMN program. Isotopic averages are not flux- or amount-weighted. The sample mean and standard deviation are represented by the  and S symbols, respectively.
Discharge/level measurement locations are not available for all isotope-sampling locations, so it is not possible to flux-weight all samples. To verify the effect of flux-weighting, isotope-discharge locations are flux-weighted and analyzed against the geometric mean of location composition (δ2H, δ18O and d-excess) with no significant differences among methods found. The egression of evaporation pan samples was described by the following equation: (2)
A slope of 4.2 suggests high amounts of seasonal evaporation and is comparable with the observed local evaporation line (LEL) slopes from lakes and shallow wetlands sampled at similar latitudes across Canada (Gibson et al. Citation2005).
Precipitation samples show substantial variability in isotopic composition, which is typical of mid- to high-latitude regions in Canada (Dansgaard Citation1964; Araguas-Araguas et al. Citation2000; Yi et al. Citation2012) (Figure a, Table ). OLS linear regression of rain and snowpack compositions indicated that the unweighted local meteoric water line (LMWL) for the LNRB is described by the following equation (Figure ):(3)
Since δ2H and δ18O of snowfall are not sampled, weighting by precipitation volume (i.e. the LMWL) would inaccurately skew the composition towards isotope enriched summer rainfall. The LNRB isotopes in precipitation data are consistent, however, with long-term records from the Canadian Network for Isotopes in Precipitation (CNIP; Birks et al. Citation2004; Delavau et al. Citation2011) at Churchill, (δ2H = 7.5*δ18O – 0.5) and the Pas (δ2H = 7.6*δ18O + 0.62), and the LMWL for Canada (δ2H = 7.8*δ18O + 5.2; derived from amount-weighted monthly precipitation; Gibson et al. Citation2005).
Shallow groundwaters sampled at Thompson are consistent with the LMWL (δ2H = 7.56*δ18O +1.15, R2 = 0.98), while samples from Jenpeg and Notigi show more variability, with some samples plotting below the LMWL. This pattern is attributed to the shallow sampling depth at Jenpeg (1.0 m piezometer depth, and assuming that if ponding surrounding the piezometer occurs during wet conditions, the pond waters are sampled) and possible evaporation of shallow soil moisture and/or ponded waters. Notigi similarly shows heavy, isotopically enriched piezometer signals with a similar sampling technique to Jenpeg where the piezometer occasionally floods, potentially causing standing water infiltration and evaporation. Additional variability is seen at the beginning of the year where groundwater samples typically deviate from the LMWL to the GMWL, showing a strong relationship with the measured snowpack composition (i.e. snowmelt signature), as opposed to mid-summer (average values) that appear to be a mixture of summer precipitation and snowmelt.
Isotopic distribution from synoptic sampling
Three synoptic surveys (2011, 2012 and 2013) were conducted within the LNRB to complement ongoing time-series sampling and to provide a regional perspective of the spatial distribution in isotopic compositions across the basin. Synoptic surveys were performed at approximately the same time each year (post-freshet) for interannual comparison of river and headwater basin δ2H and δ18O. In 2011, the survey was conducted at the beginning of June, versus 2012 and 2013 when it was completed in mid-July due to later spring melts.
Sampling earlier in the year shows a greater influence (i.e. homogenized isotopic signature) of heavy isotope-depleted snowmelt contributions from the melting snow pack (Figure a), particularly in headwater basins with lower runoff volumes. Prior to the synoptic survey in 2011, cumulative precipitation within the basin was lower than normal (based on 1981–2010 records) in June, resulting in conditions that were not significantly influenced by rainfall events. An increased sampling density and later survey date in 2012 show spatial trends in streamflow δ18O values emerging for each river and sub-basin system relative to 2011. Samples from upstream, lake-dominated portions of the Nelson system show the same isotopic range as the channelized section of the Nelson River near Thompson (δ18O values of –10 to –11‰), validating the homogeneity in interpolated contours in the 2011 survey. Increased station density in 2012 and 2013 surveys capture progressive downstream isotope enrichment occurring along the Grass River (δ18O values of ranging from –12 to –13‰ up to –11 to –12‰ in 2012 and 2013, respectively), suggesting an increasing influence of evaporation along the flow path from the numerous wetlands in this part of the basin. Interpolated δ18O compositions are generally consistent from year to year, with noticeable differences only in the headwater basin composition. Headwater lakes on the east side of the Nelson River show increased isotope enrichment in 2013 over previous years’ surveys, and a larger extent of isotope-enriched surface waters (δ18O values of –10 to –11‰) within the Nelson River near Lake Winnipeg. Similar isotope distributions were observed in both the Grass River and the headwater rivers north of NCS, indicating persistence of the enrichment trend in both the upper Nelson and Burntwood systems. Some headwater locations in the Burntwood and upper Nelson basins show more depleted isotope compositions in 2013 relative to 2011 and 2012, indicating that timing and retention of snowmelt is highly variable from year to year and persistent for at least 1 month post-freshet. This indicates relatively long residence times and a likelihood for high storage capacities along the headwater basin flow paths. It is important to note that δ18O contours in some headwater basins (notably Minago and Gunisao, Figure ) are the result of extrapolating the isotopic composition of surface waters that are significantly depleted upstream of sampling locations. Although the heavy-isotope depletion is expected in upstream reaches of headwater basins, the increasing magnitude of the depletion cannot be substantiated by the sampling network and is an artefact of the interpolation model. Discontinuities at basin boundaries were anticipated utilizing spline interpolation model with boundaries, and are representative of different basin waters.
Figure 4. Streamflow δ18O contours derived from synoptic surveys of the lower Nelson River basin (LNRB) with measurements at: (a) 24 locations between 7–8 June 2011; (b) 40 locations between 10–11 July 2012; (c) 54 locations between 17–18 July 2013.
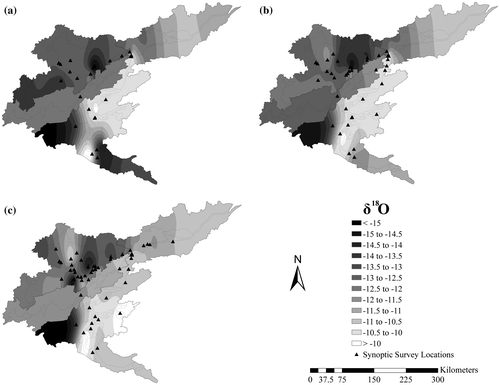
A distinction between headwater tributary and main stem composition is evident in Figure a and Figures a and b, showing the Gunisao tributary as consistently more depleted relative to the main stem upper Nelson at Playgreen Lake and East Channel (except during thehigh stage, where backwater effects and downstream-to-upstream mixing occur). Similarly, the Burntwood main stem (Figure b) shows seasonal ice-on depletion, likely attributed to increased groundwater and baseflow contributions over winter, which is typical of high-latitude isotopic response during ice-on conditions (St. Amour et al. Citation2005; Yi et al. Citation2012). In contrast, the upper Nelson (Figure a) exhibits a seasonal pattern of oxygen-18 enrichment with decreasing ice-on low flow due to the connectivity with late fall evaporatively enriched, under-ice Lake Winnipeg inflows to the upper Nelson system. Similarly, from Figure , regions of open surface water (upper Nelson River near Lake Winnipeg) show an increase in the evaporation/inflow (E/I) ratio (Gibson Citation2002) that results in increased heavy-isotope enrichment over time during drier conditions, prevalent in 2013 (Figure a). The net effect is greater distinction in 2013 between heavy isotope-depleted headwater basins and heavy isotope-enriched main stem rivers relative to the 2011 and 2012 surveys.
Isotopic evolution with flow regimes
Interannual variability in the LNRB is linked to specific processes, which characteristically occur in different flow regimes. Individual isotopic water samples are limited to a single, low-resolution temporal record but flow data can assist in using isotopic variability to diagnose hydrologic end members and end-member mixing. In Figure , δ18O values of surface water compositions from the 13 sites with gauging stations (Figure ) are compared to instantaneous discharge, reported as a discharge anomaly, ΔQ: (4)
Figure 5. Flow anomaly (ΔQ) versus δ18O composition of streamflow for four surface water sources: Nelson River East and main channels, headwater tributaries and the Burntwood River main stem. Averages and standard deviations for each water source and flow condition are as indicated. Extreme events or significant deviations from the average are detailed on the figure.
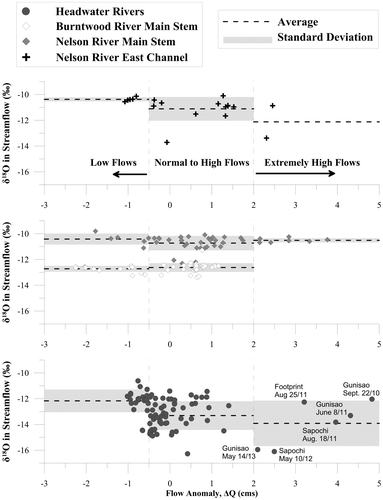
where Qi is the instantaneous average daily streamflow on the day the isotope sample was collected and and S are the average daily streamflow and standard deviation of streamflow over the period of record. Because the method normalizes data, it allows for direct comparison among sampling locations regardless of flow magnitude. Flow anomalies are grouped into three flow regimes, similar to what was done in an analysis conducted by Yi et al. (Citation2010): ΔQ ≤ –0.5 is considered low flow, –0.5 < ΔQ < 2.0 is normal to high flow and ΔQ ≥ 2.0 is extremely high flow. The collection sites are grouped into four water sources for interpretation based on geographic differences noted from the synoptic survey data: Nelson River East Channel, Nelson River main stem, Burntwood River main stem, and headwater basins. Averages and standard deviations for each source and flow condition are indicated by a black dashed line and a shaded gray region, respectively.
Note that similar trends in the variability of δ2H are observed, although only trends in δ18O are presented here (Figure ). Isotopic-flow anomalies show lower (or lowest) variability of oxygen-18 during low-flow regimes (ΔQ ≤ –0.5) across all basins, and higher variability during normal- to high-flow regimes (–0.5 < ΔQ < 2.0) and extremely high-flow regimes (ΔQ ≥ 2.0) in headwater basins. The greatest isotopic variability (both 18O and 2H) occurs in headwater basins and is attributed to differences in basin response time, mixing characteristics and significantly lower runoff volumes which reduce dilution (or averaging) effects observed in main stem rivers. Low-flow regimes tend toward more positive (heavy isotope-enriched) compositions with lower d-excess than baseflow or shallow groundwater discharge (Figure a), whereas normal- to high-flow regimes tend toward slightly less heavy isotope-enriched compositions.
Similar to low-flow events (dominated by pre-freshet), extremely high-flow events along the Nelson main stem exhibit lower isotopic variability but are dominated by measurements collected from the spring freshet. However, unlike the low-flow events (–10.4 ± 0.4‰ for δ18O and –2.0 ± 0.8‰ for d-excess), isotopic composition observed during extremely high-flow regimes show increased variability of d-excess (not shown) while maintaining more consistent δ18O compositions (–10.5 ± 0.2‰ for δ18O and –1.8 ± 1.6‰ for d-excess), consistent with a mix of summer storm flow and freshet events. Headwater basins indicate significant variability in isotopic signal during extremely high-flow regimes, and a positive relationship between increasing flow anomaly and δ18O values (Figure ). This suggests that heavier rainfall events (i.e. as indicated by the date of the high-flow event) also correspond with heavier isotopic compositions, which would be consistent with isolated, convective storm events. During the time frame of this study, the Burntwood main stem was not subject to extremely high-flow conditions; therefore, the isotopic response and associated variability during this flow regime could not be evaluated.
At low- and normal-to-high flows (ΔQ ≤ 2), the Nelson River East Channel shows the least variability, followed by both the Burntwood main stem and Nelson main stem (moderated by Lake Winnipeg), and finally the headwater catchments with the largest variability. The standard deviation of the Burntwood main stem isotopic signal increases during normal-to-high flows, but the average composition remains consistent across all flow regimes (for δ18O, δ2H and d-excess). In contrast, the Nelson main stem average isotopic composition of the low-flow regime is slightly more enriched in δ18O relative to the normal-to-high flow regime (–10.4‰ vs. –10.7‰ main stem; –10.4‰ vs. –11.1‰ East Channel). Unlike low- and extremely high-flow regimes, no discernable temporal period is correlated to this regime or the enrichment. Flow anomalies suggest consistent temporal (seasonal) trends in isotopic variability, and the dominance of single end members at both low- and extremely high-flow regimes. Mid-to-normal flow regimes are expectedly more complex, indicating a myriad of processes and end-member contributions which isotope-mass balance modelling could help to discern.
Discussion
Both major river systems of the LNRB receive water external from the basin (i.e. the CRB for the Burntwood system, and Lake Winnipeg for the upper Nelson), the drainage areas of which deviate in both size and latitude. Large-scale patterns of isotopes in precipitation result in increasing depletion with increasing latitudes relative to the tropics (Dansgaard Citation1964; Bowen Citation2010; Gibson et al. Citation2010). Therefore, it would be expected that CRB inflows would be more depleted relative to the upper Nelson River, which originates at much lower latitudes (i.e. as far south as the Red River basin, 45°N). The Burntwood River shows heavy-isotope depletion and higher d-excess relative to the Nelson River (Figure b), likely resulting from a more northerly drainage area (Figure ). The significant and consistent differences in d-excess between the two main stem systems contributing to the LNRB can also be attributed to differences in the air mass source from which meteoric waters are originally derived (Pacific, Gulf of Mexico, or Arctic) (Birks and Edwards Citation2009).
In conjunction with geographical influence, the variability in flow anomaly and interannual analyses can elicit some understanding of primary source components (i.e. groundwater, snowmelt, surface runoff) contributing to the riverine systems. The Burntwood River basin is the least variable of any of the rivers with consistently low standardized flow. Despite high rainfall recorded within the basin from 2010 to 2012, the river has been neither significantly enriched nor depleted by such rainfall events, indicating an isotopically steady and dominant inflow source from upstream (i.e. Churchill River basin inflows), as well as longer-term storage from lakes or wetlands. The Burntwood and Nelson Rivers have a high percentage of watershed wetland coverage (> 20% for both fens and bogs). Since wetlands attenuate water until they become saturated (or until hydraulic levels decline substantially, as is the case for ice-on discharge), delayed release of water in storage would naturally attenuate any significant precipitation (or snowmelt) events prior to release into the river. Lower-than-average snowfall over the study period (Table ) would act to increase wetland storage availability (Roulet and Woo Citation1986), thereby reducing the influence of direct runoff events. In contrast, the upper Nelson River exhibits more isotopic variability (Figure ), but that is limited due to a direct connection with Lake Winnipeg. Enrichment occurs during the winter, and depletion during early- to mid-summer. Lake Winnipeg water is enriched in late summer and fall due to evaporation (i.e. decreasing in d-excess), which discharges to the upper Nelson system during early onset ice-on conditions (November–March). Large sections of open water during the summer (Figure ) in the upper Nelson River provide increased enrichment downstream of Lake Winnipeg. The appreciable differences in isotopic compositions of the Burntwood and upper Nelson River systems provide traceable mixing characteristics downstream of Split Lake (Figure ).
Operationally, riverine mixing is of interest to understand and separate distinct river contributions (i.e. upper Nelson River and Burntwood River) downstream of Kelsey GS for the purpose of understanding turbulence effects and variability in the long-term flow data. Mixing lines developed from stable isotopes are useful tools for diagnosing characteristics of the contributing systems (i.e. volume of contribution and distance required for complete mixing). In the LNRB, mixing of the Burntwood and Nelson Rivers is evident through both the increase in the slope of a mixing line for the Nelson River downstream of Kelsey, and increased variability of isotopic composition compared to either the Burntwood or Nelson River upstream of Split Lake. Split Lake isotopic compositions are dominated by Burntwood River compositions (more depleted); however, downstream compositions progress toward the ratio of Nelson to Burntwood River flow at Stephens Lake (Figure b). The spatial lag in mixing extent is caused by Split Lake, a non-channelized reach of the Nelson River. The lack of channel definition calms turbulent velocities and limits complete mixing of the Burntwood and Nelson River until flow is restricted to a channelized reach and velocities increase.
At the headwater basin scale, climate and geography affect isotopic compositions, similar to the larger riverine systems. In contrast, however, the headwater basins have the greatest observed variability (Figure ) across flow regimes and interannual variability among the synoptic surveys (Figure ), which offer additional insight into hydrologic processes. Of the headwater basins sampled in the LNRB, few had temporal isotopic variations similar to each other, suggesting that headwater basins have differing dominant end-members that are linked to specific physiographic features within each basin (e.g. land cover). Generally speaking, headwater basins would be expected to be more depleted during the spring due to snowmelt influence, and progressively enriched with ice-off evaporation. Despite occurrences of distinct high-flow events in several headwater basins, significant variability in basin response was noted among the extremely high-flow events (Figure ). The variability is suggestive of possible hysteretic release of heavy-isotope enriched water from storage (i.e. lakes and wetlands) resulting in a mixture of event and pre-event source water that is time lagged (Hayashi et al. Citation2004).
The most significant influence of a headwater basin occurs at the confluence of the Gunisao River and the Nelson River East Channel (average flow addition is 6.78%), which is noticeable in Figure a and Figure . High-flow events on the Gunisao strongly influence the observed δ18O and δ2H in the East Channel (Figure a). Mixing is also observed during low-flow periods, based on the deviation of δ18O in the East Channel from that in Playgreen Lake.
To further identify cause–effect relationships within headwater basins, correlations between isotopic variability and basin physiography (land cover characteristics, residence time and degree of connectivity) should be explored through geographic information system (GIS) or systems-based approaches. These sites are ideal candidates for isotope-mass balance modelling as end members are isotopically distinct, different basins exhibit different characteristic responses and the basins are gauged but unregulated. The capability to continuously simulate both streamflow and isotopic composition using the isoWATFLOOD model (Stadnyk et al. Citation2013) in the LNRB will additionally facilitate continuous records of isotopic variability in response to hydrologic change, enabling a more thorough understanding of hydrologic–isotopic response and reasons for hydrologic change at various scales.
Flow in the LNRB is sustained by contributions from both Lake Winnipeg (i.e. the greater Nelson River Basin) and the CRD (i.e. Churchill River basin), where spatial progression of isotopic composition results from geographical origin, flow conditions, local inflows and the characteristic mixing of river systems. These factors influence isotopic compositions and are identifiable and traceable throughout the LNRB, which would not be possible from flow records alone.
Conclusions
Achieving hydrologic data with adequate spatial and temporal resolution in the LNRB (and many other northern Canadian basins) is generally difficult due to its vast size and the limited access to sampling locations, but there is considerable value in establishing complementary stable water isotope monitoring networks to supplement existing hydrometric measurements. Isotopic data assist in the identification of geographical origin and changes in flow and mixing regimes. The variability of stable water isotopes within the LNRB is strongly dependent on geography, the size of the basin and the characteristic flow regime. Larger rivers in the LNRB exhibit significantly less isotopic variability than smaller headwater basins, caused by the longer flowpaths and residence times. Additionally, mixing characteristics downstream of river confluences exhibiting different isotopic compositions are discernible. This is valuable information for water managers and hydroelectric operators seeking to understand dynamics of the water balance and channel routing mechanisms. To complement hydrologic modelling of the LNRB, and to evaluate reasons for long-term hydrologic change, set-up of a continuous iso-hydrological simulation model (i.e. isoWATFLOOD) within the LNRB is currently underway. Coordinated efforts for the SWIMN will continue for an additional 4 years of data collection to facilitate these modelling efforts, and will result in a continuous 8-year record of hydrometric and isotope data that will be used for model calibration and hydrologic assessments.
Acknowledgements
We would like to first and foremost acknowledge substantial funding for the SWIMN from Manitoba Hydro. This also includes the in-kind contribution of their hydrometric staff in Thompson, Manitoba, for isotope collection and site/equipment maintenance. We would also like to acknowledge the assistance of Water Survey of Canada personnel in Winnipeg and Thompson for collecting isotope samples at various gauges throughout the LNRB. We are also very thankful to the Environmental Isotope Laboratory in Victoria, BC, run by Alberta Innovates Technology Futures, for conducting stable water isotope analysis of the collected waters – in particular, Dr. John J. Gibson and Mr. Paul Eby. We acknowledge the contributions of our reviewers whose valuable input has improved this manuscript significantly. This research was partially funded by Natural Sciences and Engineering Research Council (NSERC) Alexander Graham Bell Canada Graduate Scholarships (CGS).
References
- Araguas-Araguas, L., K. Froehlich, and K. Rozanski. 2000. Deuterium and oxygen-18 composition of precipitation and atmospheric moisture. Hydrological Processes 14(8): 1341–1355.
- Beven, K. J., and A. M. Binley. 1992. The future of distributed models: Model calibration and uncertainty prediction. Hydrological Processes 6(3): 279–298.
- Birks, S. J., and T. W. D. Edwards. 2009. Atmospheric circulation controls on precipitation isotope-climate relations in western-Canada. Tellus Series B – Chemical and Physical Meteorology 61(3): 566–576.
- Birks, S. J., T. W. D. Edwards, J. J. Gibson, R. J. Drimmie, and F. A. Michel. 2004. Canadian Network for Isotopes in Precipitation (CNIP). http://www.science.uwaterloo.ca/~twdedwar/cnip/cniphome.html ( accessed October, 2013).
- Bowen, G. J. 2010. Isoscapes: Spatial pattern in isotopic biogeochemistry. Annual Review of Earth and Planetary Sciences 38: 161–187.
- Cooper, L. W., J. W. McClelland, R. M. Holmes, P. A. Raymond, J. J. Gibson, C. K. Guay, and B. J. Peterson. 2008. Flow-weighted values of runoff tracers (δ18O, DOC, Ba, alkalinity) from the six largest Arctic rivers. Geophysical Research Letters 35(18): L18606.
- Coplen, T. B., and C. Kendall. 2000. Stable hydrogen and oxygen isotopes ratios for selected sites of the US Geological Survey’s NASQAN and benchmark surface-water networks: Open-File Report 00-160. United States Geological Survey.
- Coulibaly, P., J. Samuel, A. Pietroniro, and D. Harvey. 2013. Evaluation of Canadian National Hydrometric Network density based on WMP 2008 standards. Canadian Water Resources Journal 39(2): 159–167.
- Craig, H. 1961. Isotopic variations in meteoric waters. Science 133: 1833–1834.
- Craig, H. and L. I. Gordon. 1965. Deuterium and oxygen-18 variations in the ocean and the marine atmosphere. In Stable Isotopes in Oceanographic Studies and Paleotemperatures, edited by E. Tongiori, 9–130. Spoleto Meeting on Nuclear Geology, Lab. di Geologia, Pisa.
- Dansgaard, W. 1964. Stable isotopes in precipitation. Tellus 16(4): 436–468.
- Delavau, C., T. A. Stadnyk, and S. J. Birks. 2011. Model based distribution of oxygen-18 isotopes in precipitation across Canada. Canadian Water Resources Journal 36(4): 313–330.
- Dunn, S. M., J. Freer, M. Weiler, M. J. Kirkby, J. Seibert, P. F. Quinn, G. Lischeid, et al. 2008. Conceptualization in catchment modelling: simply learning? Hydrological Processes 22(13): 2389–2393.
- Ecoregions Working Group. 1989. Ecoclimatic regions of Canada, first approximation (plus map at 1:750,000). Ottawa, ON: Environment Canada.
- Fenicia, F., J. J. McDonnell, and H. H. G. Savenije. 2008. Learning from model improvement: On the contribution of complementary data to process understanding. Water Resources Research 44(6): W06419.
- Gibson, J. J. 2002. Short-term evaporation and water budget comparisons in shallow arctic lakes using non-steady isotope mass balance. Journal of Hydrology 264: 242–261.
- Gibson, J. J., B. M. Fekete, and G. J. Bowen. 2010. Stable isotopes in large scale hydrological applications. In Isoscapes: Understanding movement, pattern, and process on Earth through isotope mapping, Edited by J. B. West, G. J. Bowen, T. E. Dawson, and K. P. Tu, 389–405. New York: Springer.
- Gibson, J. J., P. Aggarwal, J. Hogan, C. Kendall, L. A. Martinelli, W. Stichler, D. Rank, et al. 2002. Isotope studies in large river basins: A new global research focus. EOS 83(52): 613–617.
- Gibson, J. J., T. W. D. Edwards, S. J. Birks, A. N. St.Amour, W. M. Buhay, P. McEachern, B. B. Wolfe, et al. 2005. Progress in isotope tracer hydrology in Canada. Hydrological Process. 19: 303–327.
- Hayashi, M., W. Quinton, A. Pietroniro, and J. J. Gibson. 2004. Hydrologic functions of wetlands in a discontinuous permafrost basin indicated by isotopic and chemical signatures. Journal of Hydrology 296: 81–97.
- International Atomic Energy Agency (IAEA). 2012. Use of environmental isotopes in assessing water resources in snow, glacier, and permafrost dominated areas under changing climatic conditions: First report for CRP F3.2006. Isotope Hydrology Section, IAEA.
- Kendall, C., and T. B. Coplen. 2001. Distribution of oxygen-18 and deuterium in river waters across the United States. Hydrological Processes 15(7): 1363–1393.
- Kendall, C., and J. J. McDonnell. 1998. Isotope tracers in catchment hydrology. EOS 80: 260.
- Kirchner, J. W. 2003. A double paradox in catchment hydrology and geochemistry. Hydrological Processes 17(4): 871–874.
- Kirchner, J. W. 2006. Getting the right answers for the right reasons: Linking measurements, analyses, and models to advance the science of hydrology. Water Resources Research 42: W03S04.
- Kuczera, G. 1983. Improved parameter inference in catchment models, 2. Combining different kinds of hydrologic data and testing their compatibility. Water Resources Research 19(5): 1163–1172.
- Kuczera, G., and M. Mroczkowski. 1998. Assessment of hydrologic parameter uncertainty and the worth of multi-response data. Water Resources Research 34(6): 1481–1489.
- McClelland, J. W., R. M. Holmes, B. J. Peterson, R. Amon, T. Brabets, L. Cooper, J. Gibson, V. V. Gordeev, C. Guay, D. Milburn, R. Staples, P. A. Raymond, I. Shiklomanov, R. Striegl, A. Zhulidov, T. Gurtovaya, and S. Zimov. 2008. Development of a Pan-Arctic Database for River Chemistry. Eos, Transactions American Geophysical Union 89(24): 217–218.
- Mishra, A. K., and P. Coulibaly. 2010. Hydrometric network evaluation for Canadian watersheds. Journal of Hydrology 380: 420–437.
- Nelson, S. T. 2000. A simple, practical methodology for routine VSMOW/SLAP normalization of water samples analyzed by continuous flow methods. Rapid Communications in Mass Spectrometry 14(12): 1044–1046.
- Penna, D., M. Ahmad, S. J. Birks, L. Bouchaou, M. Brenčič, S. Butt, L. Holko et al. In revision. A new method of snowmelt sampling for water stable isotopes. Hydrological Processes HYP-13-1086.
- Posey, J. C., and H. A. Smith. 1957. The equilibrium distribution of light and heavy water in a freezing mixture. Journal of the American Chemical Society 79(3): 555–557.
- Raymond, P. A., J. M. McClelland, R. M. Holmes, A. V. Zhulidov, K. Mull, B. J. Peterson, R. G. Striegl et al. 2007. Flux and age of dissolved organic carbon exported to the Arctic Ocean: A carbon isotopic study of the five largest arctic rivers. Global Biogeochemical Cycles 21(4): GB4011.
- Roulet, R. T., and M.-K. Woo. 1986. Hydrology of a wetland in the continuous permafrost region. Journal of Hydrology 89(1): 73–91.
- Siebert, J., and J. J. McDonnell. 2002. On the dialog between experimentalist and modeler in catchment hydrology: Use of soft data for multicriteria model calibration. Water Resource Research 38(11): 23.1–23.14.
- Stadnyk, T. A., C. Delavau, N. Kouwen, and T. W. D. Edwards. 2013. Towards hydrological model calibration and validation: Simulation of stable water isotopes using the isoWATFLOOD model. Hydrological Processes 27(25): 3791–3810.
- St. Amour, N. A., J. J. Gibson, T. W. D. Edwards, T. D. Prowse, and A. Pietroniro. 2005. Isotopic time-series partitioning of streamflow components in wetland-dominated catchments, lower Liard river basin, Northwest Territories, Canada. Hydrological Processes 19(17): 3357–3381.
- Vitvar, T., P. K. Aggarwal, and A. L. Herczeg. 2007. Global network is launched to monitor isotopes in rivers. EOS 88(33): 325–326.
- Yi, Y., J. J. Gibson, J. F. Hélie, and T. A. Dyck. 2010. Synoptic and time-series stable isotope surveys of the Mackenzie River from Great Slave Lake to the Arctic Ocean, 2003 to 2006. Journal of Hydrology 383(3): 223–232.
- Yi, Y., J. J. Gibson, L. W. Cooper, J. F. Hélie, S. J. Birks, J. W. McClelland, R. M. Holmes et al. 2012. Isotopic signals (18O, 2H, 3H) of six major rivers draining the pan-Arctic watershed. Global Biogeochemical Cycles 26(1): GB1027.