
Abstract
The 2011 Red River flood event was the third largest event since the operation of major flood control structures in the Province of Manitoba (exceeded by 1997 and 2009), and the fifth largest on record (including 1800s events). However, the flooding experienced on the Red River in 2011 has only an estimated 22-year (James Avenue) to 58-year (Grand Forks, ND) return period. Flooding in 2011 was the result of the second highest soil moisture index ever recorded (in 2010) prior to freeze up, lower-than-normal winter temperatures (causing significant frost penetration), high winter flows and above-average snow cover across the basin. The flood had the potential to be much more severe had it not been for favourable weather conditions within the basin during the spring of 2011. Below-normal precipitation, warm temperatures resulting in high evaporative losses from saturated soils, the non-coincident peak flows of the Red and Assiniboine Rivers, and lower-than-anticipated tributary inflows between Emerson, MB, and the City of Winnipeg mitigated the potential flood peak. The floodway had been expanded after the 1997 flood and further upgrades and maintenance following the 2009 flood allowed an additional 141.6 m3/s of flow to be diverted around the city, resulting in approximately a 0.38-m reduction in the James Avenue water level. The 2011 flood resulted in the fifth highest floodway peak on record, with flood control works in both the Red and Assiniboine systems estimated to have reduced James Avenue stage in the City of Winnipeg by 3.5 m. The majority of data presented in this paper have been taken from the Manitoba 2011 Flood Review Task Force Report and the Red River Floodway Operation Report.
L’inondation de la rivière Rouge en 2011 était la troisième en importance depuis la première utilisation de structures de contrôle des inondations dans la province du Manitoba, après celles de 1997 et de 2009, et la cinquième plus importante jamais enregistrée, incluant celles des années 1800. Toutefois, aux niveaux de l’avenue James et de Grand Forks, au Dakota du Nord, on estime à 22 à 58 ans, respectivement, la période de récurrence d’une telle inondation. L’inondation de 2011 a été le résultat du deuxième indice d’humidité du sol le plus élevé jamais enregistré (en 2010) avant l’englacement, des températures sous la normale saisonnière (causant une importante pénétration de gel), des débits fluviaux hivernaux élevés et une couverture de neige au-dessus de la moyenne sur toute la surface du bassin. L’inondation aurait pu être beaucoup plus dommageable n’eut été des conditions météorologiques favorables à l’intérieur du bassin au printemps 2011. Des précipitations sous la normale et des températures douces favorisant l’évaporation de l’eau contenue dans les sols saturés, les débits de pointe non coïncidents des rivières Rouge et Assiniboine et des affluents moins élevés que prévu au Manitoba, à Emerson et dans la ville de Winnipeg, ont contribué à atténuer le potentiel de crête. L’expansion du canal de dérivation à la suite de l’inondation de 1997 et les travaux d’entretien et d’amélioration effectués après l’inondation de 2009 ont permis d’augmenter de 141,6 m3/s le débit additionnel pouvant être dérivé autour de la ville, permettant ainsi une réduction d’environ 0,38 m du niveau d’eau à l’avenue James. Dans le canal de dérivation, l’inondation de 2011 a produit le cinquième débit de pointe de crue le plus élevé jamais enregistré et on estime que les travaux de contrôle des inondations effectués sur les systèmes des rivières Rouge et Assiniboine ont permis de réduire de 3,5 m le niveau à l’avenue James. La plupart des données présentées dans cet article ont été tirées du rapport Manitoba 2011 Flood Review Task Force Report et du rapport Red River Floodway Operation Report.
Geographical and hydrological setting
The Red River Basin (RRB) drains a portion of the Nelson River Basin extending across southern Manitoba and the north–central United States, emptying into Lake Winnipeg. Along the flowpath, the Red combines with the Assiniboine River drainage basin and several sizeable tributaries (e.g. Pembina, LaSalle, and Seine River; Figure ; Blais et al. this issue). It is one of the largest drainage basins in the Nelson River Basin (116,500 km2), with approximately 30,000 km2 of drainage within Canada; therefore, it is of international significance and has been governed under the International Boundary Waters Treaty (1985) since 1909 (International Boundary Waters Treaty Citation1909; International Joint Commission Citation2014). As a result of it being a trans-boundary basin, flood reporting and computation are, by standard, done in Imperial units by Manitoba officials; therefore, water levels and flows are reported in both SI and Imperial units throughout this paper.
The basin drains a substantial portion of the north–central United States, and the Canadian Prairie and Boreal Plains region, and is characterized as extremely flat with an average basin slope of 0.01%, shallowing to 0.004% from the Canada–US border to Lake Winnipeg (Figure a) (Red River Basin Board [RRBB] Citation2009). At the outlet, Lake Winnipeg has a nominal elevation of 217.6 m, which is approximately 6 m lower than the Red River at Winnipeg across a distance of ~96 km (Manitoba Infrastructure and Transportation Citation2013). Across the entire basin, there is only 69 m of vertical drop across 877 km. Underlain by poorly draining lacustrine materials, the Red River snakes its way across the ancient Lake Agassiz lakebed formed from the retreat of the Laurentide ice sheet at the end of the Wisconsin glaciation period. The Red River itself widens significantly as it flows north along its flowpath, with channel capacity estimated to be 764.5 m3/s at Grand Forks, North Dakota, and 1628 m3/s in Winnipeg, Manitoba (RRBB Citation2009).
Figure 1. (a) Vertical drop across the Red River Basin from headwaters to outlet at Lake Winnipeg, with (b) the location of gauges of interest for the 2011 flood [Canadian Council on Geomatics (Citation2014); uses information licensed under the Open Government Licence, Canada (http://data.gc.ca/eng/open- government-licence-canada)].
![Figure 1. (a) Vertical drop across the Red River Basin from headwaters to outlet at Lake Winnipeg, with (b) the location of gauges of interest for the 2011 flood [Canadian Council on Geomatics (Citation2014); uses information licensed under the Open Government Licence, Canada (http://data.gc.ca/eng/open- government-licence-canada)].](/cms/asset/b9f35cc7-44e3-4eed-8996-a17bbb805b40/tcwr_a_1008048_f0001_b.gif)
The RRB has a semi-arid climate characterized by warm summers and cold winters, dictated largely by the polar jet stream moving from west to east across North America (RRBB Citation2009). Winter snowpack accumulation typically occurs from November until the spring melt in March or April annually. Average annual flows on the Red River range from 94 m3/s to 124 m3/s (at Grand Forks), with spring peak flow typically reaching more than an order of magnitude greater (as is common with many prairie rivers). The Grand Forks, ND station on the Red River is used by Manitoba flood forecasters as a baseline flood level to gauge probable flood levels and severity of flooding during spring melt events.
There are four geographic factors that contribute to the potential for flooding in the Red River valley, including (1) basin gradient, (2) nature of soils within a glacial lake plain, (3) a northward drainage direction and (4) ice jam formation. The Red River has a decreasing downstream gradient with an average channel bed slope of 0.007%, and regions of significantly lower gradient at Grand Forks, ND and Winnipeg, MB (Figure a). The Red River valley also cuts through the glacial Lake Agassiz plain, which means that overbank slopes are low and flooding quickly spreads laterally atop relatively flat and impermeable material. The river’s south-to-north drainage pattern can contribute to the synchronicity of increasing river discharge with progressive spring thaw along the flowpath. This can also increase the possibility of significant ice jam formation should temperatures in the north not warm as fast as temperatures further south, if relatively thick ice remains as the spring freshet arrives (Schwert Citation2009).
Basin regulation and water control
As a result of previous disastrous floods, Manitoba has constructed a system of structural flood control measures (Blais et al. this issue): the Red River Floodway, West Dike, Portage Diversion and Shellmouth Dam. The most significant structural flood control measure is the Red River Floodway, a 47-km-long excavated channel around the City of Winnipeg. The floodway has seen several upgrades in capacity over the years, the most recent after a significant flood event in 2009 (Wazney and Clark this issue), when it was observed that the floodway conveyance had been slightly below the expected design capacity, which was attributed to the growth of tall willows with observed heights of over 3 m. During the winter of 2010/2011, the Manitoba Floodway Authority mowed all the willows from the floodway inlet to a point approximately 37 km downstream of the floodway inlet, and also mowed 50% of the willows for the remaining 10 km of the floodway. A second upgrade as a result of the 2009 flood event lowered the elevation of the west notch to allow water to begin flowing at an elevation of approximately 232.7 m. This was one of three notches that were constructed in the east dike near the floodway entrance during the floodway expansion to allow for additional floodwater to enter the floodway channel.
The second important flood control structure in Manitoba is the Portage Diversion, a 29-km excavated channel on the Assiniboine River, 3 km west of Portage la Prairie, which has a design capacity to convey up to 710 m3/s to Lake Manitoba. A third, smaller flood control structure is the Shellmouth Dam, on the upper Assiniboine River, 24 km northwest of Russell. This dam impounds a 56-km-long reservoir, storing at its full supply level 480 million m3. Red River Community Ring Dikes provide the final structural flood protection element with 18 towns protected, and the majority of individual properties were flood proofed by raising, terracing or ring diking the properties.
Causes of the flood
The Manitoba flood task force reported that in late October 2010, Manitoba was within 1 mm of having its wettest year on record. A unique event, referred to in the media as a “weather bomb”, slammed into Manitoba and a large portion of Canada and the continental US. This event delivered large amounts of precipitation and was provoked by a central pressure drop of 28 millibars over 24 hours, Winnipeg’s lowest ever observed barometric pressure. Extensive damages were incurred on Lakes Winnipeg and Manitoba due to the storm surge and wave setup triggered by >100 km/h wind gusts blowing from the north straight down the lakes. Total storm rainfall in the Province of Manitoba ranged from 50 to 100 mm (Environment Canada Citation2010). The Province was on alert since the “weather bomb” could set the stage for one of the most disastrous spring floods of record, given that many Manitoba lakes and rivers were already at or exceeding maximum water levels or operating ranges where controlled. If coupled with a normal snowpack, or an above-normal snowpack and a quick thaw, the 2011 flood had the potential to be among the most severe on record. By freeze up, soil moisture levels were the second highest since 1949, with only 2009 having higher antecedent moisture levels.
Canadian and US Climate Normals (1981–2010) for Winnipeg and Grand Forks International Airports are summarized in Table , relative to the 2010 and 2011 precipitation totals (mm) and deviation from normal, average annual and seasonal temperatures (°C) and, shown in brackets following temperatures, deviation from temperature Normals (Environment Canada Citation2014; National Oceanic and Atmospheric Administration [NOAA] Citation2014). Temperatures relative to 90% upper and lower confidence bounds, and precipitation relative to 25% and 75% probabilities (not available for Winnipeg station) are summarized in Figure .
Table 1. Summary of 2010–2011 weather data relative to Climate Normals (1981–2010) for Environment Canada’s Winnipeg International Airport meteorological site (ID 5023222), and the National Oceanic and Atmospheric Administration’s Grand Forks International Airport station (ID USW00014916). Antecedent precipitation index (API) is shown for 2011 using standard weights (ωi) for southern Manitoba and monthly precipitation (Pi).
Figure 2. Weather data obtained from the Winnipeg, Manitoba, airport station for 2010–2011 prior to freeze up and throughout the melt season.
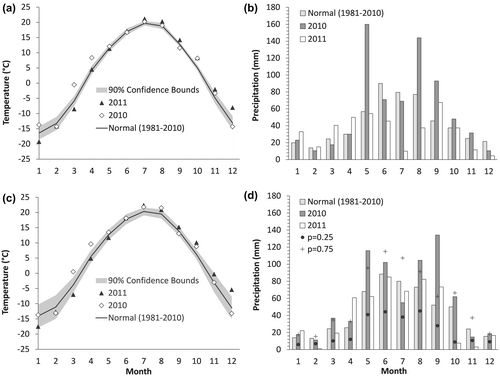
Precipitation in 2010 was significantly higher than reported Normals (>134% on average) across the basin, and continued to exceed Normals (p = 0.75) throughout the spring of 2011 (Figure ). This resulted in very high soil moisture conditions prior to freeze up noted by higher-than-normal antecedent precipitation indices (API), exceeding 150% on average (Table ). Temperatures early in 2011 were colder than Normals, at or below the lower 90% confidence bound (Figure ), which resulted in deep frost penetration. Precipitation (snow accumulation) in early 2011 was at or above Normals on the Canadian side, and at or slightly below Normals in the RRB headwaters and the US portion of the basin (Figure ). In Canada, snowfall totals reached a 15-year high within the RRB. Cooler-than-normal temperatures persisted across the RRB well into spring (mid-April), slowing the rate of melt and delaying the peak flow event. By April, spring rains returned with precipitation totals well above (>75% probability of non-exceedance) reported Normals. Soils were frozen and saturated, and a significant portion of the snowpack remained un-melted due to the cooler-than-normal spring temperatures.
Figure 3. Snow water equivalent (SWE) prior to spring melt in 2011 across the Red River basin [Canadian Cryospheric Information Network (Citation2014); uses information licensed under the Open Government Licence, Canada (http://data.gc.ca/eng/open-government-licence-canada)].
![Figure 3. Snow water equivalent (SWE) prior to spring melt in 2011 across the Red River basin [Canadian Cryospheric Information Network (Citation2014); uses information licensed under the Open Government Licence, Canada (http://data.gc.ca/eng/open-government-licence-canada)].](/cms/asset/8f1593be-2faf-47fb-ac2a-6a485abd976a/tcwr_a_1008048_f0003_oc.gif)
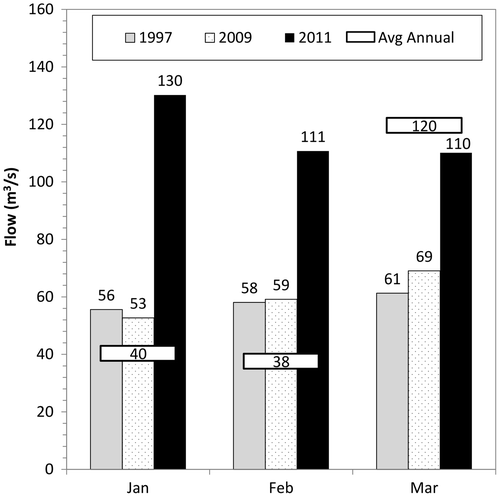
Winter low-flows entering the flood seasons in 2011 were more than double their normal values (defined from average annual flows) for January and February, as a result of high antecedent moisture levels prior to freeze up and above normal precipitation. However, flows had normalized by March due to cooler-than-normal temperatures which delayed the onset of snowmelt (Figure ).
Figure 4. Winter flows recorded on the Red River at Ste. Agathe for 2011 relative to average annual (1961–2012), 2009 and 1997.
The 2011 flood event was therefore initiated by higher-than-normal antecedent moisture conditions within the Red River Valley in 2010 (Table ), above-normal snowfall throughout the RRB over the winter culminating in above-average snow water equivalent prior to the 2011 spring melt, and higher-than-normal winter flows.
Flood timeline
Water levels are reported relative to gauge data, where possible, but these were not universally available. More information on James Avenue gauge water levels is provided in Blais et al. (this issue). Peak flows along the Red River and its tributaries slowly began climbing in March (Figure ). On 25 March, the Province of Manitoba released a median forecast of 6.1 m (20 ft) James Avenue for the City of Winnipeg and an upper decile forecast of 7.3 m (24.1 ft) James. Anything greater than 5.8 m (19 ft) James is considered a “big” event for the City of Winnipeg, as the river begins to overflow the banks at 5.5 m (18 ft; Grant Mohr, personal communication, 26 May 2014). “Normal” summer water levels are considered to be 2 m (6.5 ft) James, with previous large spring events peaking at 6.9 m (22.6 ft) in 2009 and 7.5 m (24.5 ft) in 1997. By early April, the Province of Manitoba declared a high flood risk for six rivers including the Red and Assiniboine.
Figure 5. Peak flow evolution during the 2011 flood.
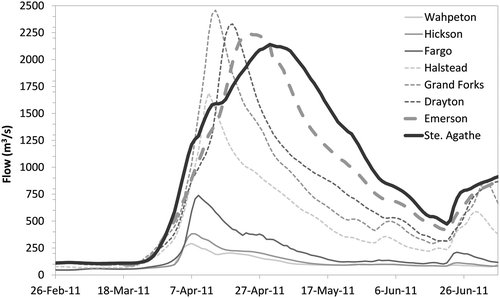
As shown in Table , on 9 April, the Red River peaked in Fargo, ND, at 11.8 m (38.8 ft) or 770 m3/s (27,200 ft3/s). The Red River Floodway began operations at 9:30 am on 9 April, shortly after ice had released upstream of the inlet control structure. The first of two open-water peaks in the City of Winnipeg (James Avenue) occurred later that evening at a water level of 6.3 m (20.6 ft) James, recorded discharge of 1743 m3/s (61,566 ft3/s) and natural discharge of 2143 m3/s (75,669 ft3/s). The Red River peaked in Grand Forks, ND, on 14 April 2011 with the third highest recorded stage of record (surpassed only in 1897 and 1997; National Weather Service Citation2014) at 15.2 m (49.9 ft) and a peak flow of 2477 m3/s (87,500 ft3/s). Ten days later, on 24 April 2011, flows peaked in Emerson, MB at 2270 m3/s (80,164 ft3/s) and 240.9 m (790.4 ft) of stage (note that about 25% of the time, peak flows are lower in Emerson than Grand Forks due to attenuation of peak flows and floodplain storage). Flows reached 2140 m3/s (75,573 ft3/s) at Ste. Agathe, MB (stage of 235.2 m or 771.6 ft), six days later on 30 April 2011. The total volume of spring runoff reached 320 million m3, which was 60% and 78% of the volume of the 1997 and 2009 events, respectively. The 2011 event also ranked third in total stage in the past 150 years behind these events (Figure ). These flows reached a natural peak discharge of 3282 m3/s (115,902 ft3/s) upstream of the City of Winnipeg on 4 May, resulting in a recorded discharge of 1657 m3/s (58,505 ft3/s) through the city and a peak stage of 6 m (19.6 ft) on 5 May, which was 0.3 m (1 ft) lower than the peak stage that occurred on 9 April just as the floodway was put into operation. During this time, the Assiniboine River, which experienced a greater than 1-in-250-year event, crested just 15 days later near the City of Winnipeg.
Table 2. Peak discharges and dates; Fargo, North Dakota, to Winnipeg, Manitoba.
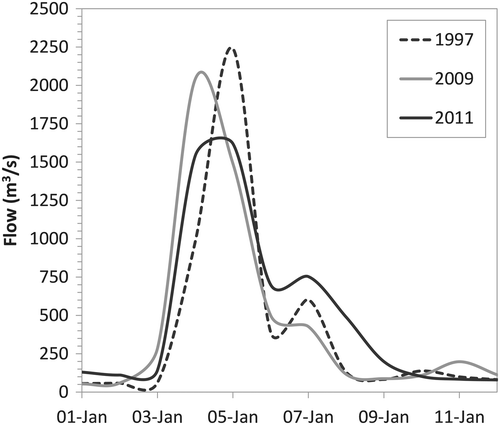
Figure 6. Red River flood events in 2011 at Water Survey of Canada Red River at Ste. Agathe (just before the City of Winnipeg), relative to 1997 and 2009 flood events.
Mitigation of damages by flood control structures
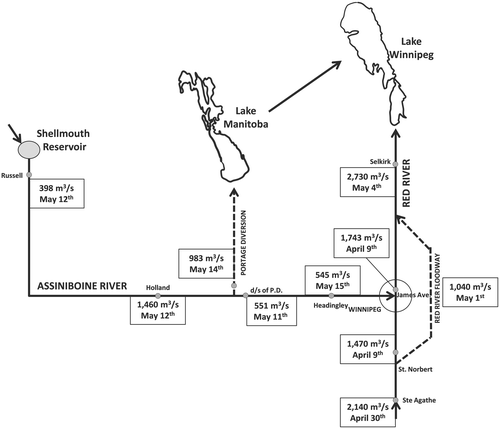
In the spring of 2011, the Red River Floodway was operated for a total of 1303.5 hours over 55 days. The capacity of the floodway was significantly increased due to the willow mowing performed over the winter of 2010/2011. It is estimated that at the peak inlet levels (similar to levels experienced in 2009), approximately 99.1 m3/s (3500 ft3/s) of additional flow entered the floodway compared to 2009, which translated into a benefit of –0.27 m (–0.87 ft) at James Avenue. The spring of 2011 was also the first year in which water entered the floodway through any of the notches created in the east dike near the floodway entrance during the floodway expansion. The lowering of the west notch elevation to approximately 232.7 m (763.5 ft) provided an additional estimated flow of about 42.5 m3/s (1500 ft3/s) into the floodway, translating into a benefit of –0.11 m (–0.38 ft) at James Avenue. The combined effect of the upgrades to the floodway from the lowered notch and willow cutting was an additional 141.6 m3/s (5000 ft3/s) diverted around the city compared to 2009, giving an approximately 0.38 m (1.25 ft) lower water level at James Avenue. A total of 3.2 billion m3 (2.6 million acre-feet) of water was diverted around the City of Winnipeg through the Floodway, with a peak flow of 1040 m3/s (36,700 ft3/s; Manitoba Water Stewardship [MWS] Citation2011). This was the fifth highest peak floodway flow on record since the operation of the floodway began. Figure summarizes the peak flows and dates for the 2011 flood in both the Red and Assiniboine river basins in comparison to those from a design flood prior to the post-1997 flood protection improvements (Figure in Blais et al. this issue). It is estimated that the combination of the Red River Floodway with the operation of the Portage Diversion and Shellmouth Dam reduced the flood crest in the City of Winnipeg by 3.5 m (11.6 ft; MWS Citation2011).
Figure 7. Summary of peak flows and dates for the Red and Assiniboine River basins, and major diversions during the 2011 flood event (adapted from Mudry et al. Citation1981).
Significance of the event
Although stage height and discharge were not as large as those of the 1997 and 2009 events, Figure highlights that the total duration of the 2011 event exceeded that of the other two events, taking nearly 50 days from start of the event to peak flow (Trise), and 210 days to fall (from peak flow to lowest flow before secondary peak, Tfall), with a base length (time from lowest initial flow to when that flow was reached again, Tbase) of 281 days. In contrast, the 1997 and 2009 events had Tbase times of 255 and 276, and took only 34 and 38 days to rise, respectively.
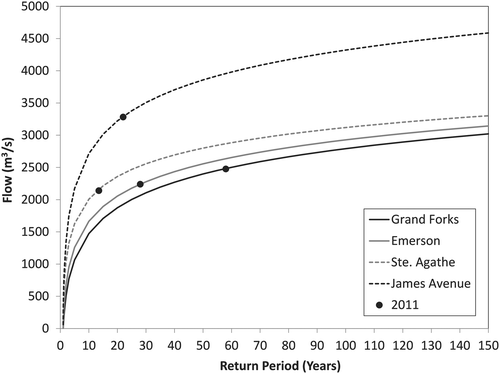
The longevity of the 2011 flood was notable and led to longer-than-normal evacuations and road closures across Manitoba, and a sense that the flood was perhaps more severe than it actually was. Recurrence intervals determined by the authors and plotted for the 2011 Red River event at Grand Forks, Emerson, Ste. Agathe and James Avenue (in Winnipeg) record the 2011 flood as a 1-in-58-year event at Grand Forks, ND, but only a 1-in-28-year event at Emerson and 1-in-14-year at Ste. Agathe (based on a 50-year record that does not include the 1800s reconstructed floods), using a log-Pearson type III distribution (Figure ). At James Avenue, the 2011 Red River flood was a 1-in-22-year event, but included the contribution from the Assiniboine River (prior to the flood peak). It should be noted that although the choice of statistical distribution will slightly alter the absolute return period reported, the pattern and relative magnitudes remain consistent.
Figure 8. Flow frequency curves based on Log-Pearson type III for Grand Forks, Emerson, Ste. Agathe and Winnipeg’s James Avenue relative to recurrence intervals for 2011.
The 2011 flood event, despite being the fifth largest event on record at Emerson and third largest at Ste. Agathe (not including 1800s floods), was not nearly as severe as its potential, for a number of reasons. Beginning in May 2011, weather conditions were “favourable” with no significant rain events and total rainfall actually remained below normal until September. Beginning in June, temperatures were well above normal, resulting in significant amounts of evaporation that helped to decrease soil moisture levels and standing water (Figure ). Peak flows on the Assiniboine River and other major tributaries of the Red flowing from the west did not coincide with the Red River peak in Winnipeg, allowing the river to handle the higher-than-normal 2011 runoff volumes. Tributary flows between Emerson and Winnipeg were lower than anticipated (despite many smaller watersheds to the west experiencing record floods), and runoff originating from North Dakota was also lower than expected. As a result, recorded peak flows were 12% less than forecast at Ste. Agathe.
Conclusions
The 2011 Red River flood was the result of well-above-normal soil moisture conditions resulting from heavy rains in the summer and fall of 2010, above-normal snowfall, colder-than-normal temperatures resulting in deep frost depths and latent frozen soil well into spring freshet, and well-above-normal winter flows. Conditions were right for an even larger flood event; however, these were offset by favourable spring weather, including warm temperatures and below-normal precipitation, which mitigated the flood. Runoff from tributaries between Emerson and the City of Winnipeg was also lower than forecast, contributing to smaller peak flows on the Red River than anticipated. Had conditions been otherwise, the 2011 flood could have been more severe than either the 1997 or 2009 floods.
In the spring of 2011, the Red River Floodway was operated for a total of 1303.5 hours over 55 days. More flow actually entered the floodway in 2011 than in 2009, and improvements and upgrades to the floodway resulted in an additional benefit of –0.38 m (–1.25 ft) of stage at James Avenue. An additional 141.6 m3/s (5000 ft3/s) of flow was diverted around the city compared to 2009, and the combined effect of the Floodway, Portage Diversion and Shellmouth Dam reduced the flood crest in the City of Winnipeg by an estimated 3.5 m (11.6 ft). Despite the magnitude of the 2011 Red River flood, the Floodway was operated only within Rule 1 (of 3) guidelines (MWS Citation2011), suggesting that even if more severe flooding had resulted, the flood protection infrastructure would have been adequate to protect the City of Winnipeg.
Acknowledgements
First and foremost, the authors would like to acknowledge those who worked tirelessly during the flood of 2011 to collect the data necessary for such post-flood analyses, including the Water Survey of Canada and the Province of Manitoba. The authors would like to acknowledge the contribution of Andrew Murray who assisted with collection of the 2011 flood and climate data, as well as Jeremy Greshuk from Golder & Associates for his assistance with the flow duration curves. The authors also acknowledge Grant Mohr from the City of Winnipeg for his insights into flood protection for the city.
References
- Blais, E., S. Clark, K. Dow, W. Rannie, T. Stadnyk, and L. Wazney. 2015. Background to flood control measures in the Red and Assiniboine River Basins. Canadian Water Resources Journal. doi:10.1080/07011784.2015.1036123
- Canadian Council on Geomatics. 2014. Geobase geospatial data. http://www.geobase.ca/geobase/en/index.html ( accessed September, 2014).
- Canadian Cryospheric Information Network. 2014. Snow water equivalent. https://www.ccin.ca/home/ccw/snow/current/swe ( accessed September, 2014).
- Environment Canada. 2010. Canada’s top 10 weather stories for 2010. http://ec.gc.ca/meteo-weather/default.asp?lang=En&n=47397091-1 ( accessed May, 2014).
- Environment Canada. 2014. Canadian Climate Normals. http://climate.weather.gc.ca/climate_normals/index_e.html#1971 ( accessed May, 2014).
- International Boundary Waters Treaty Act. 1909. Justice Laws website., International Boundary Waters Treaty Act (RSC, 1985, c. I-17). Government of Canada. http://laws.justice.gc.ca/eng/acts/I-17/FullText.html ( accessed September, 2014).
- International Joint Commission. 2014. The role of the IJC. International Joint Commission. http://www.ijc.org/en_/Role_of_the_Commission ( accessed September, 2014).
- Manitoba Infrastructure and Transportation. 2013. Manitoba 2011 Flood Review Task Force report. Report to the Minister of Manitoba Infrastructure and Transportation, prepared by Flood Review Task Force, 192 pp.
- Manitoba Water Stewardship (MWS). 2011. Red River Floodway operation report: Spring 2011. Winnipeg: Manitoba Water Stewardship . 29 pp.
- Mudry, N., P. J. Reynolds, and H. B. Rosenberg. 1981. Post-project evaluation of the Red and Assiniboine River flood control projects in the Province of Manitoba, Canada. In Proceedings of the International Commission on Irrigation and Drainage, Special Session R.9, 147–178. Grenoble, Switzerland.
- National Oceanic and Atmospheric Administration (NOAA). 2014. 1981–2010 US Climate Normals and climate data online. National Climatic Data Centre. http://www.ncdc.noaa.gov/ (accessed May, 2014).
- National Weather Service. 2014. Advanced hydrologic prediction service. http://water.weather.gov/ahps2/hydrograph.php?wfo=fgf&gage=EGFM5 ( accessed May, 2014).
- Red River Basin Board (RRBB). 2009. Inventory team report: Hydrology. Red River Basin Board, Moorhead, MN, 76 pp.
- Schwert, D. P. 2009. Fargo ecology: Why is the Red River vulnerable to flooding? North Dakota State University. http://www.ndsu.edu/fargo_geology/whyflood.htm ( accessed May, 2011).
- Wazney, L., and S. Clark. 2015. The 2009 flood event in the Red River Basin: Causes, assessment and damages. Canadian Water Resources Journal. doi:10.1080/07011784.2015.1009949