
Abstract
Flood events in Canada result in larger costs, in terms of property damage, than any other natural disaster. Changes in land use, and more recently the impacts of climate change, can lead to changes in the flood regime. This paper describes research examining changes in the flood regime for watersheds across Canada. To distinguish between changes resulting from land-use changes and those occurring due to changes in climate, the analysis of flood data is conducted only on watersheds that are either part of a formal Reference Hydrologic Network (RHN), or which exhibit RHN-like characteristics. A total of 280 gauging stations have been analyzed for changes to a number of attributes of the flood regime. Changes in the magnitude and timing of flood events as well as the frequency and duration of high-flow events are examined for all 280 sites. Using all 280 sites and different groupings of the sites, based on timing of floods, drainage area and the RHN designation, changes were determined in the annual number of sites at which the flow exceeded the 25-, 50- and 100-year return period events. An examination of the results leads to important insights into the nature of changes that are occurring in the flood regimes in Canada. The results have important implications for the design of hydraulic infrastructure, flood preparedness and the provision of adequate flood protection for populations at risk.
Les inondations au Canada entraînent des coûts plus élevés, en fait de dommages matériels, que toute autre catastrophe naturelle. Les changements qui touchent l’utilisation des terres, et plus récemment les incidences du changement climatique, peuvent donner lieu à des changements dans le régime des crues. La présente communication décrit les recherches qui portent sur les changements touchant les régimes des crues pour les bassins versants à la grandeur du Canada. Pour distinguer entre les changements qui résultent du changement d’affectation des terres et ceux qui sont attribuables au changement climatique, l’analyse des données sur les inondations est menée uniquement pour les bassins versants qui font partie d’un réseau hydrographique de référence (RHR) officiel ou qui présentent des caractéristiques semblables à celles d’un RHR. En tout, 280 stations de jaugeage ont été analysées afin de déterminer les changements qui touchent un certain nombre de caractéristiques du régime des crues. Les changements liés à l’ampleur et au moment des inondations ou qui se rapportent à la fréquence et à la durée des débits élevés sont examinés pour l’ensemble des 280 sites. Grâce à l’étude de la totalité des 280 sites et à différents regroupements des sites, et en fonction du moment des inondations, de la zone de drainage et de la désignation RHR, les changements ont été déterminés dans le nombre annuel de sites où le débit a dépassé une période de récurrence de 25 ans, de 50 ans et de 100 ans. Un examen des résultats jette un important éclairage sur la nature des changements qui sont en train de s’opérer dans les régimes des crues au Canada. Les résultats ont d’importantes répercussions sur la conception de l’infrastructure hydraulique, la préparation aux situations d’urgence liées aux inondations et la lutte contre les inondations pour les populations à risque.
Introduction
Floods in Canada are a common natural hazard with considerable social, economic and environmental consequences. Flood damages can include loss of life, property damage, destruction of infrastructure, social and economic disruption from evacuations, and environmental degradation. The Saguenay, Québec, flood in 1996 was the first natural disaster in Canada with economic damages that exceeded CAD $1 billion. The 1997 Red River “flood of the century” was the worst flooding event in Manitoba since 1852. In 2011, the province of Manitoba was subject to very extensive flooding on the Assiniboine River with costs estimated at CAD $1.2 billion (Manitoba 2011 Flood Review Task Force [MFRTF] Citation2013). The Assiniboine River was again subjected to severe flooding in 2014. Flooding of the Bow and Elbow Rivers in southern Alberta in June 2013 became Alberta’s worst-ever natural disaster, with estimated costs of $6 billion (J. Wood, Calgary Herald, 24 September 2013). There is thus widespread interest in flooding due to evidence that the frequency, magnitude and economic damages from floods have risen in recent years as a result of increased human exposure to flood-prone areas as well as the impacts of climate change (Brooks et al. Citation2001).
Increases in intense precipitation are projected to occur since global air temperature increases are expected to be accompanied by the greater water-holding capacity of a warmer atmosphere; precipitation intensity increases imply increases in flooding potential (Meehl et al. Citation2007; Kundzewicz et al. Citation2014). Major river floods can be caused solely by intense precipitation but, generally, flood generation processes are more complex (Whitfield Citation2012). This is particularly true in Canada where natural factors influencing the magnitude of floods include snowmelt runoff and antecedent soil moisture; changes in these factors may cause flood magnitudes to either decrease or increase (Buttle et al. Citation2015, this issue).
Since there are multiple factors that can lead to changes in the flood regime of a catchment (Whitfield Citation2012), it is important to design a trend analysis study to enable the attribution of any trends found in the data. A Reference Hydrologic Network (RHN) is a collection of gauging stations that have been screened for the influences of regulation, diversions or land-use changes and are considered to have good-quality data. Hence, any changes identified in data from an RHN should be primarily a result of changes in the climatic conditions that contribute to the flood events, thus facilitating trend attribution. Burn et al. (Citation2012) and Whitfield et al. (Citation2012) provide a review of the role of RHNs and their application in climate studies. In Canada, the Water Survey of Canada Reference Hydrometric Basin Network (RHBN) was developed to meet the criteria of an RHN (Brimley et al. Citation1999). Stations from the RHBN are characterized by relatively pristine and stable land-use conditions (less than 5% of the surface modified) with a minimum of 20 years of record and good-quality data. Two types of stations are considered in this study; 107 stations from the RHBN and 173 stations from the Water Survey of Canada archive that have natural streamflow and might be considered equivalent to stations from an RHN. The latter stations are referred to as “RHN-like.” RHN-like stations are considered to have many of the same attributes as stations that are part of an RHN but have not been formally included in an RHN (see, for example, Burn et al. Citation2012).
While floods have several important attributes, many studies (Kundzewicz et al. Citation2005; Cunderlik and Ouarda Citation2009; Burn et al. Citation2010; Adamowski et al. Citation2013) only assess trends in the magnitude and/or timing of the annual maxima series. Trend studies for North America and Europe have analyzed annual maximum flows for minimally altered catchments (Lins and Slack Citation1999; Burn and Hag Elnur Citation2002; Hannaford et al. Citation2013), and some have analyzed the 10-year flood (Lindström and Bergström Citation2004; Schmocker-Fackel and Naef Citation2010). Flood attributes of interest, particularly from the perspective of the assessment of climate and other drivers, include the timing, frequency and magnitude of flood events. In addition to the examination of trends in the magnitude and timing of the annual maxima, this work assesses changes in the frequency and duration of events that are in the top 10% and 0.5% of all observed daily flows at individual stations, namely Q10 and Q0.5. Also examined are trends in the annual number of occurrences, from all 280 sites, of flow events that exceed the flood quantile with return periods of 25, 50 and 100 years for stations grouped by flood timing characteristics, drainage area and whether they are RHN stations or RHN-like stations. For all sites, and for the sites within each group, an assessment was made of whether there was an increase or a decrease in the number of exceedences of each of the three extreme flow quantiles noted above.
Fundamentally, this paper seeks to address the question: Has climate change altered the risk of flooding and has the statistical nature of floods in Canada changed?
Methods
Stations selected were either RHN or could be considered RHN-like. All these stations are unregulated. Data were extracted using the most recent version of Environment Canada Data Explorer. An original list of stations was then filtered to only include those stations that had at least 40 years of data between 1961 and 2010, which resulted in 280 stations. A longer data period was similarly formed with a starting year of 1931 and ending in 2010, which resulted in 30 stations. For both periods, stations were included for analysis only if there were no more than 10 years of missing data within the respective data period. All analyses were performed using a water year from 1 October to 30 September.
R code (R Development Core Team Citation2014) was developed to process the daily flow data files obtained from Environment Canada Data Explorer to extract the annual (water year) maximum series, the series of dates of the annual maximum, and the flow events where the flow exceeded Q10 and Q0.5. The latter two series provided information about the frequency and duration of these larger flow magnitudes. The frequency of exceedences of the flow thresholds was determined by counting, for each year, the number of separate excursions above the threshold of the daily flow series, where an excursion consists of one or more days when the daily flow series exceeds the specified flow threshold. The duration was the total number of days in a year when the daily flow exceeded the threshold.
Quantile exceedences were determined by first fitting a Generalized Extreme Value (GEV) distribution, using the method of L-Moments (Hosking Citation2013), to the annual maxima series for each station. For each year of record, the number of stations at which the annual maxima for that year exceeded the 25-, 50- and 100-year flood quantiles for the station was determined. The number of exceedences of the selected return period flows was determined for the entire set of stations as well as for stations grouped in several different ways, to better explore patterns of changes in the flood regime. Grouping was based on: (1) drainage basin area; (2) the seasonality of the flood response; and (3) RHN versus RHN-like. Grouping by drainage area was selected since different hydrologic processes have been found to operate at different spatial scales (Blöschl and Sivapalan Citation1995; Burn et al. Citation2012). Stations are classified as small (<100 km2), medium (≥100 km2 but <1000 km2) and large (≥1000 km2). The seasonality of the flood response, consisting of the timing and regularity of the flood event (Bayliss and Jones Citation1993; Burn et al. Citation2010), was utilized to classify the catchments into four groups through the use of an agglomerative hierarchical clustering algorithm from the R package “cluster.” Classification into RHN and RHN-like stations was included to look for any differences between results for stations that are part of a formal RHN, in this case the RHBN, and stations that have some RHN characteristics, but have not undergone the same rigorous testing as is the case for RHN stations. These methods for examining quantile exceedences are similar to those presented by Hodgkins et al. (Citation2014).
For the annual maxima series, and the series of dates for annual maxima, trends for individual stations were tested using the Mann–Kendall (Mann Citation1945; Kendall Citation1975) non-parametric test for trend, which has been used in many other studies examining trends in hydroclimatic variables (Burn and Hag Elnur Citation2002; Svensson et al. Citation2005). The R package “fume” was used, which corrects for serial correlation in the data using the approach described by Hamed and Rao (Citation1998). Positive serial correlation in a data set can increase the expected number of false positive outcomes for the Mann–Kendall test (von Storch and Navarra Citation1995), and hence the approach of Hamed and Rao (Citation1998) modifies the variance of the Mann–Kendall statistic to reflect the observed autocorrelation in the data.
Field (or global) significance (Douglas et al. Citation2000) ascertains whether the trend behaviour for a collection of stations is unusual. Field significance is evaluated herein using Walker’s test (Wilks Citation2006). In Walker’s test, if there are K sites for which the (local) significance has been evaluated, then the smallest of the K p-values that have been determined is compared to a critical value that depends on the (global) significance level selected and the number of tests, K. The (global) null hypothesis for Walker’s test is that all K local null hypotheses are true (i.e. there are no significant trends) (Wilks Citation2006). Wilks (Citation2006) provides further background on Walker’s test, compares this test to counting tests and finds that Walker’s test is preferred and will generally not have substantively reduced power relative to alternative tests.
For data that were counts, logistic regressions, employing a binomial assumption for the number of counts, were used to identify changes. Logistic regression is a special case of a generalized linear model (McCullagh and Nelder Citation1989) that can be used to represent the expected value of counts as a function of time (Frei and Schär Citation2001). One of the outputs from logistic regression is an odds ratio, which reflects the relative change in the ratio of the events versus nonevents during the period. The odds ratio is defined as:(1)
where is probability of an event at time t (Frei and Schär Citation2001). Odds ratios greater than 1 indicate a larger number of counts (events) at the end of the record in comparison with the beginning of the record, while values of less than 1 indicate a smaller number of counts at the end of the record in comparison with the beginning of the record. The odds ratios, and their significance, were determined using R code developed by Frei and Schär (Citation2001) and used in Schmidli and Frei (Citation2005). The frequency and duration of exceedences of the Q10 and Q0.5 were treated as count data as were the number of exceedences of the 25-, 50-, and 100-year return period flood events in the groups of stations.
Results
Individual stations
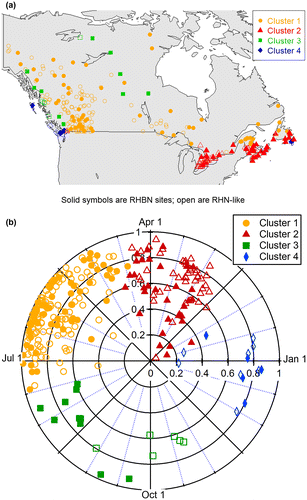
Figure displays the locations of the 280 stations in geographic space (Figure ) and in seasonality space (Figure ). Different symbols are used to depict the four clusters, defined based on the seasonality of the flood response for the station; RHN and RHN-like stations are also displayed using different symbols. In seasonality space, each station is plotted in accordance with the mean date of occurrence of the flood events for the station and the regularity of the flood events. The date of occurrence of an extreme event is defined as a directional statistic by converting the Julian date, where 1 January is day 1 and 31 December is day 365 (or 366), of the occurrence for event i to an angular value using (Burn et al. Citation2010):(2)
Figure 1. (a) The locations of the stations in Canada; solid are Reference Hydrologic Network (RHN) stations and open are RHN-like. The colour of the symbols corresponds to the clustering shown in (b) where hierarchical clustering is based upon timing of flood events.
where is the angular value (in radians) for the date for event i and lenyr is the number of days in a year (365, or 366 in a leap year). From a sample of n events, the x- and y-coordinates of the mean date can be determined using:
(3)
(4)
where and
represent the x- and y-coordinates of the mean event date. The mean event date is then obtained from:
(5)
where MD represents the average date of occurrence of the extreme events for a given catchment. A measure of the regularity of the n extreme event occurrences can be determined from:(6)
where provides a dimensionless measure of the spread of the data. The mean flood date is represented on this polar plot as an angle, measured counterclockwise relative to 1 January, which appears at the “3 o’clock” position. The regularity of the flood events can vary from 0 to 1 and is plotted as the distance from the centre of the polar plot. A regularity of 1 indicates that each flood event in the period of record occurs on the same day of the year, while lower values indicate a greater spread in the day of occurrence of the flood events.
The four clusters in Figure can thus be interpreted in terms of the flood regime of the stations in the cluster. Cluster 1 consists primarily of nival catchments with very regular flood occurrences and mean flood dates corresponding to a snowmelt response. These are primarily located in west and central Canada and the Atlantic Provinces. Cluster 2 consists of stations that are generally less regular in flood response than those in Cluster 1 and have an earlier mean flood date. The catchments in Cluster 2 can thus be considered to reflect a mixed flood regime with snowmelt, rain and rain-on-snow events. These stations are located in southern Ontario and the Atlantic Provinces. Cluster 3 is a smaller group of stations with quite late mean flood dates, which are nonetheless still fairly regular. Many of these stations are located in the north of Canada and in the mountainous parts of BC, and are generally larger catchments. Cluster 4 consists of stations with a mean flood date in the late fall to midwinter time period; these stations display a pluvial flood response, which is consistent with their locations on the east and west coasts of Canada. While drainage area was not explicitly considered in the clustering, the average drainage area of the stations in each cluster does vary considerably; average drainage areas for Clusters 2 and 4 are around 400 and 300 km2, respectively, while Clusters 1 and 3 exhibit much larger values of 12,000 and 18,000 km2, respectively.
Table provides a summary of the percentage of significant trends, at the 5% significance level, for individual stations. The percentage of significant increasing and decreasing trends is provided separately in the table, thus providing both an indication of the number of significant trends and the relative frequency of increasing versus decreasing significant trends. Results are presented for all stations, RHN versus RHN-like stations, and for the four clusters. While trends were calculated separately for the three drainage area sizes, there were no noteworthy patterns in these results, so they have not been included in Table or the subsequent results summaries. Results are presented for the 1961–2010 and 1931–2010 periods and also for the period of record for each station. While common periods of analysis are preferred to avoid the confounding effects of different record lengths for different stations (and hence exposure to different climatic drivers), the period of record analysis was also included to explore the trend characteristics using all of the available data for each of the stations. The results from the latter analysis must be interpreted with caution due to the potential confounding effects noted above. It can be seen from Table that the results for the period of record generally result in the greatest percentage of significant trends and the strongest trend results; this is a product of these series having the longest records.
Table 1. Percentage of stations in different groups that exhibit significant increasing (decreasing) trends at the 5% significance level. The number of stations in each subgroup is shown in the second column (in parentheses).
The magnitude of the annual maximum displays both decreasing and increasing significant trends, with more decreasing than increasing trends. Decreasing trends are concentrated more in Cluster 1 (nival stations) and increasing trends are especially prominent in the pluvial stations (Cluster 4); there are also more increasing than decreasing trends in Cluster 3. Many of the trend results for the magnitude of the annual maximum are field significant for at least the 10% significance level, with the main exceptions occurring for results from the 1931–2010 period.
The results for the timing of the annual maximum show substantially more significant decreasing than significant increasing trends, implying more catchments where the flood event is occurring earlier, as opposed to later, in the year. The earlier flood occurrences are more prevalent in the nival and mixed catchments (Clusters 1 and 2), which is consistent with earlier melting of the snowpack associated with warmer temperatures and less snow accumulation. There is a larger percentage of significant decreasing trends for the RHN stations versus the RHN-like stations, especially for the 1931–2010 period.
There are more increasing than decreasing trends in the number of excursions above Q10 (the flow value that is exceeded by 10% of the observed daily flows). The increasing trends are most prominent in Cluster 2 (mixed flood regime) and Cluster 4 (pluvial regime). This suggests that catchments in these clusters are experiencing an increase in the number of somewhat smaller flood events. For the number of excursions above Q0.5, there are more decreasing than increasing trends during the two common periods. For the period of record analysis, there are more increases than decreases, especially for the pluvial catchments. Many of the results for trends in the number of excursions above Q0.5 are not field significant.
There are both increasing and decreasing trends in the total annual duration of above-threshold occurrences for both Q10 and Q0.5. For many of the clusters, there are fewer increasing trends and/or more decreasing trends for the Q0.5 duration in comparison to the Q10 duration.
For most of the results, the RHN and RHN-like catchments display similar trend behaviour. The exception to this occurs for the 1931–2010 period where there is a marked contrast in the percentage of trends and even the dominant trend direction for RHN versus RHN-like catchments. Contrasts between the behaviour of the RHN versus RHN-like catchments will be explored further below.
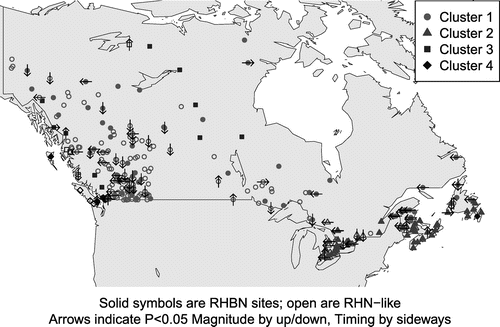
Figure provides a spatial representation of the significant trends in the magnitude and timing of the annual maximum for the 1961–2010 period. Noteworthy from this plot is the collection of sites with earlier flood events for nival catchments in the interior of BC, and for mixed and nival catchments in southern Ontario and eastern Canada. Decreasing flood magnitude trends are concentrated in the nival stations in BC and Alberta as well as mixed catchments in southeastern Ontario. Catchments with increasing trends in magnitude are spatially dispersed in the study area.
Figure 2. Trends in magnitude and timing of floods at individual stations. Solid are Water Survey of Canada Reference Hydrometric Basin Network (RHBN) sites, open symbols are Reference Hydrologic Network (RHN)-like sites as in Figure a. Up/down arrows indicate change in magnitude; left/right arrows indicate earlier or later in time.
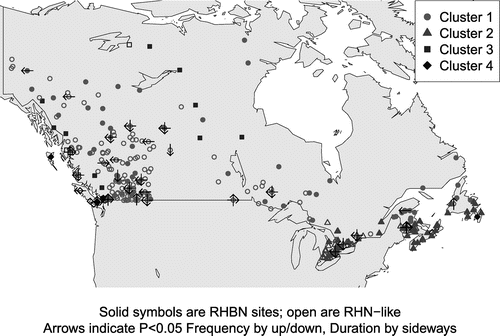
Figures and show changes in flow events in excess of Q10 and Q0.5, respectively, using up/down arrows for increase/decrease in the number of events and right/left arrows for increase/decrease in the total event duration. Figure reveals increases in the number of events in excess of Q10 concentrated in the mixed catchments in southern Ontario, nival catchments in New Brunswick and BC, and pluvial catchments on Vancouver Island. Catchments with decreasing frequency of exceedences of Q10 are located primarily in western and northern Canada and occur for catchments from Clusters 1 and 3. Increases and decreases in durations are noticeable in the nival catchments in BC and Alberta with the decreases more prevalent in the northern part of this region. Increases in duration also occur in the mixed catchments in southern Ontario and Atlantic Canada. Figure reveals, as was also seen in Table , a reduction in significant trends for Q0.5 relative to Q10. This is especially noteworthy for increasing trends in the number of events and the total duration of events, and results, for example, in many fewer increasing trends in the number of events for the nival and mixed flood regimes. This implies that there are more increases in the number of moderate flood events than occur in the more extreme events.
Figure 3. Trends in frequency and duration of flows greater than Q10 at individual stations. Solid symbols are Water Survey of Canada Reference Hydrometric Basin Network (RHBN) sites; open symbols are Reference Hydrologic Network (RHN)-like sites as in Figure a. Up/down arrows indicate change in frequency; left/right arrows indicate shorter or longer duration.
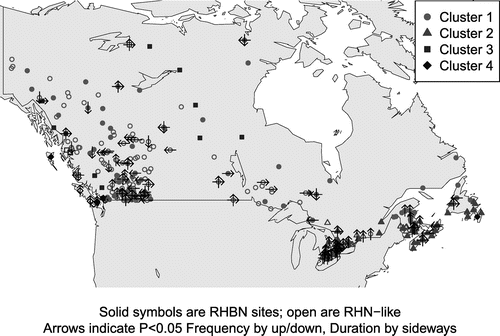
Figure 4. Trends in frequency and duration of flows greater than Q0.5 at individual stations. Solid symbols are Water Survey of Canada Reference Hydrometric Basin Network (RHBN) sites; open symbols are Reference Hydrologic Network (RHN)-like sites as in Figure a. Up/down arrows indicate change in frequency; left/right arrows indicate shorter or longer duration.
While the focus of this work is on trends at a national scale, a preliminary examination was undertaken of trend results for subsets of stations within the largest cluster (nival stations). This exploratory analysis was undertaken since nival is the predominant hydrologic regime in Canada, but is known to have regional differences, particularly with respect to climate (Whitfield and Cannon Citation2000). The results in Table for Cluster 1 (nival stations) were subdivided geographically into north (north of 60° latitude), BC and Alberta, central, and Atlantic Canada. For the annual maximum flow, the north and BC/Alberta results revealed a greater percentage of significant decreasing trends, while central and Atlantic Canada displayed a greater percentage of significant increasing trends in comparison to the aggregate results. For the timing of the annual maximum, there was a greater percentage of significant decreasing trends in Atlantic Canada in comparison to the other regions considered. There was a greater percentage of stations with a significant increasing trend in the number of excursions above Q10 and Q0.5 for the Atlantic region than was observed elsewhere. The only notable results for trends in the total annual duration of above threshold occurrences for both Q10 and Q0.5 was for excursions above Q10 for the central part of the country where a greater percentage of stations with significant increasing trends was noted. The trend results were also examined for differences in terms of watershed drainage area, using catchment sizes of small (drainage area < 100 km2), medium (100 km2 ≤ drainage area < 1000 km2) and large (≥1000 km2). Differences based on drainage area size were noted for medium catchments for the timing of the annual maximum flow (greater percentage of significant decreasing trends, implying earlier flood occurrence) and small catchments for the number of excursions above Q10 and Q0.5 (greater percentage of significant increasing trends). As well, for the total annual duration of above threshold occurrences for Q10, there was an increase in the percentage of significant increasing trends going from small to medium to large catchments, and a decrease in the percentage of significant decreasing trends going from larger to smaller catchments.
It should be emphasized that differences in trend results based on subdivision of the nival catchments by geographic location and drainage area size must be viewed with caution. As the catchments classified as nival are subdivided, the number of catchments in some of the subgroups becomes much smaller, implying that it will be difficult to establish if any differences in trend behaviour noted are actually statistically significant.
Grouped stations
The assessment of trends in the number of exceedences of 25-, 50- and 100-year return period floods for groups of stations are presented in Table . In Table , results are presented for all stations, for RHN and RHN-like stations, and for the four clusters based on streamflow timing and for the two time periods considered, 1961–2010 and 1931–2010. Also in Table are results calculated for the period 1961–2010 for the 30 stations for which data were available for 1931–2010.
Table 2. Odds ratios for counts of threshold exceedances indicating generally increasing number of counts (values greater than 1) or decreasing numbers of counts (value less than 1) – increasing results are underlined.
For the 1961–2010 period, the odds ratio is almost always less than unity, implying decreasing trends in the number of quantile exceedences. The one exception is in Cluster 1 for the 100-year event, which exhibits a positive trend which is not significant (at the 10% significance level). None of the trends are significant at the 5% significance level, and only three outcomes are significant at the 10% significance level (all sites for the 25-year event and Cluster 4 for the 25- and 50-year events). There are no noticeable patterns in terms of RHN status or for the four clusters.
The results for the 1931–2010 period are quite different from the results for the 1961–2010 period, with predominantly increasing trends. Several of these trends are significant at the 5% (or 10%) significance level. Noteworthy is the contrast in the results for the RHN versus the RHN-like stations. The RHN stations exhibit odds ratios greater than unity for all return periods and significant results (5% significance level) for the 50- and 100-year return periods. The RHN-like stations have odds ratios less than unity, indicating decreasing trends, with the 100-year return period result significant at the 10% level. This contrast between RHN and RHN-like stations suggests that some of the RHN-like stations are experiencing changes that are not climate related (e.g. land-use changes or water-use/withdrawal changes). While changes in water withdrawal are unlikely to lead to dramatic changes in flood behaviour, changes to land use may result in changes to the flood regime. While a more fulsome exploration of these impacts is beyond the scope of this paper, these results do reinforce the message from Burn et al. (Citation2012) that care should be taken in selecting stations for inclusion in climate-related trend analyses. The results for the different clusters are fairly similar, with stronger increasing trends noted for Cluster 2 than for Cluster 1. Note that for the longer analysis period, there are no stations for Cluster 4 and only one station in Cluster 3. As a result of having only one station in Cluster 3, there is very low confidence associated with the results for this group and these results therefore cannot be generalized.
The results for the 1931–2010 period are based on the 30 stations that met the data availability criterion for this period, in contrast to the 280 stations for the 1961–2010 period. To further explore the basis for the differences noted between the two periods, the lower part of Table presents results for the 1961–2010 period, but only for the 30 stations that were available for the 1931–2010 period. These results show similar tendencies to the 1931–2010 results, with mainly increasing trends and a similar contrast between the RHN and RHN-like stations. For this latter set of results, none of the trends are significant, even at the 10% significance level. This will be partly due to the shorter data record for these results (50 years) in contrast with the longer analysis period. The results imply that the differences between the 1961–2010 results and the 1931–2010 results are more a reflection of the stations included in the analysis as opposed to the time period examined, although the latter will undoubtedly have had some impact on the results as well.
Discussion
Trends in many of the flood attributes examined in this paper exceed what is expected by chance alone, based on the results of the field significance tests. While there were no noteworthy patterns in the trend results when sites were classified by the size of the catchment drainage area, there were differences in the results based on the four clusters that are meant to capture the flood regimes of the sites. Cluster 1 (primarily nival catchments) displayed significant decreasing trends in both flood magnitude and flood timing. This behaviour is consistent with a reduction in winter snowpack leading to smaller and earlier flood events. Catchments in Cluster 2 (mixed flood regime) exhibit earlier flood events and increases in the number of excursions above the Q10 flow and the total duration of events above Q10. This is consistent with a reduction in snowmelt events and an increased importance of pluvial contributions to flood events. Cluster 3, which consists of catchments with nival-like responses, has more increases than decreases in the flood magnitude. Cluster 4 (pluvial regime) has increases in the annual flood magnitude and in the number of excursions above both Q10 and Q0.5. These results suggest that the pluvial catchments are experiencing increased flood risk, likely related to increases in heavy or extreme precipitation events.
Whether a station is part of a reference hydrologic network or not has an effect on the results. RHN-like stations generally have proportionally more significant trends than do RHN stations. The contrast between RHN and RHN-like stations is particularly noticeable for the 1931–2010 period and for the counts of exceedences of the 25-, 50- and 100-year events. The differences in results based on RHN status suggest that drivers other than climate are affecting streamflow for at least some of the RHN-like catchments. To be informative about climate-driven flood trends, monitored streams need to be relatively free of confounding human influences such as catchment land-use change, diversions, abstractions and reservoir regulation (Burn et al. Citation2012; Whitfield et al. Citation2012); however, a minority of published streamflow trend studies worldwide have separated the effects of human alterations from those of climate (Burn et al. Citation2012).
The historical period and number of gauges are important when analyzing trends. Despite records overlapping by up to 50 years, different patterns of change were detected between the two time periods considered. The limited number and distribution of gauges available for the longer period may be partly responsible for these differences; however, these differences persisted when only the gauges that occurred in both the 1961–2010 and 1931–2010 periods were compared for the same time period (1961–2010).
Milly et al. (Citation2002) examined trends in the 100-year return period flow for 29 catchments worldwide that were larger than 200,000 km2; catchments were included regardless of the degree of human alteration, under the assumption that using a large flood threshold would reduce any distortion of the results by non-climatic factors. Warmer temperatures can either reduce flood risk by decreasing snowmelt runoff, or increase flood risk by increasing effective catchment area through elevational shifts in the snowline (Hamlet and Lettenmaier Citation2007). Despite these complexities, studies generally suggest that an increase in flood magnitude and frequency in many parts of the world will occur under future anthropogenic climate change scenarios (Hiryabashi et al. Citation2013; Arnell and Gosling Citation2014), which is expected to lead to major economic costs (Jongman et al. Citation2014). This projected increase contrasts with the lack of evidence for past trends in observed floods at the global scale (Intergovernmental Panel on Climate Change Citation2013; Kundzewicz et al. Citation2014).
There is very little evidence of increases in the number of catchments experiencing an exceedence of the 25-, 50- or 100-year flow quantile, although the results for the 1931–2010 period do show generally increasing trends for the limited number of stations (30) with data for this period. Hence, for Canadian catchments, climate change is not expected to lead to widespread increases in extreme flow quantiles, especially for nival, and to a lesser extent mixed, flood regimes. As noted by Whitfield (Citation2012), changes in the flood regime are complex, especially for catchments for which pluvial events are not the primary flood-generating mechanism. Hodgkins et al. (Citation2014) reported similar results, with only a few significant changes in major floods, but no consistent pattern, for 1200 stations from North America and Europe, where they grouped catchments by drainage area size and by Köppen–Geiger climatological zones.
Other studies have demonstrated the influence of multi-decadal variability on trends over this period, particularly low-frequency variability associated with the North Atlantic Oscillation (Hannaford et al. Citation2013) or the Pacific Decadal Oscillation (Mantua and Hare Citation2002). This is an avenue for future work.
Floods occur as the result of a wide variety of generating mechanisms and scales (Blöschl and Sivapalan Citation1995; Buttle et al. Citation2015, this issue). Small watersheds are more susceptible to increases in localized and short-duration rainfalls, while changes in development of snowpack and subsequent rain-on-snow events affect a wider range of catchments, particularly in cold and mountainous areas. Similar trends are not observed in larger catchments, which dominate in the Canadian hydrometric network, where the spatial variability in the precipitation signal is smoothed out across the larger area. While the majority of groupings considered did not have clear ubiquitous trends, changes in the probability of an event are as important as any change in magnitude.
Conclusions
Changes are occurring in the flood regimes in Canada, and further changes can be expected in the future as a result of the impacts of climate change. The nature and strength of these changes are different for different flood-generating mechanisms, with generally decreasing flood magnitudes in nival catchments, increasing flood magnitudes in pluvial catchments, and a possible increased importance of pluvial flood-generation processes in mixed-regime catchments with a corresponding decreased importance of snowmelt events. The drainage area of a catchment was not observed to have an important impact on the nature or strength of the trends in the flood attributes examined herein, although this result may be partly a reflection of the generally large catchments in the Canadian database. The differences noted in the trend results between catchments that are part of a formal RHN and catchments that exhibit RHN-like characteristics emphasize the importance of considering RHN status when interpreting the results from trend studies. The complexity of the changes noted in flood response in this work implies that a complete understanding of changes in flood behavior requires a comprehensive analysis using multiple flood attributes applied to catchments with different flood-generating processes.
Acknowledgements
The analyses were performed in R (R Development Core Team Citation2014) using the contributed packages. The authors express their appreciation to the developers and maintainers of R and R Packages and to our colleagues who shared code with us (Glenn Hodgkins and Benjamin Renard). This research was partially supported by funding from the Natural Sciences and Engineering Research Council of Canada (NSERC). The authors acknowledge the helpful comments from two anonymous reviewers.
References
- Adamowski, J., K. Adamowski, and A. Prokoph. 2013. Quantifying the spatial temporal variability of annual streamflow and meteorological changes in eastern Ontario and southwestern Quebec using wavelet analysis and GIS. Journal of Hydrology 499: 27–40.
- Arnell, N. W., and S. N. Gosling. 2014. The impacts of climate change on river flood risk at the global scale. Climatic Change. doi:10.1007/s10584-014-1084-5.
- Bayliss, A. C., and R. C. Jones. 1993. Peaks-over-threshold flood database: Summary statistics and seasonality. IH Report No. 121. Wallingford, UK: Institute of Hydrology.
- Blöschl, G., and M. Sivapalan. 1995. Scale issues in hydrological modelling: A review. Hydrological Processes 9: 251–290.
- Brimley, B., J.-F. Cantin, D. Harvey, M. Kowalchuk, P. Marsh, T. M. B. J. Ouarda, B. Phinney, et al. 1999. Establishment of the reference hydrometric basin network (RHBN) for Canada. Ottawa, ON: Environment Canada. 41 pp.
- Brooks, G. R., S. G. Evans, and J. J. Clague. 2001. Flooding: A synthesis of natural geological hazards in Canada. In Geological Survey of Canada Bulletin, ed. G. R. Brooks, 101–143. Ottawa: GSC.
- Burn, D. H., and M. A. Hag Elnur. 2002. Detection of hydrologic trends and variability. Journal of Hydrology 255: 107–122.
- Burn, D. H., J. Hannaford, G. A. Hodgkins, P. H. Whitfield, R. Thorne, and T. J. Marsh. 2012. Hydrologic Reference Networks II. Using Reference Hydrologic Networks to assess climate driven changes in streamflow. Hydrological Sciences Journal 57: 1580–1593.
- Burn, D. H., M. Sharif, and K. Zhang. 2010. Detection of trends in hydrological extremes for Canadian watersheds. Hydrological Processes 24: 1781–1790.
- Buttle, J., D. Allen, D. Caissie, B. Davison, M. Hayashi, D. Peters, J. Pomeroy, et al. 2015. Floods and flood processes in Canada. Canadian Water Resources Journal.
- Cunderlik, J. M., and T. M. B. J. Ouarda. 2009. Trends in the timing and magnitude of floods in Canada. Journal of Hydrology 375: 471–480.
- Douglas, E. M., R. M. Vogel, and C. N. Kroll. 2000. Trends in flood and low flows in the United States: Impacts of serial correlation. Journal of Hydrology 240: 90–105.
- Frei, C., and C. Schär. 2001. Detection probability of trends in rare events: Theory and application to heavy precipitation in the Alpine region. Journal of Climate 14: 1568–1584.
- Hamed, K. H., and A. R. Rao. 1998. A modified Mann-Kendall trend test for autocorrelated data. Journal of Hydrology 204: 182–196.
- Hamlet, A. F., and D. P. Lettenmaier. 2007. Effects on 20th century warming and climate variability on flood risk in the western US. Water Resources Research 43: W06427.
- Hannaford, J., G. Buys, K. Stahl, and L. M. Tallaksen. 2013. The influence of decadal-scale variability on trends in long European streamflow records. Hydrology and Earth System Sciences 17(7): 2717–2733.
- Hirabayashi, Y., R. Mahendran, S. R. Koirala, L. Konoshima, D. Yamazaki, S. Watanabe, H. Kim, and S. Kanae. 2013. Global flood risk under climate change. Nature Climate Change 3: 816–821.
- Hodgkins, G. A., P. H. Whitfield, J. Hannaford, D. H. Burn, B. Renard, K. Stahl, A. Fleig, et al. 2014. Historical changes in the annual number of large floods in near-natural catchments across North America and Europe, 1931–2010. Geophysical Research Abstracts 16: EGU2014-8433.
- Hosking, J. R. M. 2013. Regional frequency analysis using L-moments. R package, version 2.5. Available from: http://CRAN.R-project.org/package=lmomRFA (accessed April, 2014).
- Intergovernmental Panel on Climate Change. 2013. The physical science basis. Working Group I contribution to the fifth assessment report of the Intergovernmental Panel on Climate Change – Abstract for decision-makers. Geneva, Switzerland: IPCC.
- Jongman, B., S. Hochrainer-Stigler, L. Feyen, J. C. J. H. Aerts, R. Mechler, W. J. W. Botzen, L. M. Bouwer, et al. 2014. Increasing stress on disaster-risk finance due to large floods. Nature Climate Change 4(4): 264–268.
- Kendall, M. G. 1975. Rank correlation methods. London: Griffin.
- Kundzewicz, Z. W., D. Graczyk, T. Maurer, I. Pinskwar, M. Radziejewski, C. Svensson, and M. Szwed. 2005. Trend detection in river flow series: 1. Annual maximum flow. Hydrological Sciences Journal 50: 797–810.
- Kundzewicz, Z. W., S. Kanae, S. I. Seneviratne, J. Handmer, N. Nicholls, P. Peduzzi, R. Mechler, et al. 2014. Flood risk and climate change: Global and regional perspectives. Hydrological Sciences Journal 59: 1–28.
- Lindström, G., and S. Bergström. 2004. Runoff trends in Sweden 1807–2002. Hydrological Sciences Journal 49(1): 69–83.
- Lins, H. F., and J. R. Slack. 1999. Streamflow trends in the United States. Geophysical Research Letters 26(2): 227–230.
- Manitoba 2011 Flood Review Task Force (MFRTF). 2013. Report to the Minister of Infrastructure and Transportation. Winnipeg, MB: Manitoba Infrastructure and Transportation.
- Mann, H. B. 1945. Nonparametric tests against trend. Econometrica 13: 245–259.
- Mantua, N. J., and S. R. Hare. 2002. The Pacific Decadal Oscillation. Journal of Oceanography 58(1): 35–44.
- McCullagh, P., and J. A. Nelder. 1989. Generalized linear models. 2nd ed. Monographs on statistics and applied probability, No. 37. London: Chapman and Hall, 511 pp.
- Meehl, G. A., T. F. Stocker, W. D. Collins, P. Friedlingstein, A. T. Gaye, J. M. Gregory, A. Kitoh, et al. 2007. Global climate projections. In IPCC, 2007: Climate change 2007: The physical science basis. Contribution of Working Group I to the fourth assessment report of the Intergovernmental Panel on Climate Change, eds. Solomon, S., D. Qin, M. Manning, Z. Chen, M. Marquis, K. B. Averyt, M. Tignor and H. L. Miller, 747–845. Cambridge: Cambridge University Press.
- Milly, P. C. D., R. T. Wetherald, K. A. Dunne, and T. L. Delworth. 2002. Increasing risk of great floods in a changing climate. Nature 415: 514–517.
- R.Development Core Team. 2014. R: A language and environment for statistical computing. Vienna, Austria: R Foundation for Statistical Computing.
- Schmidli, J., and C. Frei. 2005. Trends in heavy precipitation and wet and dry spells in Switzerland during the 20th century. International Journal of Climatology 25: 753–771.
- Schmocker-Fackel, P., and F. Naef. 2010. More frequent flooding? Changes in flood frequency in Switzerland since 1850. Journal of Hydrology 381: 1–8.
- Svensson, C., Z. W. Kundzewicz, and T. Maurer. 2005. Trend detection in river flow series: 2. Flood and low-flow index series. Hydrological Sciences Journal 50: 811–824.
- von Storch, H., and A. Navarra ed. 1995. Analysis of climate variability. New York: Springer-Verlag.
- Whitfield, P. H. 2012. Floods in future climates: A review. Journal of Flood Risk Management 5: 336–365.
- Whitfield, P. H., D. H. Burn, J. Hannaford, H. Higgins, G. A. Hodgkins, T. Marsh, and U. Looser. 2012. Hydrologic Reference Networks I. The status of National Reference Hydrologic Networks for detecting trends and future directions. Hydrological Sciences Journal 57: 1562–1579.
- Whitfield, P. H., and A. J. Cannon. 2000. Recent variations in climate and hydrology in Canada. Canadian Water Resources Journal 25: 19–65.
- Wilks, D. S. 2006. On “field significance” and the false discovery rate. Journal of Applied Meteorology and Climatology 45: 1181–1189.