
Abstract
Wildfire is a critical process shaping the structure and composition of forest landscapes of western Canada. Spatially-explicit forest disturbance history and forest structure estimated using remotely-sensed data enables the characterization of burn probability, defined as the susceptibility of landscapes to fire hazard over time. In this research, we leveraged the Landsat archive to determine the capacity of land cover, forest structure, and forest disturbance information, together with ancillary data, to estimate burn probability. We analyzed the interactions between a number of contributing factors and identified landscapes with high probability to burn across forested ecosystems of Saskatchewan, Canada. Overall, we found that forests composed of coniferous species, with shorter trees (<3 m), low canopy height variability, an open stand structure (<10% canopy cover), and low timber volumes (<50 m3/ha), had higher burn probabilities. A 2015 burn probability map indicated that forests that did burn in 2015 (determined using independently mapped wildfires) had a median predicted burn probability of 81%, while the median burn probability for unburned forest area was 19%. This paper demonstrates the potential to generate detailed and spatially-explicit burn probability maps from time series remote sensing data to inform wildland fire risk modeling, management, and mitigation.
RÉSUMÉ
Les feux de forêt façonnent la structure et la composition des paysages forestiers de l’Ouest canadien. L’historique des perturbations forestières sur le plan spatial et la structure forestière estimée à l’aide de données de télédétection permettent de caractériser la probabilité de combustion, définie comme la susceptibilité des paysages aux risques d’incendie au fil du temps. Dans cette recherche, nous avons tiré parti des archives de Landsat et de données auxiliaires pour déterminer la capacité de l’information sur la couverture terrestre, la structure forestière et les perturbations forestières d’estimer la probabilité de combustion d’une forêt. Nous avons analysé les interactions entre un certain nombre de facteurs contributifs et identifié des paysages ayant une forte probabilité de brûler dans les écosystèmes forestiers de la Saskatchewan, au Canada. Dans l’ensemble, les forêts composées de conifères, avec des arbres plus courts (3 m), une faible variabilité de leur hauteur, une structure de peuplement ouverte (10% de couverture) et de faibles volumes de bois (50 m3/ha), présentent des probabilités de combustion plus élevées. La carte de probabilité de combustion établie pour 2015 indique que les forêts qui ont brûlé effectivement en 2015 (selon une cartographie des feux de forêt déterminée indépendamment) ont une probabilité de combustion médiane de 81%, tandis que la probabilité pour la zone forestière non brûlée est de 19%. Cet article démontre le potentiel de générer des cartes détaillées et explicites des probabilités de combustion à partir de séries temporelles d’images satellitaires afin de faciliter la modélisation, la gestion et l’atténuation des risques d’incendie dans les forêts sauvages.
Introduction
Wildfire is considered the most dominant disturbance agent in western Canada (Flannigan et al. Citation2005; Wang et al. Citation2015; Wotton et al. Citation2017), regulating landscape structure, species diversity, forest development stage, as well as carbon and hydrological cycles (Kasischke and Stocks Citation2000; Wotton et al. Citation2010; de Groot et al. Citation2013). Recent estimates suggest that over a 30-year period, the mean annual area burned in Canada’s forested ecosystems for the period 1985–2015 was greater than 1.6 Mha, but varied markedly with large fire years often dominating the long-term trend (σ = 1.1 Mha; Coops et al. Citation2018). Under a changing climate, a number of wildfire characteristics such as area burned, size, occurrence, and seasonality are expected to change as weather becomes more fire conducive (Boulanger et al. Citation2014; Xi et al. Citation2019; Whitman et al. Citation2019), although the increase in area burned is expected to be gradual (Price et al. Citation2013). Already, there is some evidence of recent shifts in area burned consistent with these warmer climate patterns (Kasischke et al. Citation2010). As a result, scientists and policy makers are increasingly concerned with the dynamics and mechanics of forest fires, fire-induced ecosystem changes, as well as implications to forest management, especially with regard to carbon cycle and risk mitigation policies (Taylor et al. Citation2013; San-Miguel et al. Citation2017).
The factors that drive the probability, behavior, and effects of wildland fires are spatially and temporally variable (Gralewicz et al. Citation2012; Xi et al. Citation2019). The occurrence of fire can be attributed to weather and climate (Flannigan and Harrington Citation1988), the availability of fuel (Romme Citation1982; Finney Citation2001), and ignition sources, such as lightning (Malamud et al. Citation2005), as well as anthropogenic influences including accidental and intentional ignitions (Rollins et al. Citation2001). While the factors are well known, the stochastic nature of fire occurrence associated with local conditions including surface moisture and wind, are difficult to predict. In addition to wind and daily fire weather, landscape fuel conditions play a significant role in fire spread once ignited (Cheney et al. Citation1998; Fernandes Citation2001). These fuel conditions include the vegetation types as well as the spatial heterogeneity of these landscape characteristics, such as vegetation species and forest age (Ryu et al. Citation2007).
To understand the susceptibility of a landscape to fire hazard over a given period of time, burn probability models have been developed, encompassing a range of drivers, such as climate, topography, vegetation, and weather (Parisien et al. Citation2005; Finney et al. Citation2011). These models typically employ a simulation approach to quantitatively estimate the probability of burning in a spatially-explicit manner (Wang et al. Citation2016). For example, the Burn-P3 model (Parisien et al. Citation2005) makes use of an existing fire database and simulates the ignition and spread of fires over a large number of years. As a result, a burn probability surface can be derived from the frequency with which each grid cell burns over years of simulation. Burn probability models are sensitive to quality of input data, especially spatially-explicit fuel information, which has been reported as the most critical variable governing spatial patterns of burn probability (Parisien et al. Citation2013). Given that detailed, up-to-date, and accurate fuel data might not be available over large areas (Parisien, Dawe, et al. Citation2020), classifications are typically carried out to convert generic vegetation maps into fuel maps (Parisien et al. Citation2013). Statistical or machine learning models have also been used, to some extent, to model burn probability or burned areas, often at regional to continental scales (Moritz et al. Citation2012; Parisien et al. Citation2014; Davis et al. Citation2017). As a consequence, these models typically use open access vegetation products at coarse spatial resolutions to characterize vegetation, such as those derived from MODIS (Moderate Resolution Imaging Spectroradiometer) or AVHRR (Advanced Very-High-Resolution Radiometer). Additionally, these vegetation products, such as spatially generalized forest cover (Davis et al. Citation2017) or net primary productivity (Moritz et al. Citation2012) may not characterize fuel conditions with sufficient locational or categorical accuracy or to the extent possible with newly available datasets.
A variety of technologies and data sources have been used to map fire occurrence and spread across Canadian boreal forests, including GPS (i.e. fire boundaries recorded from aircraft), aerial photography, and satellite imagery (Stinson et al. Citation2011). As Canadian forests are composed of both managed and unmanaged land crossing provincial and territorial borders, multiple jurisdictions are involved in stewardship, leading to issues in both temporal and spatial compilations (Stocks et al. Citation2002; Boulanger et al. Citation2012; Bolton et al. Citation2019) with an emphasis on larger and more severe fires, potentially introducing bias in national level trends and statistics (Taylor et al. Citation2013; Anderson et al. Citation2015). Remote sensing approaches provide spatially-explicit information on land cover and surface characteristics in a repetitive fashion, which makes it suitable and cost-effective for mapping burned forests, especially over large areas (Chu et al. Citation2016; Soverel et al. Citation2010). Free and open access to the Landsat archive, in particular, has enabled the characterization of an entire area of interest with the same information source, thereby allowing for the transparent, systematic, and repeatable production of spatially exhaustive information products (Roy et al. Citation2010; Griffiths et al. Citation2013; White et al. Citation2014). Recent research has demonstrated that by mining this extensive archive of long term spectral observations of the Canadian boreal, disturbance objects, such as fire can be accurately identified, described, and quantified (Hermosilla et al. Citation2016; White et al. Citation2017; Coops et al. Citation2018), at a level of spatial detail commensurate with information needs supporting post-fire monitoring, reporting, modeling, and possible remediation.
This capacity to systematically and exhaustively map burned areas provides a marked improvement in our understanding of the spatial and temporal occurrence of wildfires and the related characteristics (Coops et al. Citation2018). In this study, we developed a burn probability model using a statistical approach for forested landscapes in Saskatchewan, Canada, rather than using simulation techniques as often applied in existing studies. The input of our model included an extensive, open access, database of Landsat mapped fires, and a suite of fire occurrence and spread drivers derived from remotely-sensed data, including land cover, forest structure, and forest disturbance information. Our specific objectives are to (i) assess the importance of these Landsat time series derived drivers and other environmental factors (biotic and abiotic) for characterizing burn probability; (ii) understand the nature of the relationship between wildfires and these factors, and (iii) showcase the wall-to-wall map of predicted burn probability and assess its agreement with actual burned area mapping.
Study area
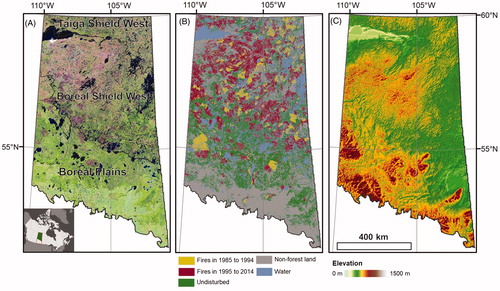
The forested area of Saskatchewan, Canada, occupies over 37.8 Mha representing approximately 58% of the provincial land base (). Saskatchewan covers four distinct ecozones: Taiga Shield, Boreal Shield, Boreal Plains, and Prairies ecozones (Ecological Stratification Working Group, Citation1995), with the first three above noted ecozones being forest dominated. Forests in Saskatchewan are dominated by conifer species, including black spruce (Picea mariana) and Jack pine (Pinus banksiana) in the north and quaking aspen (Populus tremuloides), eastern larch (Larix laricina), and white spruce (Picea glauca) in the south (Steele et al. Citation1997; Archibold et al. Citation2000). While southern Saskatchewan has a focus on agriculture, the more northern reaches of the province are sparsely populated and primarily characterized by unmanaged forests subject to wildfires (Stocks et al. Citation2002; Wulder et al. Citation2004).
Figure 1. (A) Study area in Saskatchewan, Canada, shown with false color (Red: shortwave infrared band, Green: infrared band, Blue: red band) Landsat best-available-pixel (BAP) composite relating 2015 conditions overlaid with forested ecozones. Inset map displays its location in Canada. (B) Spatial distribution of burned forests in 1985 to 1994 and 1995 to 2014 (the latter period was used to build the burn probability model) detected from Landsat time-series data in relation to unburned forests over the 1985 to 2014 period. (C) Topography of the study area. (For interpretation of the references to color in this figure legend, the reader is referred to the online version of this article.)
Methods
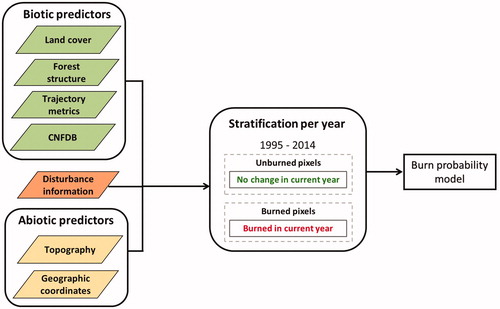
The methodology presented herein enables the characterization of burn probability through the integration of Landsat time series data and ancillary data (). From these datasets we derived predictor variables characterizing both biotic (i.e., land cover, forest structure, spectral trajectory metrics, and presence of historical wildfires) and abiotic (topographic features and geographic coordinates) conditions of forests. Disturbance information derived from Landsat time series was used to inform and annually stratify the sample selection for the burn probability model generation.
Figure 2. Workflow for integrating Landsat and ancillary data for modeling burn probability.
Data
Spectral trajectory metrics, Forest disturbance information, and land cover
In order to examine the relationship between environmental conditions and forest fire, annual surface reflectance image composites from 1985 to 2015 were used. These image composites were derived in conjunction with forest disturbance information following the Composite2Change (C2C) approach (Hermosilla et al. Citation2016). Given that the open Landsat data archive contains imagery acquired by different sensors with varying acquisition dates and atmospheric conditions, a best-available-pixel (BAP) compositing technique was used to select pixels of the highest quality over our study area. For the time period of interest, we used surface reflectance data acquired by Landsat-5 Thematic Mapper (TM), Landsat-7 Enhanced Thematic Mapper Plus (ETM+), and Landsat-8 Operational Land Imager (OLI) imagery (Masek et al. Citation2006; Vermote et al. Citation2016). To best characterize forest environments, a target date of August 1st was used, ensuring that only pixels acquired within a ±30-day window around this date were included in the composite. Clouds and the associated shadows in each image were detected using Fmask (Zhu and Woodcock Citation2012). The best available observation for each pixel within our study area was selected based on the scoring functions defined in White et al. (Citation2014) and refined in Hermosilla et al. (Citation2016), which ranks pixels based on presence and distance to clouds and cloud shadows, proximity to target date, and acquisition sensor.
Following the development of annual BAP composites, spectral trend analysis was carried out at the pixel level to remove noise (e.g. haze, smoke) in the trajectory and infill data gaps with interpolated values enabling generation of gap-free, annual, surface reflectance composites over our time frame of interest (Hermosilla et al. Citation2015a, Citation2016). From the time series of surface reflectance pixel composites, we derived Tasseled Cap brightness (TCB), greenness (TCG), and wetness (TCW) (Crist, Citation1985). Trajectory metrics, typically derived from trend analysis using time series data as slope of the trend, have proven to be useful for characterizing forest structure (Pflugmacher et al. Citation2012; Frazier et al. Citation2014). The nature and characteristics of the metrics that describe a given multi-year trend offer insights on successional processes operating, for instance, after disturbances (Bolton et al. Citation2018). Following this reasoning, we derived temporal trajectory metrics to characterize historic forest dynamics and related trends using the slope of the Tasseled Cap indices from the pre-fire time series, which encompasses from 1984 (first year of the time series) to the year before the year analyzed.
In addition to the annual multispectral surface reflectance composites, the C2C approach also enables the generation of change metrics as a part of the spectral trend analysis (i.e. change magnitude, change persistence, year of greatest change) from Landsat time series (Hermosilla et al. Citation2016). For example, change magnitude represents the difference in normalized burn ratio (NBR, Key and Benson Citation1999) before and after a disturbance, while change persistence measures the duration of the disturbance in years. Subsequently, the pixel-level spectral information from the annual composites was combined with temporal and geometry metrics to attribute disturbance objects to a type (e.g. harvest, wildfire, and non-stand replacing disturbance) (Hermosilla et al. Citation2015b).
Based upon annual Landsat surface reflectance pixel composites and disturbance information, Hermosilla et al. (Citation2018) demonstrated a time series-informed framework for land cover mapping termed Virtual Land Cover Engine (VLCE). VLCE integrates post-classification probabilities, forest disturbance information and forest successional knowledge to mitigate classification errors associated with spurious class transitions through time. The establishment of this time series informed land cover mapping framework allowed for the production of Canada-wide land cover maps with an annual periodicity. Among the 12 land cover classes covered by the VLCE framework, four are treed classes, including wetland-treed, coniferous, broadleaf, and mixedwood.
Forest structure data
Matasci, Hermosilla, Wulder, White, Coops, Hobart, and Zald (2018); Matasci, Hermosilla, Wulder, White, Coops, Hobart, and Bolton et al. (Citation2018) combined annual Landsat surface-reflectance composites and airborne LiDAR samples (Wulder et al. Citation2012) to seamlessly map forest structure variables annually over Canada’s forested ecosystems using a Nearest Neighbor imputation approach. Herein, we used forest structure information from six modeled structural layers: the mean, standard deviation, and coefficient of variation of canopy heights, the 95th percentile of canopy heights, canopy cover, and gross stem volume.
Topographic and geographic information
Topographic variables were derived from the digital elevation model (DEM) acquired by Advanced Spaceborne Thermal Emission and Reflection Radiometer (ASTER) 30 m version 2 Global Digital Elevation Model (GDEM) product (Tachikawa et al., Citation2011). Topographic variables included elevation, slope, topographic solar radiation index (TSRI) (Roberts and Cooper, Citation1989), and topographic wetness index (TWI) (Kirkby and Beven Citation1979). Finally, latitude and longitude of the pixel centroids (in decimal degrees) were included in this study to account for the association between geographic location and fire disturbance.
Canadian national fire database (CNFDB)
The Canadian National Fire Database (CNFDB) is a spatially explicit database representing wildfire events from 1959 to present time. The CNFDB compiles data from several jurisdictional fire management agencies and from Parks Canada, and replaces the former Large Fire Database (Stocks et al. Citation2002). The mapping methods used for the generation of the database have varied through time as technology has evolved and new data sources have become available. We used fire year in the CNFDB to inform on wildfires that occurred prior to the start of the C2C time series in 1985 (1959–1984). Information on historical fires allowed us to obtain a more comprehensive understanding of the influence of long-term historical fire regimes on current burn probability over large areas.
Sample selection for model calibration and validation
presents the spatial distribution of forest fires detected between 1985 and 2014 in two time frames (1985 to 1994 and 1995 to 2014), as well as undisturbed treed areas and waterbodies for Saskatchewan. We selected samples (pixels) from burned and undisturbed forests for each year in the time series using several selection criteria. First, only treed pixels (Hermosilla et al. Citation2018) within Saskatchewan’s forested ecosystems were considered. Second, guided by the forest disturbance dataset (Hermosilla et al. Citation2015b), the burned samples were selected randomly from areas that were burned in each year, and undisturbed samples were selected randomly from pixels that were not disturbed in that same year, such that areas disturbed by other agents would not be selected (e.g. harvesting). For simplicity, undisturbed samples are referred to as unburned for the remainder of the paper. To ensure representative spectral trajectory metrics of sufficient length (i.e. TCB, TCG, and TCW slopes), a minimum of ten years of observations was deemed necessary; therefore, only fires that occurred between 1995 and 2014 were considered in our model, while samples from 1985 to 1995 were reserved as a temporal baseline for computation of the trajectory metrics. Therefore, the time interval associated with the trajectory variables was at least 10 years, and varies depending on the year each burned or unburned sample is selected for and is representative of.
Following a stratified random sampling strategy, 2500 burned and unburned samples were extracted annually in the time frame of 1995 to 2014, such that the sampling process was not biased by size of fires or numbers of fires in a given year. As a result, 50,000 samples were obtained for burned and unburned classes respectively, representing 0.01% of total burned areas (8.9 Mha) and unburned areas (8.73 Mha) in our study area respectively between 1995 and 2014.
Predictor variables
Predictor variables were derived from Landsat and ancillary data sources to model burn probability (). Those derived from Landsat time series primarily characterized pre-fire biotic conditions of forests, including land cover, forest structure, and spectral trajectories. The information provided by these layers was extracted for the year prior to each fire occurrence year. We also incorporated topographic and geographic metrics to examine the influence of abiotic factors on burn probability.
Table 1. Predictor variables used to model burn probability.
Burn probability modeling
Predictor variables representing 1994–2013 conditions and corresponding historical trends were used to predict the probability of an area being either burned or unburned in the following year (1995–2014). For burn probability analysis, Random Forests (RF; Breiman Citation2001) was run in classification mode, where the binary classes of burned and unburned were predicted. As an ensemble learning algorithm, RF consists of a number of decision trees, with final class membership based upon the majority vote from the individual decision trees. These votes are commensurate with class membership likelihoods in the context of soft classification (Du et al. Citation2012) and therefore can provide a measure of burn probability from 0 to 100% for the subsequent year. Given that decision trees in RF are calibrated with bootstrap samples, approximately one third of the original samples were not used by each decision tree for model calibration, or out-of-bag (OOB) samples. As a result, OOB samples allow for internal cross-validation, without relying on an independent set of validation data (Belgiu and Drăguţ Citation2016). The output of the internal cross-validation is referred to as OOB error, which enables the calculation of variable importance scores through random permutations. As predictor variables are permuted one at a time, the more important a variable is, a greater decrease will be observed in model accuracy (Breiman Citation2001).
The developed model was first assessed with OOB samples using confusion matrix based on estimated area proportions, from which overall accuracy and user’s and producer’s accuracies were computed, as well as 95% confidence intervals. The variable importance scores derived therein were used to examine the contribution of biotic and abiotic predictors to burn probability modeling. Partial dependence plots were derived to further evaluate the relationship between these predictor variables and burn probability as captured by the model, in an attempt to uncover the nature between their interactions. Specifically, a partial dependence plot depicts the correspondence between the response variable and a small set of predictor variables, while averaging out the effects of other predictors in a model (Greenwell Citation2017).
Using the same abiotic variables and biotic predictors representing 2014 conditions, the model was then applied to treed pixels in 2014 to generate a wall-to-wall burn probability (0−100%) map for 2015 at 30 m spatial resolution across Saskatchewan’s forested ecosystems. The burn probability map was then compared to actual burned areas in 2015 that were independently detected using Landsat data (Hermosilla et al. Citation2016, Citation2017).
Results
Prediction of burn probability
The RF OOB assessment of the burn probability model was used to evaluate model performance (). Burned and unburned pixels were discriminated with an overall accuracy of 92.5% and balanced user’s and producer’s accuracies, indicating that the biotic and abiotic predictors were useful for discriminating burned and unburned forest areas for the training data (i.e. 1995–2014; ). Among the biotic factors considered, structural forest descriptors (i.e. canopy cover and mean canopy height) exhibited the highest importance to our burn probability model. Land cover information also ranked among the most important predictors. Abiotic factors describing geographical position (i.e. latitude) and topography (i.e. elevation) were among the top five predictors for modeling burn probability ().
Figure 3. Variable importance for the burn probability Random Forests model.
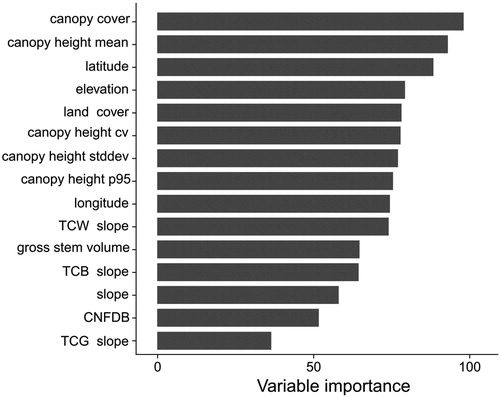
Table 2 Confusion matrix of the estimated proportions of area for the burn probability prediction model for calibration data 1995–2014.
Biotic and abiotic influence on burn probability
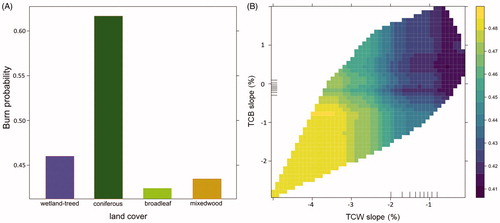
The partial dependence plots in and show the relationship between various biotic factors used to predict burn probability. Overall, forest stands with lower volume and relatively simple structure had higher probability to burn (). Wildfires were more prevalent among open forest stands with lower height variability and volume. Interestingly, stands with average height between 3 and 5 m exhibited low burn probability, while those with lower or higher stand height were more susceptible to wildfires (). Results on the influence of land cover on predicting burn probability () showed that coniferous forests were markedly more likely to burn than wetland-treed, broadleaf, or mixedwood forests. Regarding the influence of spectral trajectory metrics on burn probability, our results indicated that forest areas with declining brightness and wetness trends corresponded to higher burn probability ().
Figure 4. Partial dependence plots for biotic variables on burn probability: (A) canopy height mean and canopy height standard deviation, (B) canopy cover and gross stem volume. The inner ticks along the x-axes represent deciles of the predictor variables.
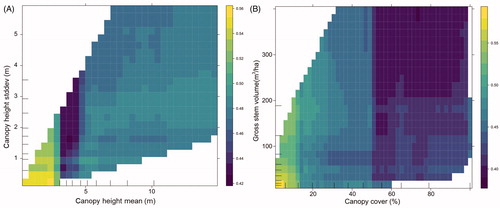
Figure 5. Partial dependence plots for (A) land cover and (B) temporal trajectory metrics on burn probability, depicting the relationship between burn probability and long-term spectral trends. The inner ticks along the x-axes represent deciles of the predictor variables.
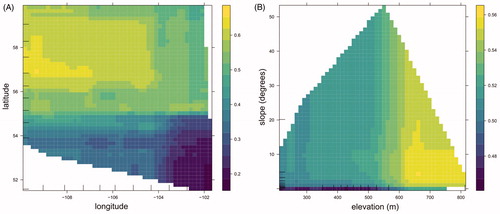
In terms of latitudinal gradient (), northern Saskatchewan is generally more prone to wildfires than southern Saskatchewan, with the high burn probability hotspots mostly located between 55° and 60° N. Although western Saskatchewan exhibited higher burn probability than the eastern region, the longitudinal trend was not as strong as the latitudinal gradient. In terms of topographic drivers (), lowland forests were less likely to burn compared to areas with higher elevation ().
Figure 6. Partial dependence plots for (A) geographic and (B) topographic controls on burn probability. The inner ticks along the x-axes represent deciles of the predictor variables.
Wall-to-wall burn probability map assessment in 2015
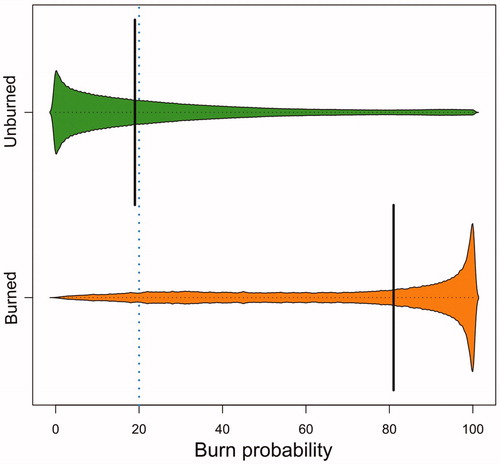
The wall-to-wall map of predicted burn probability for Saskatchewan’s forested ecosystems in 2015 indicates a marked difference between the low burn probability values found in southern (below latitude 56°N) compared with northern areas (). Similarly, the western forests of the province presented higher burn probability values compared with eastern forests. Areas predicted to have a high burn probability exhibited strong spatial agreement with actual wildfires that occurred in 2015 at a range of spatial scales, due to the capacity of our 30-m map to capture fine spatial details of burn probability (). Compared to the relatively compact burned patches in 2015, the predicted probability map is less spatially continuous at a local scale (); however, the burned area overall exhibited higher burn probability than surrounding unburned forest stands. Indeed, pixels that burned in 2015 had a much higher burn probability (mean = 69.7%), which was markedly skewed toward the highest burn probability values (median = 81%) compared to those pixels that did not burn in 2015 (mean = 27.3%), which were also markedly skewed toward the lowest probabilities (median = 19%) (). Only 6.8% of areas that burned presented burn probabilities lower than 19%. Overall, 71.5% of area burned had burn probabilities that exceeded 50%.
Figure 7. (A) Predicted forest burn probability in 2015 in Saskatchewan’s forested ecosystems, in comparison to actual burned forest areas for 2015, as detected independently by the C2C approach. Zoom-in examples showing spatially detailed agreement between predicted burn probability and detected fires in (B) Boreal Shield West and (C) Boreal Plains.
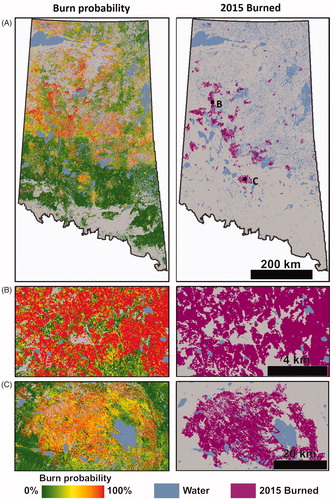
Figure 8. Distribution of predicted burn probability values for burned and unburned treed areas in our study area detected from Landsat time series data. Vertical solid lines represent the median probability for the burned and unburned class. The vertical dotted line represents the median probability for the entire study area.
Discussion
Biotic and abiotic influence on burn probability
We assessed the driving factors (biotic and abiotic) on burn probability of Saskatchewan’s forested ecosystems using time series of Landsat data. Our objective was to determine the importance of these driving factors, identify the nature of their relative influence on fire occurrence, and map burn probability. Based on fires that occurred between 1995 and 2014, our results suggested that biotic predictors describing forest structure are key to modeling burn probability. This aligns with recent findings identifying the availability of fuels as the most significant driving force behind high-severity fires across western United States (Parks et al. Citation2018). Herein we found that canopy cover was the most important predictor (), exhibiting a strong negative correlation with burn probability (), so areas with high canopy cover had a lower probability to burn. Considering that taller forest stands exhibited a higher burn probability (), burn probability could correspond with forest succession (Whitman et al. Citation2019). Thus, as forest stands progress from stand initiation to stem exclusion and the understory re-initiation stage (Oliver et al. Citation1996), stand height generally increases while competition among dominant trees might lead to increased canopy openness. As a result, development in the understory and overall vertical distribution would result in higher loading in forest floor fuels (de Groot et al. Citation2009) and ladder fuels (Menning and Stephens Citation2007), thus increasing burn probability. Erni et al. (Citation2018) demonstrated that stand age could impose significant influence on the spatial patterns and magnitude of burn probability due to the stand age resistance effect, which illustrates that young naturally regenerated stands are more resistant to wildfire than mature stands owing to lack of fuels. Although we incorporated the historical information of wildfires provided by the CNFDB as a proxy of stand age into our model of burn probability, this information did not contribute strongly to our burn probability predictions (). This may suggest that forest structural metrics themselves provide an adequate description regarding forest age for the identification of fire prone stands. In addition to forest structure, land cover and information on the pre-disturbance spectral trends also contributed to the burn probability model (). Our results indicated that coniferous stands were more prone to burn compared to other stand types, concurring with the trends identified by the Canadian Fire Danger Rating System (CFDRS; Stocks et al. Citation1989) and the land cover investigation of Castilla et al. (Citation2016). As we did not incorporate climate or weather data into our burn probability model, it is challenging to determine the magnitude of influence that can be uniquely attributed to these biotic variables, apart from what may be correlated with climatic patterns.
Pre-fire vegetation dynamics were characterized in this study by analyzing the historical spectral trends on wetness and brightness observed by Landsat time series. These spectral trajectory predictors exerted a moderate influence on burn probability. In particular, forest stands with declining trends in brightness and wetness over time exhibited higher burn probability (), potentially indicating the influence of non-stand replacing disturbances (e.g., drought, defoliating, insects, vegetation decline; Cohen et al. Citation2016; Bell et al. Citation2018), which have been found to precede wildfire events (Hermosilla et al. Citation2019).
Among the abiotic factors analyzed, latitude and elevation were ranked within the most important predictors for modeling burn probability (). In particular, forest stands above 600 m were much more likely to burn than lowland forests. This finding agrees with the relationships between burn severity and elevation found by Parks et al. (Citation2014) in wildfires in New Mexico and Idaho. Geographically, northwestern Saskatchewan was more likely to be disturbed by fire than southeastern Saskatchewan (). Saskatchewan’s managed forest areas is found primarily in the southern extent of the province’s forested ecosystems. These managed forest areas comprise forest tenures for harvesting (Stinson et al. Citation2011) and have intensive fire suppression practices compared to the unmanaged forest areas to the north (White et al. Citation2017), resulting in a suite of landscape characteristics with a lower probability of burning. Overall, the results indicate that the fine-scale forest structural information enabled by Landsat time series can improve our understanding of the relationship between various structural characteristics and susceptibility to wildfire.
Burn probability mapping at a 30-m spatial resolution and implications for Forest management
In this study we built a model to predict forest burn probability in 2015, calibrated using burned and unburned pixels from the period 1995 to 2014. RF votes were used as class membership likelihoods to characterize burn probability in Saskatchewan’s forested ecosystems (). We found strong spatial agreement between wildfires that actually occurred in 2015 and area with high burn probability ( and ). When assessing spatial agreement at a local scale, it is worth noting that not all pixels in a burned stand in 2015 exhibited high burn probability based on their pre-fire vegetation and topographic characteristics. Accordingly, unburned stands might include patches with relatively high predicted burn probability, which is common in the context of burn probability modeling. As highlighted by Parisien, Ager et al. (Citation2020), the stochastic nature of wildfire occurrence leads to fires burning areas predicted with low probability by mere chance.
While burn probability predictions are able to capture fine scale variability in fuel conditions with a spatial resolution of 30 m, the pixel-based model did not take the spatial context, such as fire patch perimeter or area, into consideration in the probability model (Parisien et al. Citation2013; Erni et al. Citation2018; Whitman et al. Citation2018). For example, a patch with high fuel loadings would have lower burn probability if it was surrounded by stands with low fuel loadings due to the fire shadow effect (Parisien et al. Citation2011; Erni et al. Citation2018). Additionally, many other factors controlling forest ignition and burn probability (e.g. lighting strike, seasonal precipitation, and weather) remain stochastic in nature, which are not accounted for in our model. Nonetheless, more than 71.5% of area burned in 2015 had burn probability values exceeding 50%. To further improve model performance, annual climatic variables could be incorporated to capture factors such as ignition probability in a spatially explicit manner (Scott et al. Citation2012).
Compared to simulation-based burn probability models, such as FlamMap (Finney Citation2006), FSim (Finney et al. Citation2011), and Burn-P3 (Parisien et al. Citation2005), our model shares the functionality of generating burn probability maps, yet differs from these simulation-based models in a number of key ways. In terms of overall model design, simulation-based burn probability models generally follow a mechanistic approach to model fire growth through fire ignition and spread, while accounting for effects of topography, fuels, and fire weather (Parisien, Dawe et al. Citation2020). In contrast, we aim to establish the connection between pre-fire biotic and abiotic factors and burned and unburned samples mapped by time-series Landsat spectral data following a statistical approach, which generates burn susceptibility estimates indirectly. While both approaches rely heavily on input data, especially those that represent vegetation conditions, fuel grids used in existing burn probability models are typically converted from land cover data, which may not be sufficiently detailed, up-to-date, or accurate (Parisien et al., Citation2013). In comparison, the forest structural layers used in our model are derived at an annual time step using airborne LiDAR transect data (Matasci, Hermosilla, Wulder, White, Coops, Hobart, and Zald et al. 2018; Matasci, Hermosilla, Wulder, White, Coops, Hobart, and Bolton et al. Citation2018) covering a range of forest structural attributes, offering a capability to characterize vegetation conditions in a timely manner. As a result, the statistical burn probability model presented in this research estimates burn probability for a specific year based on forest conditions, as highlighted with the 2015 prediction. In contrast, simulation-based models operate in a temporally holistic fashion over numerous iterations and calculate burn probability as the number of times a cell burned over the total number of iterations (Parisien, Dawe, et al. Citation2020). This difference in model output is evident from the range of predicted burn probability from our model (0–100%), compared to that of simulation-based burn probability outputs (e.g. Burn-P3), which tends to be much narrower and skewed to lower values (e.g. Parisien et al. Citation2005; Beverly and McLoughlin Citation2019). Therefore, burn probability derived from our model should be interpreted as a relative susceptibility to wildfire (Davis et al. Citation2017), thus requiring additional normalization prior to any direct comparison with burn probability estimates from simulation-based models. Lastly, due to the mechanistic nature of simulation-based models, they offer users the flexibility to explore burn probability and fire behavior under alternative scenarios, such as fuel treatment (Finney Citation2007), wildlife conservation (Ager et al. Citation2010), and climate projection (Wang et al. Citation2016). As ours is a statistical-based model, it is less suitable for answering such “what if” questions. Even though modifications to the input variables can be made to mimic effects such as fuel treatment, it is not currently designed for exploring alternative scenarios. It is evident that there are diverse approaches to gather insights on where wildfire may occur, all of which have strengths and weaknesses. Given the potential effects of wildfires, any relevant information should be considered (Parisien, Ager, et al. Citation2020).
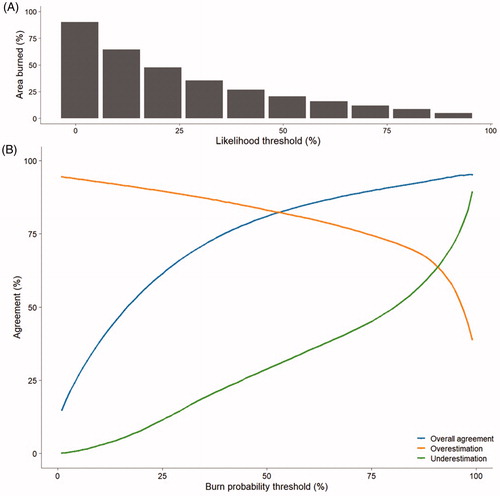
The spatial agreement between areas with high predicted burn probabilities and realized fire locations in 2015 suggests that burn probability maps could be used as additional input information in wildfire risk models (Taylor et al. Citation2013, Xi et al. Citation2019) and decision support tools. Burn probability maps can contribute meaningfully to strategic fire and fuel management decisions, including fire risk evaluation (Finney et al. Citation2011; Alcasena et al. Citation2017), fuel treatment optimization (Salis et al. Citation2018), and prevention planning (Miller et al. Citation2008). The continuous nature of burn probability outputs is useful for both managers and modelers. Forest managers and decision makers can establish priority areas of interest by determining thresholds of burn probability that meet their information needs, to prioritize resources or harden at-risk communities, while also being mindful of omission and commission error (). From a forest management perspective, the selection of the threshold value would have implications on extent of the area of interest, and hence on the material and economic requirements needed to undertake the prevention, treatment, or monitoring of areas with high probability of burning. In many ways, the use of the full range of probability values remains of greatest utility, as these provide more detailed information, while avoiding possibly arbitrary cutoffs. As indicated in , overall agreement between predicted burn probability and actual burned areas in 2015 increases as the burn probability increases. Overall, approximately 21% of Saskatchewan’s forested ecosystems had a burn probability greater than 50% in 2015. From our analysis herein, we determined that 75% of this area actually did burn in 2015 and captured the majority of the actual fires (burned area underestimation = 28.8%) but with an evident overestimation regarding the burned area (fire overestimation 83.1%). Liu et al. (Citation2013) found that the application of a relatively high burn probability threshold was useful for identifying focus areas for fuel treatment, which in turn can aid in reducing the number of fires and burned area. Similar opportunities exist to examine the potential influence of wildfire on urban interfaces (Massada et al. Citation2009; Salis et al. Citation2013) and wildlife conservation (Thompson et al. Citation2013; Bentley and Penman Citation2017).
Figure 9. (A) Predicted burned area, and (B) predictive agreement with actual fires in 2015 as function of the threshold applied to burn probability to predict burned areas.
Conclusion
In this research, we presented a data-driven approach to predict burn probability across forested ecosystems of Saskatchewan, Canada, using a suite of Landsat time series based forest structural, spectral, and land cover metrics, together with ancillary geographic and topographic information. Herein we generated a burn probability model and further analyzed the relationship between these predictive metrics representing biotic and abiotic factors and the model outcome. Subsequently, we applied the burn probability model to data relating 2014 conditions to map burn probability in 2015, which exhibited strong correspondence with actual fires occurring that year captured from an independent source. Among burned forests in 2015, only 6.8% had burn probabilities that were lower than 19%, in contrast, 71.5% had burn probabilities greater than 50%. Descriptors of forest structure were the most useful predictors, highlighting the importance of data sources that are capable of characterizing forest structure over large areas with sufficient accuracy, spatial and temporal resolution. Short and open stands with low height variability and volume exhibited relatively high burn probability, understood as a function of the forest characteristics present in the northern extent of the study area that is also most prone to wildfire. Among various cover types, coniferous stands were the most likely to burn, while broadleaf forests were the least likely to burn. From a stand development perspective characterized by temporal trajectory metrics, stands with significant negative long-term trajectories, likely under the influence of non-stand replacing disturbances, were the most susceptible to wildfires. In terms of topography, stands located on gentle slopes and higher elevations tended to be more susceptible to wildfires. The approach presented herein demonstrates how detailed, spatially-explicit burn probability maps may be generated from information characterizing forest structure and past disturbances derived from Landsat time series. Value is demonstrated in that these burn probabilities are well aligned in a predictive sense with areas that actually burned, representing a new and useful source of information for wildland fire risk modeling, management, and mitigation.
Acknowledgements
This research was undertaken as part of the “Earth Observation to Inform Canada’s Climate Change Agenda (EO3C)” project jointly funded by the Canadian Space Agency (CSA), Government Related Initiatives Program (GRIP), and the Canadian Forest Service (CFS) of Natural Resources Canada (NRCan). Support has also been provided by a NSERC Discovery grant to Coops. This research was enabled in part by computational resources provided by WestGrid (www.westgrid.ca) and Compute Canada (www.computecanada.ca). Open access is supported by the Government of Canada. Geordie Hobart and Dr. Giona Matasci are thanked for their contributions to generating the image composites and the forest structural layers used herein.
References
- Ager, A.A., Vaillant, N.M., and Finney, M.A. 2010. “A comparison of landscape fuel treatment strategies to mitigate wildland fire risk in the urban interface and preserve old forest structure.” Forest Ecology and Management, Vol. 259(No. 8): pp. 1556–1570.
- Alcasena, F.J., Salis, M., Ager, A.A., Castell, R., and Vega-García, C. 2017. “Assessing wildland fire risk transmission to communities in northern Spain.” Forests, Vol. 8(No. 2): pp. 30.
- Anderson, K., Simpson, B., Hall, R.J., Englefield, P., Gartrell, M., and Metsaranta, J.M. 2015. “Integrating forest fuels and land cover data for improved estimation of fuel consumption and carbon emissions from boreal fires.” International Journal of Wildland Fire, Vol. 24(No. 5): pp. 665–679.
- Archibold, O.W., Acton, C., and Ripley, E.A. 2000. “Effect of site preparation on soil properties and vegetation cover, and the growth and survival of white spruce (Picea glauca) seedlings, in Saskatchewan.” Forest Ecology and Management, Vol. 131(No. 1–3): pp. 127–141.
- Belgiu, M., and Drăguţ, L. 2016. “Random forest in remote sensing: A review of applications and future directions.” ISPRS Journal of Photogrammetry and Remote Sensing, Vol. 114: pp. 24–31.
- Bell, D.M., Cohen, W.B., Reilly, M., and Yang, Z. 2018. “Visual interpretation and time series modeling of Landsat imagery highlight drought's role in forest canopy declines.” Ecosphere, Vol. 9(No. 6): pp. e02195.
- Bentley, P.D., and Penman, T.D. 2017. “Is there an inherent conflict in managing fire for people and conservation?” International Journal of Wildland Fire, Vol. 26(No. 6): pp. 455–468.
- Beverly, J.L., and McLoughlin, N. 2019. “Burn probability simulation and subsequent wildland fire activity in Alberta, Canada–implications for risk assessment and strategic planning.” Forest Ecology and Management, Vol. 451: pp. 117490.
- Bolton, D.K., Coops, N.C., Hermosilla, T., Wulder, M.A., White, J.C., and Ferster, C.J. 2019. “Uncovering regional variability in disturbance trends between parks and greater park ecosystems across Canada (1985–2015).” Scientific Reports, Vol. 9(No. 1): pp. 1–10.
- Bolton, D.K., White, J.C., Wulder, M.A., Coops, N.C., Hermosilla, T., and Yuan, X. 2018. “Updating stand-level forest inventories using airborne laser scanning and Landsat time series data.” International Journal of Applied Earth Observation and Geoinformation, Vol. 66: pp. 174–183.
- Boulanger, Y., Gauthier, S., and Burton, P.J. 2014. “A refinement of models projecting future Canadian fire regimes using homogeneous fire regime zones.” Canadian Journal of Forest Research, Vol. 44(No. 4): pp. 365–376.
- Boulanger, Y., Gauthier, S., Burton, P.J., and Vaillancourt, M.A. 2012. “An alternative fire regime zonation for Canada.” International Journal of Wildland Fire, Vol. 21(No. 8): pp. 1052–1064.
- Breiman, L. 2001. “Random forests.” Machine Learning, Vol. 45(No. 1): pp. 5–32.
- Canadian Forest Service. 2017. Canadian national fire database – agency fire data. Natural Resources Canada, Canadian Forest Service, Northern Forestry Centre, Edmonton, Alberta. http://cwfis.cfs.nrcan.gc.ca/ha/nfdb.
- Castilla, G., Rodrigue, S., Skakun, R., and Hall, R. 2016. “Four national maps of broad forest type provide inconsistent answers to the question of what burns in Canada.” Remote Sensing, Vol. 8(No. 7): pp. 539.
- Cheney, N.P., Gould, J.S., and Catchpole, W.R. 1998. “Prediction of fire spread in grasslands.” International Journal of Wildland Fire, Vol. 8(No. 1): pp. 1–13.
- Chu, T., Guo, X., and Takeda, K. 2016. “Remote sensing approach to detect post-fire vegetation regrowth in Siberian boreal larch forest.” Ecological Indicators, Vol. 62: pp. 32–46.
- Cohen, W.B., Yang, Z., Stehman, S.V., Schroeder, T.A., Bell, D.M., Masek, J.G., Huang, C., and Meigs, G.W. 2016. “Forest disturbance across the conterminous United States from 1985–2012: The emerging dominance of forest decline.” Forest Ecology and Management, Vol. 360: pp. 242–252.
- Coops, N.C., Hermosilla, T., Wulder, M.A., White, J.C., and Bolton, D.K. 2018. “A thirty year, fine-scale, characterization of area burned in Canadian forests shows evidence of regionally increasing trends in the last decade.” PLOS One, Vol. 13(No. 5): pp. e0197218.
- Crist, E.P. 1985. “A TM tasseled cap equivalent transformation for reflectance factor data.” Remote Sensing of Environment, Vol. 17(No. 3): pp. 301–306.
- Davis, R., Yang, Z., Yost, A., Belongie, C., and Cohen, W. 2017. “The normal fire environment—Modeling environmental suitability for large forest wildfires using past, present, and future climate normals.” Forest Ecology and Management, Vol. 390: pp. 173–186.
- de Groot, W.J., Cantin, A.S., Flannigan, M.D., Soja, A.J., Gowman, L.M., and Newbery, A. 2013. “A comparison of Canadian and Russian boreal forest fire regimes.” Forest Ecology and Management, Vol. 294: pp. 23–34.
- de Groot, W.J., Pritchard, J.M., and Lynham, T.J. 2009. “Forest floor fuel consumption and carbon emissions in Canadian boreal forest fires.” Canadian Journal of Forest Research, Vol. 39(No. 2): pp. 367–382.
- Du, P., Xia, J., Zhang, W., Tan, K., Liu, Y., and Liu, S. 2012. “Multiple classifier system for remote sensing image classification: A review.” Sensors (Basel, Switzerland), Vol. 12(No. 4): pp. 4764–4792.
- Ecological Stratification Working Group. 1995. A National Ecological Framework for Canada. Cat. No. A42-65/1996E.
- Erni, S., Arseneault, D., and Parisien, M.A. 2018. “Stand age influence on potential wildfire ignition and spread in the boreal forest of Northeastern Canada.” Ecosystems, Vol. 21(No. 7): pp. 1471–1486.
- Fernandes, P.A.M. 2001. “Fire spread prediction in shrub fuels in Portugal.” Forest Ecology and Management, Vol. 144(No. 1–3): pp. 67–74.
- Finney, M.A. 2001. “Design of regular landscape fuel treatment patterns for modifying fire growth and behavior.” Forest Science, Vol. 47(No. 2): pp. 219–228.
- Finney, M.A. 2006. “An overview of FlamMap fire modeling capabilities.” Vol. 41. In Fuels management-how to measure success: Conference proceedings. 28–30 March 2006, Proceedings RMRS-P-41, edited by Patricia L. Andrews and Bret W. Butler, 213–220. Portland, OR; Fort Collins, CO, Rocky Mountain Research Station: US Department of Agriculture, Forest Service.
- Finney, M.A. 2007. “A computational method for optimising fuel treatment locations.” International Journal of Wildland Fire, Vol. 16(No. 6): pp. 702–711.
- Finney, M.A., McHugh, C.W., Grenfell, I.C., Riley, K.L., and Short, K.C. 2011. “A simulation of probabilistic wildfire risk components for the continental United States.” Stochastic Environmental Research and Risk Assessment, Vol. 25(No. 7): pp. 973–1000.
- Flannigan, M.D., and Harrington, J.B. 1988. “A study of the relation of meteorological variables to monthly provincial area burned by wildfire in Canada (1953–80)”. Journal of Applied Meteorology, Vol. 27(No. 4): pp. 441–452.
- Flannigan, M.D., Logan, K.A., Amiro, B.D., Skinner, W.R., and Stocks, B.J. 2005. “Future area burned in Canada.” Climatic Change, Vol. 72(No. 1–2): pp. 1–16.
- Frazier, R.J., Coops, N.C., Wulder, M.A., and Kennedy, R. 2014. “Characterization of aboveground biomass in an unmanaged boreal forest using Landsat temporal segmentation metrics.” ISPRS Journal of Photogrammetry and Remote Sensing, Vol. 92: pp. 137–146.
- Gralewicz, N.J., Nelson, T.A., and Wulder, M.A. 2012. “Factors influencing national scale wildfire susceptibility in Canada.” Forest Ecology and Management, Vol. 265: pp. 20–29.
- Greenwell, B.M. 2017. “pdp: An R Package for constructing partial dependence plots.” The R Journal, Vol. 9(No. 1): pp. 421–436.
- Griffiths, P., van der Linden, S., Kuemmerle, T., and Hostert, P. 2013. “A pixel-based Landsat compositing algorithm for large area land cover mapping.” IEEE Journal of Selected Topics in Applied Earth Observations and Remote Sensing, Vol. 6(No. 5): pp. 2088–2101.
- Hermosilla, T., Wulder, M.A., White, J.C., and Coops, N.C. 2019. “Prevalence of multiple forest disturbances and impact on vegetation regrowth from interannual Landsat time series (1985–2015)”. Remote Sensing of Environment, Vol. 233: pp. 111403.
- Hermosilla, T., Wulder, M.A., White, J.C., Coops, N.C., and Hobart, G.W. 2015a. “An integrated Landsat time series protocol for change detection and generation of annual gap-free surface reflectance composites.” Remote Sensing of Environment, Vol. 158: pp. 220–234.
- Hermosilla, T., Wulder, M.A., White, J.C., Coops, N.C., and Hobart, G.W. 2015b. “Regional detection, characterization, and attribution of annual forest change from 1984 to 2012 using Landsat-derived time-series metrics.” Remote Sensing of Environment, Vol. 170: pp. 121–132.
- Hermosilla, T., Wulder, M.A., White, J.C., Coops, N.C., and Hobart, G.W. 2017. “Updating Landsat time series of surface-reflectance composites and forest change products with new observations.” International Journal of Applied Earth Observation and Geoinformation, Vol. 63: pp. 104–111.
- Hermosilla, T., Wulder, M.A., White, J.C., Coops, N.C., and Hobart, G.W. 2018. “Disturbance-informed annual land cover classification maps of Canada's forested ecosystems for a 29-year Landsat time series.” Canadian Journal of Remote Sensing, Vol. 44(No. 1): pp. 67–87.
- Hermosilla, T., Wulder, M.A., White, J.C., Coops, N.C., Hobart, G.W., and Campbell, L.B. 2016. “Mass data processing of time series Landsat imagery: pixels to data products for forest monitoring.” International Journal of Digital Earth, Vol. 9(No. 11): pp. 1035–1054.
- Kasischke, E. S., & Stocks, B. J. (Eds.). 2000. Fire, climate change, and carbon cycling in the boreal forest. Vol. 138. New York, NY: Springer Science & Business Media.
- Kasischke, E., Verbyla, D., Rupp, T., McGuire, A., Murphy, K., Jandt, R., Barnes, J., et al. 2010. “Alaska’s changing fire regime—implications for the vulnerability of its boreal forests.” Canadian Journal of Forest Research, Vol. 40(No. 7): pp. 1313–1324.
- Key, C.H., and Benson, N.C. 1999. “The Normalized Burn Ratio, a Landsat TM radiometric index of burn severity incorporating multi-temporal differencing.” US Geological Survey,
- Kirkby, M.J., and Beven, K.J. 1979. “A physically based, variable contributing area model of basin hydrology.” Hydrological Sciences Bulletin, Vol. 24(No. 1): pp. 43–69.
- Liu, Z., Yang, J., and He, H.S. 2013. “Studying the effects of fuel treatment based on burn probability on a boreal forest landscape.” Journal of Environmental Management, Vol. 115: pp. 42–52.
- Malamud, B.D., Morein, G., and Turcotte, D.L. 2005. “Log-periodic behavior in a forest-fire model.” Nonlinear Processes in Geophysics, Vol. 12(No. 5): pp. 575–585.
- Masek, J.G., Vermote, E.F., Saleous, N.E., Wolfe, R., Hall, F.G., Huemmrich, K.F., Gao, F., Kutler, J., and Lim, T. 2006. “A Landsat surface reflectance dataset for North America, 1990–2000.” IEEE Geoscience and Remote Sensing Letters, Vol. 3(No. 1): pp. 68–72.
- Massada, A.B., Radeloff, V.C., Stewart, S.I., and Hawbaker, T.J. 2009. “Wildfire risk in the wildland–urban interface: A simulation study in northwestern Wisconsin.” Forest Ecology and Management, Vol. 258(No. 9): pp. 1990–1999.
- Matasci, G., Hermosilla, T., Wulder, M.A., White, J.C., Coops, N.C., Hobart, G.W., and Zald, H.S. 2018a. “Large-area mapping of Canadian boreal forest cover, height, biomass and other structural attributes using Landsat composites and LiDAR plots.” Remote Sensing of Environment, Vol. 209: pp. 90–106.
- Matasci, G., Hermosilla, T., Wulder, M.A., White, J.C., Coops, N.C., Hobart, G.W., Bolton, D.K., Tompalski, P., and Bater, C.W. 2018b. “Three decades of forest structural dynamics over Canada's forested ecosystems using Landsat time-series and LiDAR plots.” Remote Sensing of Environment, Vol. 216: pp. 697–714.
- Menning, K.M., and Stephens, S.L. 2007. “Fire climbing in the forest: a semiqualitative, semiquantitative approach to assessing ladder fuel hazards.” Western Journal of Applied Forestry, Vol. 22(No. 2): pp. 88–93.
- Miller, C., Parisien, M.A., Ager, A.A., and Finney, M.A. 2008. “Evaluating spatially explicit burn probabilities for strategic fire management planning.” Transactions on Ecology and the Environment, Vol. 19: pp. 245–252.
- Moritz, M.A., Parisien, M.A., Batllori, E., Krawchuk, M.A., Van Dorn, J., Ganz, D.J., and Hayhoe, K. 2012. “Climate change and disruptions to global fire activity.” Ecosphere, Vol. 3(No. 6): pp. art49–22.
- Oliver, C. D., Larson, B. C., and Oliver, C. D. 1996. Forest stand dynamics, 520. New York: Wiley.
- Parisien, M.A., Dawe, D.A., Miller, C., Stockdale, C.A., and Armitage, O.B. 2020. “Applications of simulation-based burn probability modelling: a review.” International Journal of Wildland Fire, Vol. 28(No. 12):pp. 913–926.
- Parisien, M. A., Kafka, V. G., Hirsch, K. G., Todd, J. B., Lavoie, S. G., and Maczek, P. D. 2005. Mapping wildfire susceptibility with the BURN-P3 simulation model. Edmonton, AB: Natural Resources Canada, Canadian Forest Service, Northern Forestry Centre, Information report NOR-X-405..
- Parisien, M.A., Parks, S.A., Krawchuk, M.A., Flannigan, M.D., Bowman, L.M., and Moritz, M.A. 2011. “ Scale-dependent controls on the area burned in the boreal forest of Canada, 1980–2005.” Ecology Applied, Vol. 21(No. 3): pp. 789–805.
- Parisien, M.A., Parks, S.A., Krawchuk, M.A., Little, J.M., Flannigan, M.D., Gowman, L.M., and Moritz, M.A. 2014. “An analysis of controls on fire activity in boreal Canada: Comparing models built with different temporal resolutions.” Ecological Applications: A Publication of the Ecological Society of America, Vol. 24(No. 6): pp. 1341–1356.
- Parisien, M.A., Walker, G.R., Little, J.M., Simpson, B.N., Wang, X., and Perrakis, D.D. 2013. “Considerations for modeling burn probability across landscapes with steep environmental gradients: An example from the Columbia Mountains.” Natural Hazards, Vol. 66(No. 2): pp. 439–462.
- Parisien, M.-A., Ager, A.A., Barros, A.M., Dawe, D., Erni, S., Finney, M.A., McHugh, C.W., et al. 2020. “Commentary on the article “Burn probability simulation and subsequent wildland fire activity in Alberta, Canada–Implications for risk assessment and strategic planning” by J.L. Beverly and N. McLoughlin. Forest Ecology and Management, Vol. 460: pp. 117698.
- Parks, S.A., Holsinger, L.M., Panunto, M.H., Jolly, W.M., Dobrowski, S.Z., and Dillon, G.K. 2018. “High-severity fire: Evaluating its key drivers and mapping its probability across western US forests.” Environmental Research Letters, Vol. 13(No. 4): pp. 044037.
- Parks, S.A., Miller, C., Nelson, C.R., and Holden, Z.A. 2014. “Previous fires moderate burn severity of subsequent wildland fires in two large western US wilderness areas.” Ecosystems, Vol. 17(No. 1): pp. 29–42.
- Pflugmacher, D., Cohen, W.B., and Kennedy, R.E. 2012. “Using Landsat-derived disturbance history (1972–2010) to predict current forest structure.” Remote Sensing of Environment, Vol. 122: pp. 146–165.
- Price, D.T., Alfaro, R.I., Brown, K.J., Flannigan, M.D., Fleming, R.A., Hogg, E.H., Girardin, M.P., et al. 2013. “Anticipating the consequences of climate change for Canada’s boreal forest ecosystems.” Environmental Reviews, Vol. 21(No. 4): pp. 322–365.
- Roberts, D.W., and Cooper, S.V. 1989. Concepts and techniques of vegetation mapping. General Technical Report INT. USA: US Department of Agriculture, Forest Service, Intermountain Research Station.
- Rollins, M.G., Swetnam, T.W., and Morgan, P. 2001. “Evaluating a century of fire patterns in two Rocky Mountain wilderness areas using digital fire atlases.” Canadian Journal of Forest Research, Vol. 31(No. 12): pp. 2107–2123.
- Romme, W.H. 1982. “Fire and landscape diversity in subalpine forests of Yellowstone National Park.” Ecological Monographs, Vol. 52(No. 2): pp. 199–221.
- Roy, D.P., Ju, J., Kline, K., Scaramuzza, P.L., Kovalskyy, V., Hansen, M., Loveland, T.R., Vermote, E., and Zhang, C. 2010. “Web-enabled Landsat Data (WELD): Landsat ETM + composited mosaics of the conterminous United States.” Remote Sensing of Environment, Vol. 114(No. 1): pp. 35–49.
- Ryu, S.R., Chen, J., Zheng, D., and Lacroix, J.J. 2007. “Relating surface fire spread to landscape structure: an application of FARSITE in a managed forest landscape.” Landscape and Urban Planning, Vol. 83(No. 4): pp. 275–283.
- Salis, M., Ager, A.A., Arca, B., Finney, M.A., Bacciu, V., Duce, P., and Spano, D. 2013. “Assessing exposure of human and ecological values to wildfire in Sardinia.” International Journal of Wildland Fire, Vol. 22(No. 4): pp. 549–565.
- Salis, M., Del Giudice, L., Arca, B., Ager, A.A., Alcasena-Urdiroz, F., Lozano, O., Bacciu, V., Spano, D., and Duce, P. 2018. “Modeling the effects of different fuel treatment mosaics on wildfire spread and behavior in a Mediterranean agro-pastoral area.” Journal of Environmental Management, Vol. 212: pp. 490–505.
- San-Miguel, I., Andison, D.W., and Coops, N.C. 2017. “Characterizing historical fire patterns as a guide for harvesting planning using landscape metrics derived from long term satellite imagery.” Forest Ecology and Management, Vol. 399: pp. 155–165.
- Scott, J.H., Helmbrecht, D.J., Parks, S.A., and Miller, C. 2012. “Quantifying the threat of unsuppressed wildfires reaching the adjacent wildland-urban interface on the Bridger-Teton National Forest, Wyoming, USA.” Fire Ecology, Vol. 8(No. 2): pp. 125–142.
- Soverel, N.O., Perrakis, D.D., and Coops, N.C. 2010. “Estimating burn severity from Landsat dNBR and RdNBR indices across western Canada.” Remote Sensing of Environment, Vol. 114(No. 9): pp. 1896–1909.
- Steele, S.J., Gower, S.T., Vogel, J.G., and Norman, J.M. 1997. “Root mass, net primary production and turnover in aspen, jack pine and black spruce forests in Saskatchewan and Manitoba, Canada.” Tree Physiology, Vol. 17(No. 8–9): pp. 577–587.
- Stinson, G., Kurz, W.A., Smyth, C.E., Neilson, E.T., Dymond, C.C., Metsaranta, J.M., Boisvenue, C., et al. 2011. “An inventory‐based analysis of Canada's managed forest carbon dynamics, 1990 to 2008.” Global Change Biology, Vol. 17(No. 6): pp. 2227–2244.
- Stocks, B.J., Mason, J.A., Todd, J.B., Bosch, E.M., Wotton, B.M., Amiro, B.D., Flannigan, M.D., et al. 2002. “Large forest fires in Canada, 1959–1997.” Journal of Geophysical Research, Vol. 108: pp. FFR-5.
- Stocks, B.J., Lawson, B.D., Alexander, M.E., Van Wagner, C.E., McAlpine, R.S., Lynham, T.J., and Dube, D.E. 1989. “The Canadian Forest Fire Danger Rating System: An Overview.” The Forestry Chronicle, Vol. 65(No. 4): pp. 258–265.
- Tachikawa, T., Kaku, M., Iwasaki, A., Gesch, D. B., Oimoen, M. J., Zhang, Z., Danielson, J. J., et al. 2011. ASTER global digital elevation model version 2-summary of validation results. NASA.
- Taylor, S.W., Woolford, D.G., Dean, C.B., and Martell, D.L. 2013. “Wildfire prediction to inform management: statistical science challenges.” Statistical Science, Vol. 28(No. 4): pp. 586–615.
- Thompson, M.P., Scott, J., Kaiden, J.D., and Gilbertson-Day, J.W. 2013. “A polygon-based modeling approach to assess exposure of resources and assets to wildfire.” Natural Hazards, Vol. 67(No. 2): pp. 627–644.
- Vermote, E., Justice, C., Claverie, M., and Franch, B. 2016. “Preliminary analysis of the performance of the Landsat 8/OLI land surface reflectance product.” Remote Sensing of Environment, Vol. 185: pp. 46–56.
- Wang, X., Parisien, M.A., Taylor, S.W., Perrakis, D.D., Little, J., and Flannigan, M.D. 2016. “Future burn probability in south-central British Columbia.” International Journal of Wildland Fire, Vol. 25(No. 2): pp. 200–212.
- Wang, X., Thompson, D.K., Marshall, G.A., Tymstra, C., Carr, R., and Flannigan, M.D. 2015. “Increasing frequency of extreme fire weather in Canada with climate change.” Climatic Change, Vol. 130(No. 4): pp. 573–586.
- White, J.C., Wulder, M.A., Hermosilla, T., Coops, N.C., and Hobart, G.W. 2017. “A nationwide annual characterization of 25 years of forest disturbance and recovery for Canada using Landsat time series.” Remote Sensing of Environment, Vol. 194: pp. 303–321.
- White, J.C., Wulder, M.A., Hobart, G.W., Luther, J.E., Hermosilla, T., Griffiths, P., Coops, N.C., et al. 2014. “Pixel-based image compositing for large-area dense time series applications and science.” Canadian Journal of Remote Sensing, Vol. 40(No. 3): pp. 192–212.
- Whitman, E., Parisien, M.A., Thompson, D.K., and Flannigan, M.D. 2019. “Short-interval wildfire and drought overwhelm boreal forest resilience.” Scientific Reports, Vol. 9(No. 1): pp. 1–12.
- Whitman, E., Parisien, M.A., Thompson, D.K., Hall, R.J., Skakun, R.S., and Flannigan, M.D. 2018. “Variability and drivers of burn severity in the northwestern Canadian boreal forest.” Ecosphere, Vol. 9(No. 2): pp. e02128.
- Wotton, B.M., Flannigan, M.D., and Marshall, G.A. 2017. “Potential climate change impacts on fire intensity and key wildfire suppression thresholds in Canada.” Environmental Research Letters, Vol. 12(No. 9): pp. 095003.
- Wotton, B.M., Nock, C.A., and Flannigan, M.D. 2010. “Forest fire occurrence and climate change in Canada.” International Journal of Wildland Fire, Vol. 19(No. 3): pp. 253–271.
- Wulder, M.A., Kurz, W.A., and Gillis, M. 2004. “National level forest monitoring and modeling in Canada.” Progress in Planning, Vol. 61(No. 4): pp. 365–381.
- Wulder, M.A., White, J.C., Bater, C.W., Coops, N.C., Hopkinson, C., and Chen, G. 2012. “LiDAR plots—A new large-area data collection option: Context, concepts, and case study.” Canadian Journal of Remote Sensing, Vol. 38(No. 5): pp. 600–618.
- Xi, D.D., Taylor, S.W., Woolford, D.G., and Dean, C.B. 2019. “Statistical models of key components of wildfire risk.” Annual Review of Statistics and Its Application, Vol. 6(No. 1): pp. 197–222.
- Zhu, Z., and Woodcock, C.E. 2012. “Object-based cloud and cloud shadow detection in Landsat imagery.” Remote Sensing of Environment, Vol. 118: pp. 83–94.