
 ?Mathematical formulae have been encoded as MathML and are displayed in this HTML version using MathJax in order to improve their display. Uncheck the box to turn MathJax off. This feature requires Javascript. Click on a formula to zoom.
Abstract
We compared traditional spatial filters and multi-temporal filters to remove speckle from synthetic aperture radar (SAR) data for mapping Phragmites australis. SAR constellations, with more rapid revisit capability, allow one to generate stacks of SAR data and to use multi-temporal filters for speckle reduction. GAMMA software offers multi-temporal filters for SAR processing, two of which we compared to the traditional Enhanced Lee and the Lee filters. We evaluated the filters using three criteria: (1) visual inspection, (2) signal level ratio, and (3) the equivalent number of looks (ENL). The results of this study show that multi-temporal filters were able to reduce speckle from areas of surface water and land, as well as to improve the detection of Phragmites patches due to preserving the resolution and texture which helped in the detection of the patch boundaries. The signal level ratio was approximately 1.0 with the GAMMA Multi-temporal filter and approximately 0.9 with the other filters. The enhanced Lee and the two multi-temporal filters produced an equal ENL of about 6. However, due to small patch sizes and backscatter similarity with cattails and other cover types Phragmites patches were difficult to separate from other types of flooded vegetation with C-HH intensity only.
RÉSUMÉ
Nous avons comparé les filtres spatiaux traditionnels et les filtres multitemporels pour réduire le chatoiement des données de radars à synthèse d’ouverture (RSO) pour cartographier les Phragmites australis. Les constellations SAR, ayant une capacité de revisite rapide, permettent de générer des piles de données SAR et d’utiliser des filtres multitemporels pour la réduction du bruit. Le logiciel GAMMA offre des filtres multitemporels pour le traitement SAR, dont deux que nous avons comparés aux filtres traditionnels Enhanced Lee et Lee. Nous avons évalué les filtres à l’aide de trois critères: (1) inspection visuelle, (2) rapport du niveau de signal (SLR), et (3) le nombre équivalent de vues (ENL). Les résultats montrent que les filtres multitemporels ont été en mesure de réduire le chatoiement des surfaces d’eau et des zones terrestres, ainsi que d’améliorer la détection des limites des plaques de phragmites en raison de la préservation de la résolution et de la texture des images. Le rapport du niveau de signal était d’environ 1,0 pour le filtre multitemporel GAMMA et d’environ 0,9 pour les autres filtres. Le filtre Lee amélioré et les deux filtres multitemporels ont produit un ENL semblable (∼6). Cependant, en raison de la petite taille des parcelles et de la similitude de leur rétrodiffusion avec d’autres types de végétaux, les plaques de phragmites demeurent difficiles à séparer des autres types de végétation inondée en utilisant seulement l’intensité de la bande C-HH.
Introduction
Synthetic Aperture Radar (SAR) data have been applied to a wide range of applications including sea-ice mapping, agriculture, forestry, geology, hydrology, wetland mapping, surface water and flood mapping, to name a few. The “Principles and Applications of Imaging Radar” edited by Henderson and Lewis (Citation1998) provide a good overview of the wide range of applications that SAR data have been used for. However, SAR is a coherent sensor and the data requires filtering to remove the inherent speckle noise. Numerous articles have been written on the characteristics and advantages/disadvantages of the wide range of speckle filters that have been developed for SAR data. Excellent reviews can be found in Touzi (Citation2002), Lee et al. (Citation1994), and Dekker (Citation1998).
With the increase in the number of SAR systems and the advent of SAR constellations, “stacks” of radar images for a particular region of interest can be assembled. This is important for a number of applications where multi-temporal data allows target change to be monitored. The RADARSAT Constellation Mission (RCM), which was launched in June, 2019, is the next generation SAR system in Canada (Thompson Citation2015). RCM is a 3-satellite constellation offering a much higher revisit capability (4 days), compared to the RADARSAT 1 & 2 programs which offered 24 day repeat cycles. This permits the generation of image stacks for a variety of applications and a different approach to speckle noise reduction. The use of a multi-temporal filter rather than the conventional spatial filtering approach can be an effective way to reduce speckle while maintaining resolution and the ability to detect small objects and edges (Caves et al. Citation2011; Quegan and Yu Citation2001; Wegmüller et al. Citation2002, Citation2013).
The detection of small patches of Phragmites australis in Georgian Bay Island National Park (GBINP) with high resolution C-HH SAR was investigated, as this is an on-going problem in the Great Lakes Region and the location of these patches is important information for effective management. The Phragmites patches and the surface water features can be very small and the edges are important to maintain so the multi-temporal filter may be advantageous for these applications. With RADARSAT-2’s 24-day repeat cycle the image stacks would contain 6–9 acquisitions from the ice-off season, therefore, temporal averaging would also reduce the temporal change. With the 4-day repeat cycle of RCM, stacks with a much higher number of observations are possible so that temporal averaging can be applied to a part of the stack for noise reduction while maintaining the temporal change that is of interest. Thus, the stacks could be averaged on a monthly or seasonal basis to achieve this.
The objective of this study was to compare two different multi-temporal filters in the GAMMA software package to the standard adaptive Lee and Enhance Lee filters, for the detection of the Phragmites patches in GBINP. Repeat pass RADARSAT-2 Spotlight data, which is the highest RADARSAT-2 resolution mode, are used to create the output products using the different filtering approaches. Visual image interpretation, the signal level ratio (SLR) and the equivalent number of looks (ENL) was computed for each output image and then used to compare the different filters. The results are discussed with respect to water resource applications in general and surface water and Phragmites monitoring application in particular.
Background
Active sensors such as SAR’s send electromagnetic waves that travel in phase and have minimal interactions when reaching targets on the ground. Once the interaction with ground targets has taken place, the frequency remains coherent, however, the waves become out of phase (Qiu et al. Citation2004). This results from a variety of factors including the differences in the distance the waves must travel back to the sensor due to different features interactions, or from differences in surface roughness causing single or multiple bounce scattering (Qiu et al. Citation2004). When SAR images are coherently processed it results in variations in intensity referred to as speckle or fading (Goodman Citation1976; Lee et al. Citation1994).
Speckle present in SAR images make it more challenging to map terrain features and classify land cover. Thus, it is necessary to reduce speckle prior to SAR interpretation, which can be done in two ways: (1) multi-look processing, and (2) spatial filtering. Multi-looking divides the radar bandwidth into many narrower sub-bandwidths, either in the azimuth or range, providing independent looks. The number of looks is averaged, resulting in less speckle, but also increases computational load and lowers image resolution if the number of looks is too large (Gagnon and Jouan Citation1997). Spatial filters use a moving window to calculate the weighted average of the window for each pixel. This smooths the image and increases interpretability. An effective filter should retain the signal mean while reducing the speckle and maintain edges.
Traditional adaptive filters (e.g., Lee, Kuan, GAMMA) use local statistics on a set window size to calculate the weighting factor (Beaulieu Citation2001). They are considered better than low-pass filters (e.g., average, median, and mode) because they consider the multiplicative character of speckle. Nevertheless, they also use an estimation of the coefficient of variation for the signal intensity to determine the homogeneity of locations (Beaulieu Citation2001). In some circumstances, this estimation is not accurate which results in anomalous results.
The Lee filter is predominantly used to remove high-frequency noise (speckle) while preserving high-frequency features (edges). Spatial filtering is applied to each pixel using the grey-level values in the moving-window (odd values with a minimum of 3 × 3) (Lee Citation1980). The size of the filter will have a big impact on the quality of the image. Filters that are too small are not effective, and filters that are too large results in the loss of subtle details.
The Enhanced Lee filter also attempts to reduce speckle and maintain edges but differs from the Lee filter in that it divides an image into three classes. The first class corresponds to homogeneous areas in which the speckle may be eliminated simply by allowing a low pass filter (multi-looking). The second class corresponds to the heterogeneous areas in which the speckle is reduced while preserving texture. The third class includes areas containing isolated point targets, in which the filter should preserve the observed value (Lopes et al. Citation1990).
Most filters are usually applied in the spatial domain, which reduces the effective resolution of the filtered image. Multi-temporal filters operate in both the spatial and temporal dimensions, thus the reduction in resolution is not as likely to be as severe. Previous research has shown that multi-temporal filtering is beneficial for several applications including monitoring of water intake volume in small reservoirs (Amitrano et al. Citation2014), agriculture (Caves et al. Citation2011), SAR classification (Bruzzone et al. Citation2004; Hachicha et al. Citation2011) and SAR change detection (Lê et al. Citation2014). Multi-temporal filtering effectiveness is determined by the number of images in the stack and the size of the filtering window. There are many different multi-temporal filters which have been developed (Chierchia et al. Citation2017; Deledalle et al. Citation2019; Gineste Citation1999; Lê et al. Citation2014; Su et al. Citation2014; Yuan et al. Citation2018; Zhao et al. Citation2018). At the time of this analysis, only the GAMMA multi-temporal filter and the Multi-temporal Lee filter were available in the GAMMA software, which was used to process the RADARSAT-2 imagery.
Multi-temporal filters linearly combine a stack of M ortho-rectified images over the same geographical location to produce M speckle-reduced images. In the filtering equation both the input intensity data and an estimate of the local mean backscattering coefficient are included (Quegan and Yu Citation2001):
(1)
(1)
where Jk is the filtered output
are the input intensity data
is the estimate of the local mean backscattering coefficient
A filtering method designed for multi-polarization and multi-frequency imagery was developed by Lee et al. (Citation1991). Each pixel at the same location in the stack of images were merged to calculate one filtered value for each pixel. The weight of each pixel was based on an optimality criterion (Lee et al. Citation1991). The Multi-temporal Lee filter is an extension of this method created for multi-temporal filtering developed by Bruniquel and Lopes (Citation1997). In this approach a statistical methodology is applied by estimating local statistics for each pixel in the image stack from a spatial window, then applies Kuan’s filter to get the texture compensation for the individual images. Finally, the summation weights are calculated resulting in optimal variance in the final image (Bruniquel and Lopes Citation1997). The same summation weights were used in the multi-temporal filtering method developed by Quegan and Yu (Citation2001). Other multi-temporal filters have attempted to enhance this calculation. For example, Wegmüller et al. (Citation2002) used an adaptive estimator to maximize the compromise between having a reliable local estimate and a small amount of spatial degradation. Another approach was to use a spatial filter that considers the individual scene to which the filter was being applied as well as the entire stack of images when calculating spatial averages (Caves et al. Citation2011). The GAMMA Multi-temporal filter method calculates an average image by applying pixel-wise averaging to the stack of images, which increases the ENL. Next the stack of co-registered images and the average image are used in spatial filtering. The GAMMA Multi-temporal filter uses the structural spatial filter created by Lee et al. (Citation1999), but with some noteworthy modifications. First, rather than only using an individual image to identify which structural window should be applied for spatial filtering the GAMMA Multi-temporal filter uses the average image (Wegmüller et al. Citation2013). The rationale for this was because of the lower noise in the average image in theory would be more reliable (Wegmüller et al. Citation2013). Second, the GAMMA Multi-temporal filter compares the highest value achieved to a threshold. If the highest value is lower than the threshold the authors assume that the images do not have a dominant structure, therefore use the extra homogeneous structure window (Wegmüller et al. Citation2013). Finally, the spatially filtered images output from the structural spatial filtering image intensity stack are input into the local mean backscattering coefficients (EquationEquation 1(1)
(1) ). For more complete details on the GAMMA Multi-temporal filter refer to Wegmüller et al. (Citation2013).
Methods
Site description
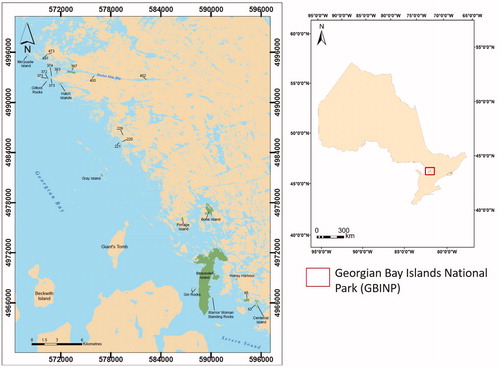
GBINP consists of 59 islands and shoals, and a small mainland area in south-central Georgian Bay, Ontario. This small park is part of the largest group of fresh-water islands worldwide. Our study site was located on Beausoleil Island National Historic Site of Canada (44°51′29.69 N, 79°5′13.05 W, ), which is the largest of the 59 islands. An assortment of wildlife can be found in GBINP including the Massasauga Rattlesnake, herring gulls, the snowy owl, and 35 species of amphibians and reptiles. It is also considered a transition zone for forest and plant species due to the weather and terrain (Parks Canada Citation2016).
Figure 1. Image showing the location of Georgian Bay Islands National Park, in Southern Ontario, Canada. The green polygon on the lower right portion of the image shows the extent of Beausoleil Island.
RADARSAT-2 acquisitions
Six Spotlight Single Look Complex (SLC) images were acquired in 2012 and 2013 of the GBINP (; ). SLC images are in the slant-range by azimuth imaging plane and each pixel includes the phase and amplitude information. The Spotlight beam mode was chosen to determine if the higher spatial resolution aids in detecting small patches of Phragmites. The details of the RADARSAT-2 acquisitions are listed in .
Figure 2. Sub-scene of Radarsat-2 SLA25 image of GBINP.
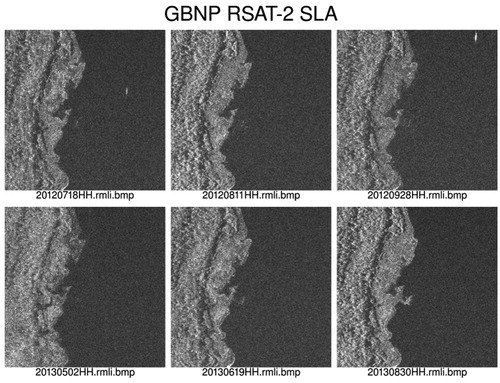
Table 1. Details of RADARSAT-2 spotlight data acquisitions over the Georgian Bay Islands National Park (GBINP).
SAR processing
GAMMA remote sensing software was used for all SAR processing (). All the SLC images were converted into GAMMA format. The SLC images were re-sampled using a polynomial model to co-register the acquisitions and then converted to intensity images. The Multi-temporal Lee filter, GAMMA Multi-temporal, Enhanced Lee filter, and Lee filter were applied to the intensity image for each date. Parameters for the filters are listed in . To facilitate accuracy assessment the unfiltered and filtered images were converted to raster files. Finally, the three measures of accuracy assessment were applied: visual assessment, signal to level ratio, and equivalent number of looks.
Figure 3. Processing chain used in GAMMA Remote Sensing software to apply filters and compare results.
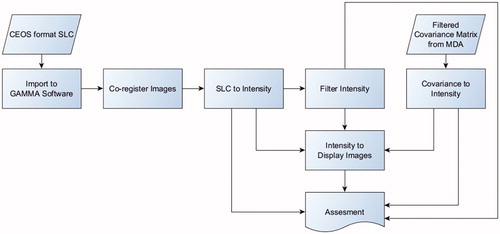
Table 2. Filter parameters for filters processed with GAMMA remote sensing software.
Filter evaluation and assessment
Three measurements were used to evaluate the four SAR filters. The first method, visual analysis, evaluated the ability to filter homogeneous and heterogeneous areas, while maintaining edges, texture and resolution. Comparing the SLR was the second method. SLR is the ratio of the unfiltered image to the filtered image averaged over a polygon. A mean of 1 indicates the filtered image preserves the signal level accurately. Conversely, if the mean varies from 1, it suggests that there is a bias in the filter. The third method, ENL, describes the degree of averaging on the SAR image that is a result of data measurements and post-processing. It is calculated as the square of the mean divided by the standard deviation of the intensity for a polygon of a homogenous area. The value of the ENL is greatly affected by heterogeneity in the measurement; therefore, care must be taken to selected homogenous areas to accurately measure the ENL.
Results and discussion
The test sub-scene contains forest, wetland, open water and boats (only in some scenes). Visual assessment of the SAR filters effect on the Spotlight Radarsat-2 imagery in GBINP showed that the GAMMA Multi-temporal filters reduced the speckle noise in both homogeneous and heterogeneous areas, while edges, texture and resolution were preserved (). The Multi-temporal Lee and the Enhanced Lee filters were able to dramatically reduce the speckle, yet most of the texture was lost due to blurring, particularly over the forested areas. Visually the GAMMA Multi-temporal filter was better able to maintain edges, texture and resolution over land and water; however, the Multi-temporal Lee filter was best able to maintain resolution over point targets. The temporal average provides high-resolution results but has problems in areas that change their backscatter between acquisitions especially for boats. The changes in open water and boat locations poses challenges to the filters. The temporal filtering improved the detection of some of the larger (∼30 m) patches of Phragmites in GBINP by making it easier to visualize the transition zone between double-bounce scattering and/or increased biomass around the water edges, though separation of Phragmites from other types of flooded vegetation like cattail or bulrush was not possible ().
Figure 4. Close up of intensity images from July 18, 2012 Radarsat-2 SLA25 acquisition of GBINP. These images compare four SAR filters to an unfiltered image and show that the GAMMA multi-temporal filter (GAMMA MT) was better able to maintain edges, texture and resolution in land and water.
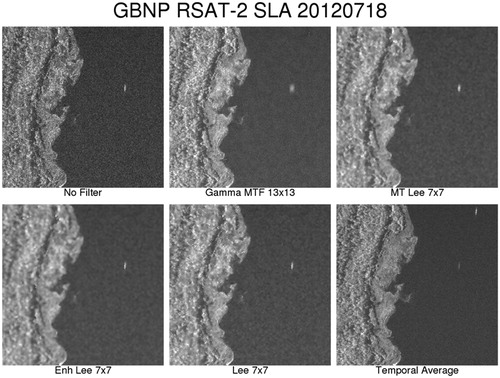
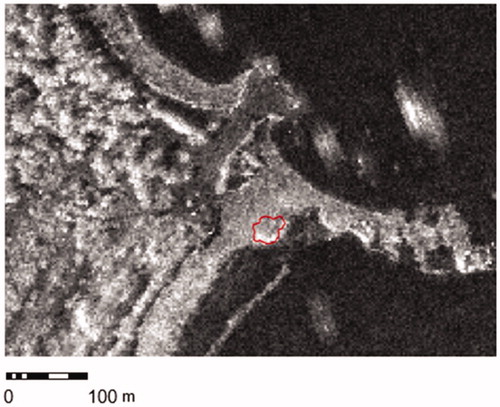
Figure 5. Example of how multi-temporal filtering improved the detection of one of the larger (30 m) patches of Phragmites (red polygon) on the July 18, 2012, RADARSAT-2 SLA25 imagery.
While agricultural fields and urban areas were not included in this analysis, we expect similar results. One of the important assumptions of multi-temporal filtering is that the spatial patterns in the image are constant over time. Agricultural fields and urban structures such as roads, buildings, and power lines usually meet this assumption (Wegmüller et al. Citation2013). The GAMMA Multi-temporal filter has been applied to agricultural fields in another study and results showed an increase in the ENL, individual scatters and sharp field boundaries were preserved (Wegmüller et al. Citation2013). The authors also demonstrated that for unstable geometries or bright targets the assumption was violated and the filter did not perform as well. Another study compared the single Lee filter to the multi-temporal Lee filter over agricultural fields using a stack of ALOS-2 data. The authors concluded that while the multi-temporal Lee filter resulted in sharper and clearer boundaries, the single Lee filter had a higher classification accuracy because overall there was less speckle in the image, thus for agricultural fields that change temporally the single Lee filter is preferred (Mirelva and Nagasawa Citation2017). Therefore, similar to phragmites patches, the results of multi-temporal filtering over agricultural and urban areas will likely depend on the amount of stable temporal spatial patterns and the type of multi-temporal filter applied.
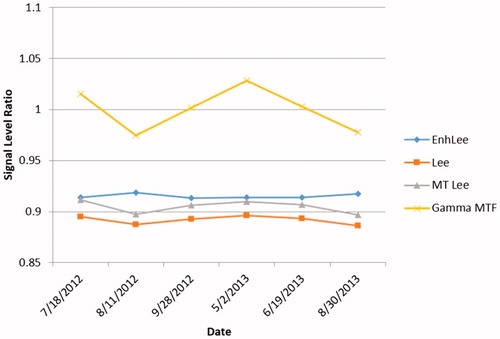
The SLR ratio values varied between SAR filters and image dates (). In general, the GAMMA Multi-temporal filter was close to unity while the Lee, Enhanced Lee, and Multi-temporal Lee were in the range of 0.89–0.98. The lower SLR is likely due to increased auto-correlation in the samples used for the filters. Thus, the GAMMA multi-temporal filter did the best job of maintaining the signal level indicating the filtered image preserves the signal level accurately.
Figure 6. The signal level ratio values for several SAR filters applied to RADARAT-2 Spotlight imagery in Georgian Bay Islands National Park.
SAR filtering improved the number of looks in all cases when compared to the unfiltered image in the GBINP. Nevertheless, it should be noted that autocorrelation within the filtering windows resulted in a lower number of ENL’s in all cases than would result if the images were uncorrelated. While uniform targets are assumed to be selected, there can still be lots of target variability in areas selected as homogeneous, resulting in less independent information.
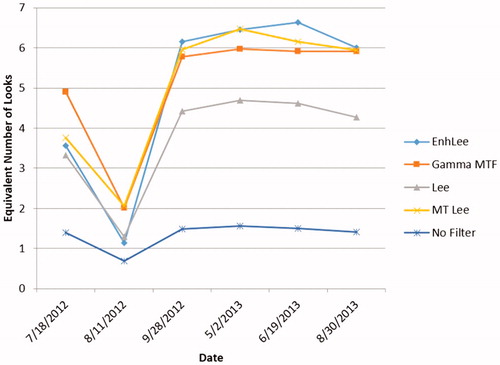
The Enhanced Lee filter usually had the highest number of looks (). The ENL increased from 1.5 before filtering to values of approximately 3-7, depending on the date. However, from the visual analysis, we can see that this compromised the resolution of the images on both land and water. These results are consistent with Martinez and Toan (Citation2007), who investigated multi-temporal filtering for flood dynamics and the spatial distribution of vegetation in a floodplain. They found that SAR filtering and in particular temporal filtering can significantly maintain spatial resolution in flooded areas, but that mapping accuracy can decrease if the ENL increases beyond a certain value, resulting in loss of spatial resolution (Martinez and Toan Citation2007). In contrast, Maghsoudi et al. (Citation2012) compared the multi-temporal filter by Quegan and Yu (Citation2001) and the Enhanced Frost filter (Frost et al. Citation1982) for forest mapping. The results showed while the spatial filter had a higher ENL than the multi-temporal filter this did not affect spatial resolution, as the resulting classification had a higher accuracy with the spatial speckle filter. There appears to be a date effect happening in the August 11, 2012 image. We evaluated the images for possible weather effects and looked for rain events from nearby weather stations, but did not find any evidence to support a weather effect theory.
Figure 7. The equivalent number of looks calculated for each of the Spotlight RADARSAT-2 images acquired over Georgian Bay Islands National Park.
SAR filtering increases the ENL’s, and therefore improves the radiometry in the Spotlight imagery. However, ENL’s that are too large will compromise the resolution rather than just filtering the speckle. Thus, there is a compromise between the amount of filtering and the loss of spatial texture. The use of multi-temporal filters can help maintain the resolution while decreasing the speckle noise. With the higher revisit period of modern SAR constellations, RCM will have a 4-day repeat cycle, the capability of multi-temporal filtering to be used for effective speckle suppression is appealing.
Conclusion
This research demonstrates multi-temporal filtering is effective at noise reduction while maintaining resolution. Of the four SAR filters that were compared, the GAMMA Multi-temporal filter was best able to remove speckle and preserve texture and resolution for both surface water and to detect Phragmites patches in GBINP. When acquiring a stack of SAR data for the detection of surface water the imagery should be acquired frequently to maintain seasonal variability information. In the case of Phragmites, detection patches can be averaged over an entire season if needed just to find patches and over monthly intervals to watch patch growth and development, but the resolution is critical due to small patch sizes. The use of multi-temporal filtering for both surface water and flooded vegetation is promising, especially given the launch of the RCM in 2019. However, further research is needed to be able to accurately detect and separate phragmites from other wetland classes.
Acknowledgements
We would like to acknowledge the Remote Sensing Science program at the Canada Centre for Mapping and Earth Observation with the support of the Canadian Space Agency through the Radarsat Constellation Mission program for supporting the project. Thanks to Prabir Roy of Parks Canada Agency for ground truth support in GBINP.
References
- Amitrano, D., Di Martino, G., Iodice, A., Riccio, D., Ruello, G., Ciervo, F., Papa, M.N., and Koussoubè, Y. 2014. “Effectiveness of high-resolution SAR for water resource management in low-income semi-arid countries.” International Journal of Remote Sensing, Vol. 35(No. 1): pp. 70–88. doi:10.1080/01431161.2013.862605.
- Beaulieu, J.M. 2001. “SAR image enhancement: Combining image filtering and segmentation.” Paper presented at The 2001 International Conference on Imaging Science, Systems, and Technology Computer, Las Vegas, Nevada, June 2001.
- Bruniquel, J., and Lopes, A. 1997. “Multi-variate optical speckle reduction in SAR imagery.” International Journal of Remote Sensing, Vol. 18(No. 3): pp. 603–627. doi:10.1080/014311697218962.
- Bruzzone, L., Marconcini, M., Wegmüller, U., and Wiesmann, A. 2004. “An advanced system for the automatic classification of multitemporal SAR images.” IEEE Transactions on Geoscience and Remote Sensing, Vol. 42(No. 6): pp. 1321–1334. doi:10.1109/TGRS.2004.826821.
- Caves, R., Davidson, G., Padda, J., and Ma, A. 2011. Final Report Vol. 2 Data Analysis – Multi-Temporal Filtering, Report No. 22689/09/NL/FF/ef. Paris: European Space Agency.
- Chierchia, G., Gheche, M.E., Scarpa, G., and Verdoliva, L. 2017. “Multitemporal SAR image despeckling based on block-matching and collaborative filtering.” IEEE Transactions on Geoscience and Remote Sensing, Vol. 55(No. 10): pp. 5467–5480. doi:10.1109/TGRS.2017.2707806.
- Dekker, R.J. 1998. “Speckle filtering in satellite SAR change detection imagery.” International Journal of Remote Sensing, Vol. 19(No. 6): pp. 1133–1146. doi:10.1080/014311698215649.
- Deledalle, C., Denis, L., Ferro-Famil, L., Nicolas, J., and Tupin, F. 2019. “Multi-temporal speckle reduction of polarimetric SAR images: A ratio-based approach.” Paper presented at IGARSS 2019–2019 IEEE International Geoscience and Remote Sensing Symposium, Yokohama, Kanagawa Prefecture, July 2019.
- Frost, V., Stiles, J., Shanmugan, K., and Holtzman, J. 1982. “A model for radar images and its application to adaptive digital filtering of multiplicative noise.” IEEE Transactions on Pattern Analysis and Machine Intelligence, Vol. 4(No. 2): pp. 157–166. doi:10.1109/tpami.1982.4767223.
- Gagnon, L., and Jouan, A. 1997. “Speckle filtering of SAR images—A comparative study between complex-wavelet-based and standard filters.” Paper presented at Proceedings of SPIE Wavelet Applications in Signal and Image Processing V, San Diego, California, October 1997.
- Gineste, P. 1999. “A Simple, efficient filter for multitemporal SAR images.” International Journal of Remote Sensing, Vol. 20(No. 13): pp. 2565–2576. doi:10.1080/014311699211930.
- Goodman, J.W. 1976. “Some fundamental properties of speckle.” Journal of the Optical Society of America, Vol. 66: pp. 1145–1150.
- Hachicha, S., Deledalle, C., Chaabane, F., and Tupin, F. 2011. “Multi-temporal SAR classification according to change detection operators.” Paper presented at 2011 6th International Workshop on the Analysis of Multi-temporal Remote Sensing Images (Multi-Temp), Trento, Trentino-Alto, July 2011. doi:10.1109/Multi-Temp.2011.6005066.
- Henderson, F.M., and Lewis, A.J. 1998. Principles and applications of imaging radar, manual of remote sensing: Third edition, volume 2. New York: John Wiley and Sons.
- Lê, T.T., Atto, A.M., Trouvé, E., and Nicolas, J.M. 2014. “Adaptive multitemporal SAR image filtering based on the change detection matrix.” IEEE Geoscience and Remote Sensing Letters, Vol. 11(No. 10): pp. 1826–1830. doi:10.1109/LGRS.2014.2311663.
- Lee, J.-S., Grunes, M.R., and de Grandi, G. 1999. “Polarimetric SAR speckle filtering and its implication for classification.” IEEE Transactions Geoscience and Remote Sensing, Vol. 37(No. 5): pp. 2363–2373. doi:10.1109/36.789635.
- Lee, J.-S., Grunes, M.R., and Mango, S.A. 1991. “Speckle reduction in multipolarization, multifrequency SAR imagery.” IEEE Transactions on Geoscience and Remote Sensing, Vol. 29(No. 4): pp. 535–544. doi:10.1109/36.135815.
- Lee, J.S., Jurkevich, L., Dewaele, P., Wambacq, P., and Oosterlinck, A. 1994. “Speckle filtering of synthetic aperture radar images: A review.” Remote Sensing Reviews, Vol. 8(No. 4): pp. 313–340. doi:10.1080/02757259409532206.
- Lee, J.S. 1980. “Digital image enhancement and noise filtering by use of local statistics.” IEEE Transactions on Pattern Analysis and Machine Intelligence, Vol. 2(No. 2): pp. 165–168. doi:10.1109/TPAMI.1980.4766994.
- Lopes, A., Touzi, R., and Nezry, E. 1990. “Adaptive speckle filters and scene heterogeneity.” IEEE Transactions on Geoscience and Remote Sensing, Vol. 28(No. 6): pp. 992–1000. doi:10.1109/36.62623.
- Maghsoudi, Y., Collins, M.J., and Leckie, D. 2012. “Speckle reduction for the forest mapping analysis of multi-temporal Radarsat-1 images.” International Journal of Remote Sensing, Vol. 33(No. 5): pp. 1349–1359. doi:10.1080/01431161.2011.568530.
- Martinez, J.-M., and Toan, T.L. 2007. “Mapping of flood dynamics and spatial distribution of vegetation in the Amazon floodplain using multitemporal SAR data.” Remote Sensing of Environment, Vol. 108(No. 3): pp. 209–223. doi:10.1016/j.rse.2006.11.012.
- Mirelva, P.R., and Nagasawa, R. 2017. “Single and multi-temporal filtering comparison on synthetic aperture radar data for agriculture area classification.” Paper presented at ICISPC 2017: Proceedings of the International Conference on Imaging, Signal Processing and Communication, Penang, Penang, July 2017.
- Parks Canada. 2016. “Georgian Bay Islands National Park.” Last modified April 1, 2017. https://www.pc.gc.ca/en/pn-np/on/georg/decouvrir-discovers/natcul1.
- Quegan, S., and Yu, J.J. 2001. “Filtering of multichannel SAR images.” IEEE Transactions Geoscience and Remote Sensing, Vol. 39(No. 11): pp. 2373–2379. doi:10.1109/36.964973.
- Qiu, F., Berglund, J., Jensen, J.R., Thakkar, P., and Ren, D. 2004. “Speckle noise reduction in SAR imagery using a local adaptive median filter.” GIScience & Remote Sensing, Vol. 41(No. 3): pp. 244–266. doi:10.2747/1548-1603.41.3.244.
- Su, X., Deledalle, C.A., Tupin, F., and Sun, H. 2014. “Two-step multitemporal nonlocal means for synthetic aperture radar images.” IEEE Transactions on Geoscience and Remote Sensing, Vol. 52(No. 10): pp. 6181–6196. doi:10.1109/TGRS.2013.2295431.
- Thompson, A.A. 2015. “Overview of the RADARSAT constellation mission.” Canadian Journal of Remote Sensing, Vol. 41(No. 5): pp. 401–407. doi:10.1080/07038992.2015.1104633.
- Touzi, R. 2002. “A review of speckle filtering in the context of estimation theory.” IEEE Transactions on Geoscience and Remote Sensing, Vol. 40(No. 11): pp. 2392–2404. doi:10.1109/TGRS.2002.803727.
- Wegmüller, U., Wiesmann, A., Strozzi, T., and Werner, C. 2002. “Forest mapping with multi-temporal SAR.” Paper presented at Proceedings ForestSAT’02 Conference, Edinburgh, Edinburgh and the Lothians, August 2002.
- Wegmüller, U., Santoro, M., and Werner, C. 2013. “Multi-temporal SAR data filtering for land applications.” Paper presented at ESA Living Planet Symposium, Edinburgh, Edinburgh and the Lothians, September 2013.
- Yuan, J., Lv, X., and Li, R. 2018. “A speckle filtering method based on hypothesis testing for time-series SAR images.” Remote Sensing, Vol. 10(No. 9): pp. 1383. doi:10.3390/rs10091383.
- Zhao, W., Deledalle, C., Denis, L., Maître, H., Nicolas, J., and Tupin, F. 2018. “RABASAR: A fast ratio based multi-temporal SAR despeckling.” Paper presented at IEEE IGARSS, Valencia, Valencia, July 2018.