
 ?Mathematical formulae have been encoded as MathML and are displayed in this HTML version using MathJax in order to improve their display. Uncheck the box to turn MathJax off. This feature requires Javascript. Click on a formula to zoom.
Abstract
Timely monitoring of crop production using a remote sensing-based approach offers promise toward enhancing food security. Statistical models developed using satellite data typically employ a single vegetation index from a single sensor for yield estimation. With the increasing availability of satellite datasets, there is now an opportunity to investigate the potential of available vegetation indices from different sensors in estimating yields. The key objective of this study was to develop a best-performing satellite-based yield model for the Canadian Prairies for wheat, barley, and canola, trained using municipality-level data from 2009 to 2019. We tested the statistical performance of models built using (a) indices from different sensors (Landsat and Sentinel-2), (b) indices sensitive to different yield properties, and (c) single versus multiple vegetation indices. Results showed Landsat-NDWI as the best performing single-index across all indices and sensors for each crop. Sentinel-2-EVI performed best for wheat and canola and Sentinel-2-SR for barley; but these models were built using only 4 years of data. We found that best-performing single-index models recorded similar predictive accuracy as multi-index models during model validation. The results from this work suggest that satellite-based yield estimation can be improved by selecting the right index related to different crop properties.
RÉSUMÉ
La surveillance en temps voulu de la production agricole à l’aide d’une approche basée sur la télédétection est prometteuse pour l’amélioration de la sécurité alimentaire. Les modèles statistiques développés à partir de données satellitaires utilisent généralement un seul indice de végétation provenant d’un seul capteur pour l’estimation des rendements. Avec la disponibilité croissante des ensembles de données satellitaires, il est désormais possible d’étudier le potentiel des indices de végétation disponibles provenant de différents capteurs pour l’estimation des rendements. L’objectif principal de cette étude était de développer un modèle de rendement basé sur les données satellitaires les plus performantes pour les Prairies canadiennes pour le blé, l’orge et le canola, entraîné à l’aide de données au niveau des municipalités de 2009 à 2019. Nous avons testé la performance statistique des modèles construits en utilisant (a) des indices provenant de différents capteurs (Landsat et Sentinel-2), (b) des indices sensibles à différentes propriétés de rendement, et (c) un seul indice de végétation par rapport à plusieurs. Les résultats ont montré que Landsat-NDWI était l’indice unique le plus performant parmi tous les indices et capteurs pour chaque culture. Sentinel-2-EVI a donné les meilleurs résultats pour le blé et le canola et Sentinel-2-SR pour l’orge; mais ces modèles ont été construits en utilisant seulement 4 années de données. Nous avons constaté que les modèles à indice unique les plus performants ont enregistré une précision prédictive similaire à celle des modèles multi-index lors de la validation du modèle. Les résultats de ce travail suggèrent que l’estimation du rendement par satellite peut être améliorée en sélectionnant le bon indice lié aux différentes propriétés des cultures.
Introduction
Timely, consistent, and reliable estimation of crop yields are key to making strategic decisions related to food security planning from local to global scales, especially under changing growing conditions. Crop yield is influenced by interactions between multiple factors such as weather, soil health, and management choices (e.g., irrigation, fertilizers). The influence of different factors that drive yields are reflected in crop growth conditions that can be directly measured using remotely sensed satellite imagery. Satellite data provides near-real-time intelligence on vegetation health status suitable for continuously monitoring and assessing crop yields over space and time (Sishodia et al. Citation2020). Historical and near-real time crop production insights are critical inputs for decision making by different agricultural stakeholders (farmers, crop insurers, policy makers, commodity traders) (Weiss et al. Citation2020; Karthikeyan et al. Citation2020).
Different agricultural stakeholders (e.g., producers, commodity traders, government, crop insurers) require different pieces of intelligence on agricultural production toward achieving diverse targets (). For example, producers want to optimize production quantity using historical and near-real time data, crop insurers aim to design satellite-based insurance contracts, and government or policy makers are interested in strengthening food security using satellite-based food monitoring systems. Accordingly, the role of satellite vegetation indices in providing context-specific yield insights in addition to accurate yield estimates is critical. Currently, most agricultural stakeholders rely on models using traditional single indices such as NDVI and EVI which may not be well suited to monitoring nutrient-stressed crops (e.g., in nutrient-limited regions) or water-stressed crops (e.g., in irrigation-limited regions). The careful selection and inclusion of additional information by combining multiple, different indices measuring different crop properties could be useful for supporting existing satellite-based agricultural intelligence capabilities.
Table 1. A selection of use-case applications of satellite-based vegetation indices by different agricultural stakeholders.
Most studies using a satellite-based approach for estimating crop yields employ a single vegetation index for deriving yield estimates (Liu et al. Citation2020; Bolton and Friedl Citation2013; Wall et al. Citation2008; Burke and Lobell Citation2017; Kouadio et al. Citation2014). Traditional vegetation indices derived from popular satellite data sources (AVHRRFootnote1, MODISFootnote2, Landsat) include normalized difference vegetation index (NDVI) and two-band enhanced vegetation index (EVI2), both tracking the biomass component of yield. MODIS-based EVI-2 has been found to perform better than NDVI at crop yield prediction previously (Liu et al. Citation2020). Some studies have found normalized water difference index (NDWI), which is sensitive to crop water content, to be an effective predictor of yields in more arid regions (Bolton and Friedl Citation2013). Other studies note that a green chlorophyll vegetation index (GCVI), tracking variation in chlorophyll concentration is better suited than NDVI or EVI to capture the effects of nutrient stress on resulting yields (Burke and Lobell Citation2017; Azzari et al. Citation2017). GCVI is used because it has been suggested to approximate LAI well (Nguy-Robertson et al. Citation2012). Another study using combined Landsat and Sentinel-2 data reports that best results were obtained by a model with NIR and red spectral bands (Skakun et al. Citation2019). Marszalek et al. (Citation2022) highlights the importance of indices tracking crop water and nitrogen content derived from red-edge and near-infrared bands of the Sentinel-2 sensor for yield prediction at the field level.
Few previous studies have evaluated the potential of combining multiple trait-specific vegetation indices for estimating yields or compared different satellite data sources and their value in estimating yields for multiple crops. Most previous studies (with a few exceptions; Zhao et al. (Citation2020), Ulfa et al. (Citation2022), Cavalaris et al. (Citation2021) have focused on studying one crop type (region-specific major crops) using a single satellite data source. Zhao et al. (Citation2020) investigated the potential of combining biomass and chlorophyll indices for wheat yield prediction at the field level using Sentinel-2 data. They found a small increase in model predictive skill when different indices at their respective peaks were combined. They recommend further testing of a multi-index modeling approach in different regions with diverse crop management practices. Similar results were also noted by Ulfa et al. (Citation2022) in modeling field-level wheat yields using multi-indices derived from Landsat data. Currently, a multi-index crop yield estimation approach remains mostly constrained to the field level and one crop type with limited data records.
In this study, we investigate the statistical performance of satellite-based crop yield models including single vegetation indices and multiple vegetation indices tracking different yield traits derived using different satellite datasets. We train and cross-validate all models using observed historical yield data (2009–2019) at the municipality level for three key crops (wheat, barley, canola) in the Canadian Prairies. The main objective of this study was to develop a best performing satellite-based crop yield model. Our study had the following three sub-objectives: (1) compare how well different vegetation indices available from different satellite sensors predict yields, (2) compare accuracy of single-index versus multi-index models for each sensor, and (3) evaluate if model performance improved when different indices sensitive to different yield properties were included in the same model.
Materials and methods
Study area: Canadian Prairies
The Canadian Prairies are an economically important region of Canada with field crop production accounting for almost half of agricultural operations in the region. Spring wheat, barley, and canola are the largest commodities grown by planted acreage. The study area covers the three provinces of Alberta, Saskatchewan, and Manitoba (). Regional agro-climatic conditions vary year-to-year resulting in differing growing environments. Precipitation is highly variable (300–500 mm per annum), both spatially and temporally, leading to moisture deficit and crop health stress in irrigation-limited areas. The growing season for annual spring crops begins with seeding in April and concludes with harvesting between early to late fall. Majority of the agricultural land in Manitoba is located within the moist black and dark gray soil zones. Agricultural regions of Alberta and Saskatchewan are located across differing soil zones experiencing varying interactions between soil and climate resulting in diverse crop growth environments.
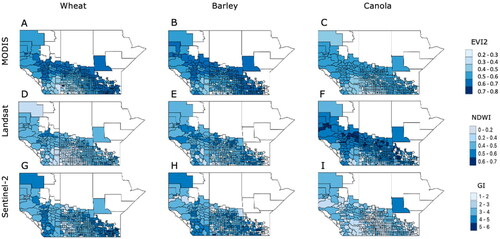
Figure 1. Spatial distribution of sensor-specific selected mean vegetation indices observed at the peak of the growing season at municipality level of the Canadian Prairies for wheat, barley and canola during the 2016–2019 period. Regions in white represent the absence of cropland within a given municipality.
Crop yield and satellite data (MODIS, Landsat, Sentinel-2)
There are a total of 503 municipalities within the Canadian Prairie Provinces. Municipality-level yield data for spring wheat, barley, and canola from 2009 to 2019 were obtained from different sources. Crop yield datasets for SaskatchewanFootnote3 and ManitobaFootnote4 were accessed from open-source databases maintained by provincial governments. Yield data for Alberta was provided by the Agriculture Financial Services Corporation (AFSC). Crop yield in this study refers to the end-of-season yield recorded by each reporting agency. As crop-specific harvested area at the municipality level is publicly unavailable, we were unable to set an area-related inclusion or exclusion threshold for municipalities. However, as we are modeling yields, estimated as production per unit harvested area, the outcome variable is normalized by area.
The sources of satellite imagery used in this study are MODIS (Terra) at 250 m spatial resolution, Landsat (7&8) at 30 m spatial resolution, and Sentinel-2 (A&B) at 10 m spatial resolution. MODIS and Landsat data records are available from 2009 to 2019. As Sentinel-2 data becomes available from 2016 onwards, Sentinel-2 data covers the period 2016–19. All satellite data products used were level-2 orthorectified, surface reflectance products. The satellite datasets provide contrast in temporal and spatial resolution that could affect the performance of satellite-based yield estimation methods. MODIS and Sentinel-2 imagery have a finer temporal resolution with daily and near-daily (every 3 d) revisit cycles respectively, compared to Landsat (7&8) imagery which is available every 16 d. As a previous study in the Prairies found seasonal peak EVI2 to perform better at crop yield estimation than other metrics derived using MODIS data (Liu et al. Citation2020), we extracted a single-index, EVI2, using MODIS data. With Landsat and Sentinel-2 data, we retrieved seven and ten trait-specific vegetation indices respectively (). Annual crop-specific masks freely available from the Canadian annual crop inventory at 30 m spatial resolution from 2011 onward (crop masks are available at 56 m spatial resolution for years 2009 and 2010) were applied prior to calculation of crop-specific indices. The crop-specific masks captured both spatial and temporal cropping conditions of only cropping areas within each municipality targeting the specificity of data used for model training toward improving the quality of estimates. A sensor-specific cloud mask with a threshold of < 10% cloud coverage was applied to all satellite imagery to obtain cloud-free pixels prior to calculation of indices. All suitable Landsat images were selected to derive maximum monthly composites toward the calculation of indices. Due to a 16-day repeat cycle associated with the Landsat sensor, there were missing values for some municipalities. MODIS- and Sentinel-2-based indices were extracted as maximum weekly composites. A previous study noted that yield estimation using Sentinel-2 data extracted at a weekly resolution had a superior performance than monthly resolution data as a weekly temporal scale better reflected the crop growth status (Marszalek et al. Citation2022). With each image collection, vegetation indices were extracted as a spatial mean at the municipality level. All satellite datasets were accessed and processed in Google Earth Engine (GEE) due to the platform’s capability in handling large volumes of satellite imagery (Gorelick et al. Citation2017). A selected summary of spatial distribution of satellite vegetation indices at municipality level used as model inputs is shown in .
Table 2. Sensor-specific vegetation indices tracking different properties of crop yield.
Crop yield estimation
We use a statistical linear regression modeling approach common in the literature to estimate yields from satellite indices (Johnson et al. Citation2021; Basso and Liu Citation2019). Two yield models, single-index and multi-index, for each crop were developed. Crop-specific biomass index, water index and chlorophyll index were combined in a multi-index modeling framework (EquationEquation 1(1)
(1) ) to test for additional improvements over a single-index model (EquationEquation 2
(2)
(2) ). In each multi-index model, we only included a single-index representing a specific yield trait as a potential predictor to avoid multi-collinearity issues. We also conducted additional testing for multicollinearity between different indices using Variance Inflation Factor (VIF) before including respective indices in multi-index models and found that combinations of indices that had lower VIF values also had lower Akaike information criterion (AIC) values. As we wanted to conduct a comprehensive analysis using a multi-index approach, we tested all possible combinations of trait-specific indices with Landsat data (12 trait-specific index combinations) and Sentinel-2 data (24 trait-specific index combinations) to identify the best combination of indices for yield estimation (). Models using a single index (EquationEquation 2
(2)
(2) ) for all Landsat- and Sentinel-2-derived indices individually were compared to multi-index models.
(1)
(1)
(2)
(2)
Where I = {B, W, C}
In the regression EquationEquations (1)(1)
(1) and Equation(2)
(2)
(2) ,
represents crop yield, I represents satellite vegetation index, M represents random municipality effects and T represents a linear year trend. BI, WI and CI represent a biomass, water and chlorophyll index respectively.
As imagery from different satellite sources are available at different times during the year, we developed both multi-index and single-index models at different time steps specific to the sensor to gauge which model performed best. With Landsat data, we developed monthly models within each growing season using monthly peak indices. Weekly models were developed for each of twenty-two weeks within each growing season using Sentinel-2 weekly index composites. With MODIS data, we developed a single model using seasonal peak vegetation index as peak stage was found to be the optimal time to obtain yield estimates by a previous study in the Prairies (Liu et al. Citation2020). We also investigated the performance of multi-stageFootnote5 against single stage models and found that a single stage model performed better than a multi-stage model for each crop at yield estimation (). All models include random municipality effectsFootnote6 to account for local variations at the municipality level due to differing management practices (e.g., irrigation, tillage, cultivars etc.) and linear year trend to account for the effects of technological developments on crop yield.
Model selection and assessments
We used the Akaike information criterion (AIC) as the model selection metric to identify the best-performing multi-index model combination over all possible index combinations considered. AIC as a model selection metric weight both model performance and model complexity. For models with the lowest AIC (AICc for small samples) value (), we performed leave-one-year-out cross-validation (LOOCV) to estimate the prediction error of chosen models at the municipality level. LOOCV as an out-of-sample validation test allows to evaluate the generalizability of a model in different years with different climatic conditions (Liu et al. Citation2020; Kouadio et al. Citation2014). Finally, we compared the prediction accuracy of chosen models using the following metrics: root-mean-square-error (RMSE) measured in tons per hectare, relative root-mean-square-error (RRMSE, %) to mean observed yield, and mean absolute error (MAE) measured in tons per hectare. We used an additional metric, Wasserstein distances (WD), to further evaluate model performance. WD is a distance metric that quantifies the difference or distance between two data distributions (Muskulus and Verduyn-Lunel Citation2011). The value of WD is equal to 0 if distributions are identical with the value of WD becoming larger as distributions become different. WD was calculated between the data distributions of observed and estimated yields.
Results
Overall performance of multi-index and single-index models at the municipality level
The best performing single-index and multi-index models using Landsat data during 2009–2019 performed quite similarly on cross-validation metrics (RRMSE range: 14.6–19.7% and 14.3–19.4% for single-index and multi-index models respectively across crops) (). We observed low WD values for best performing crop-specific single-index and multi-index Landsat models showing a good agreement between observed yields and estimated yields. For wheat, the multi-index combination EVI + SR + NDWI showed only a marginal increase in predictive power over NDWI, the best single-index predictor for wheat. A single-index model using NDWI performed slightly better than a multi-index model for barley and canola. For barley and canola, the prediction error of single-index NDWI model (multi-index model) is 18.69% (19.42%) and 16.45% (16.49%) respectively. The best performing multi-index combination for barley and canola were found to be EVI + SR + GI and EVI + SR + NDWI respectively. Overall, we note that a single index tracking water content in crops, NDWI, performed better than all other trait-specific Landsat indices tested for each crop. For example, compared to traditional indices such as NDVI derived using Landsat data, NDWI showed a slightly better performance. The prediction error (RRMSE (%)) of NDWI (NDVI) single-index model is 14.57% (15.14%) for wheat, 18.69% (19.69%) for barley and 16.45% (17.65%) for canola. For modeling cases tested using Landsat data, satellite predictors derived at the height of July (mid-season coinciding with peak of crop growth stage) was observed to perform better at yield estimation than predictors derived during other periods (early- and late-season) within the growing season. Further we note that yield estimation using Landsat data demonstrated improvements over yield estimates derived using MODIS data for each crop. The prediction error (RRMSE (%)) of the best performing Landsat (MODIS) model is 14.30% (16.09%) for wheat, 18.69% (20.16%) for barley and 16.45% (17.47%) for canola. The WD values of crop-specific best performing Landsat model are also low and comparable to WD values of a MODIS model highlighting a good agreement between observed and estimated yields across space and time. lists all cross-validation modeling results for the period 2009–2019.
Table 3. Cross validation performance metrics of best performing single-index and multi-index models for full time series (2009–2019). The best performing model (in bold) across model types for each crop was chosen using RMSE (RRMSE) and corresponding and WD values are bolded for the same model.
We further tested model performances during 2016–2019, matching Sentinel-2 data availability. The length of MODIS and Landsat data records used for model training was shortened to match Sentinel-2 records. During this shorter modeling period, Landsat-based single index GI (RRMSE: 12.79%) and NDWI (RRMSE: 15.02%) for wheat and barley respectively demonstrated good performance over MODIS-based and Sentinel-2-based models (). For wheat and barley, Landsat predictors derived at the height of July remained the optimal time period for obtaining yield estimates. Seasonal peak MODIS-EVI2 (RRMSE: 13.52%) had the lowest prediction error for canola (). With Sentinel-2 data, we observed that multi-index models were unable to demonstrate huge improvements over single-index models for each crop (). A single-index model using EVI (RRMSE: 18.17%) tracking biomass content had the lowest prediction error compared to a multi-index (EVI + TCARI + GI) model (RRMSE: 21.35%) for wheat. For barley and canola, a multi-index model performed marginally better than a single-index model. The best performing multi- index combination for barley and canola were found to be EVI + SR + NDWI and EVI + TCARI + GI respectively. The prediction error (RRMSE (%)) of the best performing multi-index (single-index) model is 18.57% (18.88%) for barley and 15.19% (15.31%) for canola. For models using Sentinel-2 data, indices derived toward end of June (week 25) for wheat and barley and at the beginning of August (week 32) for canola had lowest prediction errors. The cross-validation modeling results for the best performing single-index and multi-index models using Landsat and Sentinel-2 data during the 2016–19 period are presented in . Detailed results for 2016–19 period for wheat, barley and canola are presented in respectively in the appendix. and show the relationship between observed yield and yield estimated by the best performing single-index and multi-index models using Landsat and Sentinel-2 data and by a model using MODIS-EVI2 for periods 2009–2019 and 2016–2019 respectively. We observed an overall pattern of underestimation of high yields and overestimation of low yields using different satellite-based yield models. The spread of data points associated with the MODIS model for each crop is higher compared to Landsat and Sentinel-2 models during both modeling periods.
Figure 2. Benchmarking of best performing single-index and multi-index models using Landsat (7&8) data against MODIS single-index model for full time series (2009–2019) for wheat (Top panel), barley (Middle panel) and canola (Bottom panel). Observed yield shown along the y-axis range from 0 to 8 t/ha for wheat (A–C) and barley (D–F) and from 0 to 4 t/ha for canola (G–I).
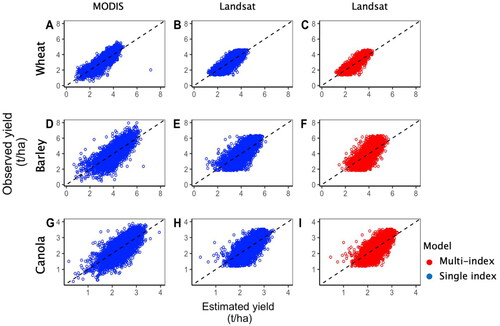
Figure 3. Benchmarking of best performing single-index and multi-index models using Landsat (7&8) and Sentinel-2 data against MODIS single-index model for the time period 2016–2019 for wheat (Top panel), barley (Middle panel) and canola (Bottom panel). Observed yield shown along the y-axis range from 0 to 6 t/ha for wheat (A–E), from 0 to 8 t/ha for barley (F–J) and from 0 to 4 t/ha for canola (K–O).
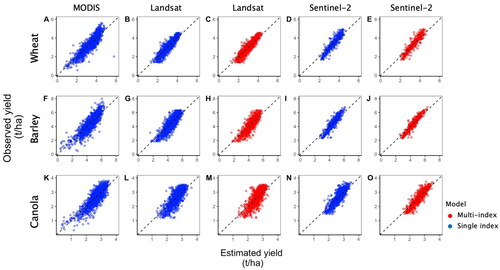
Table 4. Cross validation performance metrics of best performing single-index and multi-index during the time period corresponding to Sentinel-2 data availability (2016–2019).
Interannual variation in estimated yields
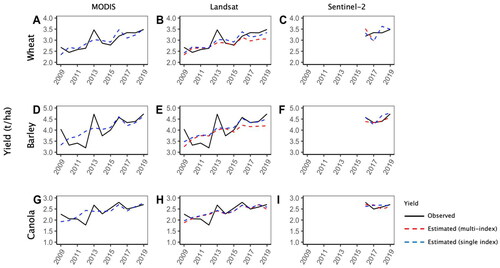
The best performing multi-index and single-index models using Landsat and Sentinel-2 data and MODIS single-index model were used to estimate crop yields at the municipality level over the study period. shows the mean interannual variation in model-estimated yield against observed yield for each crop. Crop yields have increased over the 11-year period with some interannual variation. Yield models based on MODIS and Landsat data were able to capture the overall observed trend over 2009–2019. We observed overestimation of low yields and underestimation of high yields by all models. Landsat-based multi-index and single-index models for canola demonstrated nearly identical estimation performance during the entire study period (). We noted some minor differences in estimation performance of both Landsat-based models for years 2013–2019 and 2009, 2015–2019 for wheat and barley respectively (). Interannual yield estimates varied by sensor-specific index predictors used to train models over the full period (). Sentinel-2 multi-index and single-index model performance during the 2016–2019 period varied by crop type (). A marginal difference in performance between both model types was seen for wheat and barley during this short time period () whereas for canola, both models exhibited similar performance ().
Figure 4. Mean annual variation in estimated yield against observed yield of wheat (Top panel), barley (Middle panel) and canola (Bottom panel) using MODIS baseline model (A,D,G) and best performing Landsat (B,E,H) and Sentinel-2 (C,F,I) models. Crop yield shown along the y-axis range from 2 to 4 t/ha for wheat (A–C), from 3 to 5 t/ha for barley (D–F) and from 1 to 3 t/ha for canola (G–I). A simple yield average across all municipalities was calculated to get an annual mean yield value for inter-year comparison of model estimated yield to observed yield.
Evaluation of model performance at municipality level
The comparison of model performance over the 2009–2019 period showed that results were quite similar when using a dataset including either the best set of Landsat-based indices or a MODIS index. (). The ranges of RRMSE for wheat, barley and canola using Landsat (MODIS) data were −67% (−80%) to 56% (58%), −71% (−93%) to 87% (92%) and −61% (−68%) to 85% (85%) respectively. The overall spatial distribution of yields estimated using different satellite index predictors during periods, 2009 and 2019, for wheat, barley and canola is shown in respectively. The spatial distribution of estimated yields for each crop showed that model performances varied slightly across the agricultural municipalities by the index predictor(s) used for model training. The spatial distribution of model estimation error (underestimation, overestimation, no change) for wheat, barley and canola is presented in respectively in the appendix. We note that models were able to capture the increase in yields observed between 2009 and 2019 in some municipalities. Overall, satellite-based yield models were able to satisfactorily reproduce spatial yield variations observed at the municipality level as documented by different yield reporting agencies which is highlighted by low WD values ( and and ). WD values of best performing single-index and multi-index models using Landsat and Sentinel-2 data range between 0.11 − 0.33 and 0.10 − 0.46 respectively.
Figure 5. Ranges of cross validation model prediction error (RMSE) relative to mean observed yield at the municipality level, 2009–2019 period, for best performing model using Landsat data (EVI + SR + NDWI for wheat, NDWI for barley and canola) and MODIS data (EVI2) for each crop.
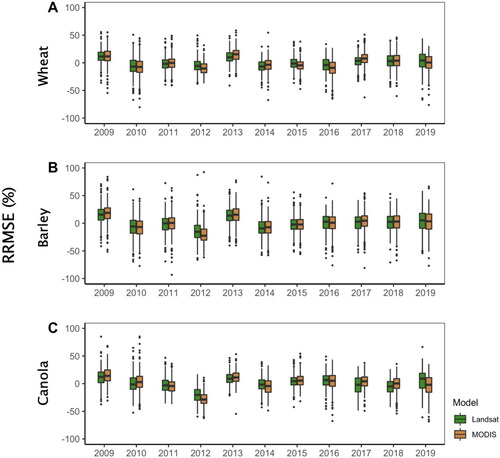
Figure 6. Spatial distribution of observed yield and estimated yield of wheat using different satellite index predictors for 2009 and 2019. Landsat-NDWI is the best performing single-index. Best performing multi-index combination using Landsat data for wheat is EVI + SR + NDWI. Regions in white represent absence of cropland within a given municipality. Regions in grey represent municipalities for which an model-specific yield estimate is unavailable.
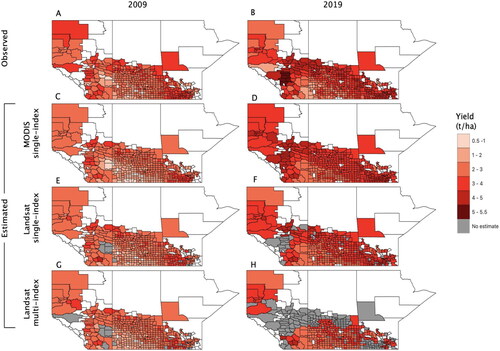
Figure 7. Spatial distribution of observed yield and estimated yield of barley using different satellite index predictors for 2009 and 2019. Landsat-NDWI is the best performing single-index. Best performing multi-index combination using Landsat data for wheat is EVI + SR + GI. Regions in white represent absence of cropland within a given municipality. Regions in grey represent municipalities for which an model-specific yield estimate is unavailable.
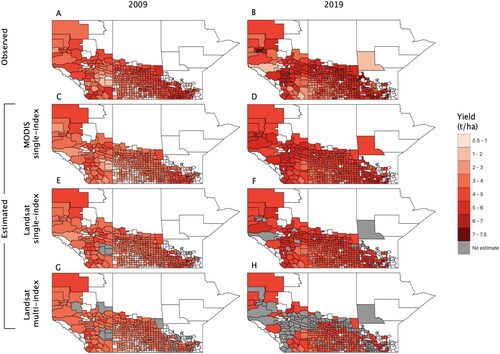
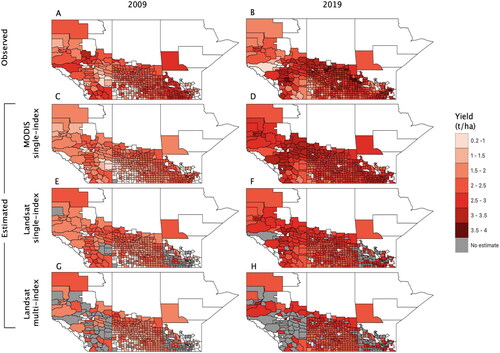
Figure 8. Spatial distribution of observed yield and estimated yield of canola using different satellite index predictors for 2009 and 2019. Landsat-NDWI is the best performing single-index. Best performing multi-index combination using Landsat data for wheat is EVI + SR + NDWI. Regions in white represent absence of cropland within a given municipality. Regions in grey represent municipalities for which an model-specific yield estimate is unavailable.
Discussion
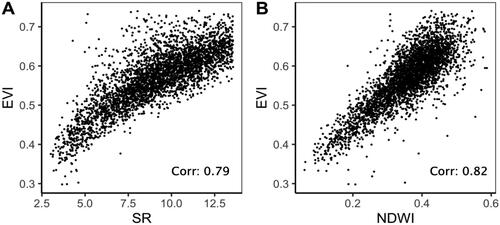
This study investigated the potential of combining multiple, different trait-specific satellite-based vegetation indices over using single indices for crop yield estimation using different satellite datasets. Modeling results show that multi-index models based on Landsat and Sentinel-2 data were unable to demonstrate large improvements over models using sensor-specific single indices at yield prediction ( and ). Combining vegetation indices tracking different yield traits namely biomass, water content and chlorophyll content does not seem to provide additional information on crop health and it is likely that overlapping signals results in a lack of improvement in multi-index models. For example, shows the relationship between best performing Landsat-based indices identified for multi-index model (EVI + SR + NDWI) for wheat. High correlations (> 0.75) are observed between biomass index (EVI) and chlorophyll index (SR) () and between biomass index (EVI) and water index (NDWI) () (Detailed correlation results for wheat, barley, and canola are shown in respectively in the appendix). Additional research should consider the inclusion of raw band values of satellite images that are used to calculate indices as ratios of bands to investigate if yield estimation quality improves for a multi-index model trained with specific satellite bands. For example, one of the bands included in all chosen indices in the Landsat-based multi-index model for wheat, EVI + SR + NDWI, covers the near-infrared (NIR) spectrum. The NIR-based band tracks the chlorophyll aspect of yield quality and the importance of this band was previously reported (Skakun et al. Citation2019; Marszalek et al. Citation2022; Prey and Schmidhalter Citation2019). Marszalek et al. (Citation2022) notes that Sentinel-2-based raw bands covering the red and NIR spectrum achieved higher accuracies than the index-based approach at yield estimation.
Figure 9. Correlation between best performing Landsat-based vegetation indices used in a multi-index model for wheat (EVI + SR + NDWI).
In this study, single-index models showed prediction performance equivalent to the performance of multi-index models. Model tests during the full study period (2009–2019) showed that Landsat-based single-index models using NDWI performed slightly better than models using multi-indices for barley and canola. For wheat, the prediction performance of the multi-index model was marginally better than the single-index model. A summary of the best-performing Landsat-based single-index and multi-index models during the 2009–2019 period is presented in and respectively. Previous studies have reported similar findings when combining multiple different indices sensitive to different yield traits for prediction of crop yields at the field level (Zhao et al. Citation2020; Ulfa et al. Citation2022; Cavalaris et al. Citation2021; Li et al. Citation2022). Ulfa et al. Citation2022 assessed different combinations of Landsat-based biomass and chlorophyll indices and found that a combination of EVI + GCVI performed marginally better than single indices for predicting field level wheat yields. Using Sentinel-2 derived indices, statistical models driven by index combinations such as NDVI + NDRE1, NDVI + NDWI, EVI + NDWI and GCVI + EVI2 have produced slightly better yield estimates over models using a single index (Zhao et al. Citation2020; Cavalaris et al. Citation2021; Li et al. Citation2022). Landsat-based single-index models again demonstrated better prediction performance than multi-index models for each crop during the 2016–19 period. Using Sentinel-2 indices, single-index model using EVI outperformed the multi-index model for wheat whereas prediction performance of single-index models and multi-index models was comparable for barley and canola. As EVI is less prone to saturation with dense crop biomass and better reflects crop health, Sentinel-2-EVI was similarly found to be an important predictor of crop yield in a previous study (Pejak et al. Citation2022; Li et al. Citation2022).
Table 5. Best performing crop-specific, sensor-specific single indices.
Modeling results show that a single-index modeling approach has the potential to perform well compared to a multi-index approach as long as a user employs an appropriate vegetation index suited to the particular satellite product in a yield estimation model. With a single-index approach, identifying the best crop-specific, region-specific and sensor-specific vegetation index is critical for obtaining high quality yield estimates. In contrast, a multi-index modeling approach is beneficial when a user wants to phase out the index identification and selection process. Using a multi-index approach, an user can let the model automatically select and use the index that best tracks a particular yield trait through a growing season (e.g., drought vs non-drought year) to produce estimates. Further testing of a multi-index modeling approach could provide higher utility at yield estimation in operational applications (e.g., forecasting yields, commodity arrival prediction) monitoring diverse agricultural regions. Users deploying a Landsat-based model in an operational environment might observe missing yield estimates in some agricultural regions due to less frequent (16-day) repeat cycle of the sensor and cloud cover. In the future, the application of a Sentinel-2-based model in such a scenario is promising as it has a better repeat cycle (near-daily, that is, every three days) than Landsat. A summary of the best performing crop- specific, satellite sensor-specific single-index and multi-index combinations identified during the two periods tested in this study is presented in and respectively.
Table 6. Best performing crop-specific, sensor-specific multi-index combinations.
Results further revealed the importance of some vegetation indices that could be useful toward improving yield estimates in the Prairie agricultural region. Landsat-based single-index, NDWI, which is sensitive to crop moisture content demonstrated predictive skill similar to multi-index models when tested during the full study period. This finding highlights the capability of NDWI in tracking plant water fluctuations and its resulting impacts on final crop yield. NDWI has been similarly found to be a more effective predictor of crop yields compared to indices such as NDVI and EVI in arid agricultural regions and in croplands with highly variable soil properties (e.g., salinity) (Bolton and Friedl Citation2013; Cavalaris et al. Citation2021). This suggests that the quality of existing regional yield forecast models could be improved by using NDWI instead of NDVI or EVI as commonly practiced. For example, the Canadian crop yield forecaster tool currently uses NDVI with climate data as inputs to forecast crop yields in agricultural regions of Canada (Chipanshi et al. Citation2015). Further exploration of predictors such as NDWI that better represent crop health status over the growing season may be useful for analyzing the spatial variation of crop yields specially in those regions where NDVI does not perform well. With Sentinel-2 derived indices, single-index EVI achieved prediction skill which was close to a multi-index model for wheat and canola. A previous study by Cavalaris et al. Citation2021 reports similar findings where a model involving seasonal maximum Sentinel-2 EVI had the best performance at prediction of wheat yields. Additionally, our findings on the sensor-specific optimal time period to source predictors, that is at the height of July with Landsat indices and during June-to-August for crop-specific Sentinel-2 indices, could be useful toward developing within-season yield forecasting models. We further note that overall performance of Landsat-based indices were found to be better than MODIS-EVI2 during the 2009–19 period. Such an insight could be valuable for agricultural risk planning and management. Agricultural stakeholders such as crop insurers currently using MODIS-based data for applications such as designing index-based insurance could consider Landsat-based indices to identify any difference in value proposition for farmers when using different satellite data inputs for insurance design. In the near-recent modeling period (2016–19), MODIS-EVI2 had a better prediction performance for canola over all other indices. Such a finding indicates the importance of both better spatial resolution of Landsat and better temporal resolution of MODIS in tracking crop yields at large scales of aggregation. A previous study reported similar findings when MODIS- and Landsat-based indices were tested for monitoring crop yields in contrasting agricultural regions of the U.S. and India (Azzari et al. Citation2017).
Although crop yield models using Sentinel-2 indices were unable to demonstrate marked improvements over MODIS- and Landsat-based models at the coarser municipality level, many studies have highlighted the potential of Sentinel-2 data for yield prediction at finer spatial levels (e.g., field, farm, landscape) (Hunt et al. Citation2019; Segarra et al. Citation2022; Zhao et al. Citation2020; Cavalaris et al. Citation2021; Kayad et al. Citation2019). Our future work will look into evaluation of the best performing Sentinel-2 indices identified in the current study using high resolution field level crop yield data in the Canadian Prairies. For example, we found that green index (GI) outperformed NDWI in tracking plant water signals for wheat and canola in each multi-index combination tested using Sentinel-2 data. GI has been noted to be sensitive to irrigation status in a previous study (Deines et al. Citation2017) and further testing at the field level could help guide management decisions for yield optimization.
The spatial pattern of yields estimated using different models varied slightly for each crop across some agricultural regions of the Canadian Prairies. These results indicate that chosen satellite index/indices drive the location-specific performance of models requiring further testing and identification of location-specific best vegetation index for monitoring crop health at the sub-regional or field level in the Prairies. For example, Bolton and Friedl Citation2013 recommends a mixed model, NDWI in more arid regions (for its ability to detect irrigation) and EVI2 in other regions, for predicting maize yield in U.S. counties.
The results of this study showed that statistical yield models based solely on vegetation indices were unable to capture well the extreme training data points. Additionally, model performance was weak in some years shown by the upward and downward spikes in model residuals ( and ). Models highly underestimated crop yields in years 2009 and 2013 and overestimated yields in 2012. A study investigating climate variability impacts on crop production in the Canadian Prairies over the 2000–13 period found that drought conditions in 2009 and 2012 resulted in below average crop productivity, mostly in Alberta and Saskatchewan (Dong et al. Citation2016). Incorporating additional predictors related to weather and environmental data could help improve performance of models driven solely by vegetation indices in such scenarios. As pure vegetation index-based methods are unable to track yield outcomes in atypical growth conditions (e.g., droughts, high temperatures), a study tested several input datasets (vegetation indices, weather data, environmental variables) and models (linear regression, polynomial regression and machine learning) for estimating yields (Sakamoto Citation2020). They found that a machine learning model, Random Forest, incorporating additional environmental variables provided accurate yield estimates during a drought year. Statistical models based on machine learning algorithms has advantages over a traditional regression model especially when some predictors are highly correlated (Jeong et al. Citation2016). Efforts are currently underway to integrate weather and environmental data in satellite-based models of crop yield. Introducing additional information representing variability of environmental conditions may improve the current performance of models in atypical production years. We plan to further evaluate the potential of state-of-the-art machine and deep learning algorithms in detecting spatiotemporal variation in yields over traditional regression models using high spatial resolution yield datasets. Such efforts will provide further exploration of predictors that improve representation of atypical impacts on final crop yield which could be useful for stakeholders such as crop insurers, commodity traders and policy analysts.
Conclusion
Timely and consistent monitoring of crop production using a satellite-based approach is one way to enhance food production and overall food security. A satellite-based approach is advantageous as it can be applied in data sparse regions to obtain crop yield estimates. This study assessed the performance of several vegetation indices derived from different satellite datasets within two modeling approaches for crop yield estimation in the Canadian Prairies. Both single-index and multi-index models demonstrated similar performance at yield estimation over a 11-year period (2009–2019) for each crop (wheat, barley, canola). Single-index, NDWI, outperformed other Landsat-based indices for each crop during this period. Our analysis further showed that best performing crop-specific model using Landsat data produced yield estimates that were marginally better than models using MODIS-EVI2. Spatial examination of estimated yields revealed slightly varying location-specific performance of models trained using different index predictors. Such findings indicate the need to identify the best vegetation index/indices within different agricultural subregions toward improving statistical-based yield estimates. Furthermore, introduction of additional weather and environmental variables within pure vegetation index-based yield models may help improve prediction of interannual yield variability within a given administrative unit or in atypical production years (e.g., droughts, high temperatures). Overall, this study highlights the importance of exploring and testing different vegetation indices capturing different aspects of plant growth toward improving yield estimates and for further use in applications such as yield forecasting in agricultural regions under changing growing conditions.
Acknowledgements
We thank Agriculture Financial Services Corporation (AFSC) for providing crop yield data for Alberta (2009–2019).
Disclosure statement
The authors report that there are no competing interests to declare.
Additional information
Funding
Notes
1 AVHRR: Advanced Very High Resolution Radiometer
2 MODIS: Moderate Resolution Imaging Spectroradiometer
3 Saskatchewan crop yields: https://applications.saskatchewan.ca/agrrmyields
4 Manitoba crop yields: https://www.masc.mb.ca/masc.nsf/mmpp_index.html
5 As including multi-step information from the same growing season introduces collinearity between predictors and influences sensitivity of model coefficients, we decided to eliminate multi-stage models from the linear regression modelling approach.
6 Regression models with municipality as a fixed effect were also tested (results not shown). As models with fixed effects did not influence results significantly and due to flexibility of models including a random effect, we present and discuss results for latter models.
References
- Azzari, G., Jain, M., and Lobell, D.B. 2017. “Towards fine resolution global maps of crop yields: Testing multiple methods and satellites in three countries.” Remote Sensing of Environment, Vol. 202: 129–141. doi:10.1016/j.rse.2017.04.014.
- Basso, B., and Liu, L. 2019. “Seasonal crop yield forecast: Methods, applications, and accuracies.” Advances in Agronomy, 154: 201–255. doi:10.1016/bs.agron.2018.11.002.
- Becker-Reshef, I., Justice, C., Sullivan, M., Vermote, E., Tucker, C., Anyamba, A., Small, J., et al. 2010. “Monitoring global croplands with coarse resolution earth observations: The global agriculture monitoring (GLAM) project.” Remote Sensing, Vol. 2 (No. 6): 1589–1609. doi:10.3390/rs2061589.
- Benami, E., Jin, Z., Carter, M.R., Ghosh, A., Hijmans, R.J., Hobbs, A., Kenduiywo, B., and Lobell, D.B. 2021. “Uniting remote sensing, crop modelling and economics for agricultural risk management.” Nature Reviews Earth & Environment, Vol. 2 (No. 2): 140–159. doi:10.1038/s43017-020-00122-y.
- Beneke, C., Chartrand, R., Kontgis, C., and Rich, D. 2019. “Automated monitoring of small grains in the middle East and North Africa for food security early warning.” In Remote Sensing for Agriculture, Ecosystems, and Hydrology XXI, 11149:62–72. SPIE. doi:10.1117/12.2532840.
- Bokusheva, R., Kogan, F., Vitkovskaya, I., Conradt, S., and Batyrbayeva, M. 2016. “Satellite-based vegetation health indices as a criteria for insuring against drought-related yield losses.” Agricultural and Forest Meteorology, Vol. 220 (No. 10): 200–206. doi:10.1016/j.agrformet.2015.12.066.
- Bolton, D.K., and Friedl, M.A. 2013. “Forecasting crop yield using remotely sensed vegetation indices and crop phenology metrics.” Agricultural and Forest Meteorology, Vol. 173: 74–84. doi:10.1016/j.agrformet.2013.01.007.
- Bontemps, S., Arias, M., Cara, C., Dedieu, G., Guzzonato, E., Hagolle, O., Inglada, J., et al. 2015. “Building a data set over 12 globally distributed sites to support the development of agriculture monitoring applications with sentinel-2.” Remote Sensing, Vol. 7 (No. 12): 16062–16090. doi:10.3390/rs71215815.
- Borgogno-Mondino, E., Sarvia, F., and Gomarasca, M. A. 2019. “Supporting Insurance Strategies in Agriculture by Remote Sensing: A Possible Approach at Regional Level.” In Computational Science and Its Applications – ICCSA 2019, edited by S. Misra, O. Gervasi, B. Murgante, E. Stankova, V. Korkhov, C. Torre, A.M.A.C. Rocha, D. Taniar, B.O. Apduhan, and E. Tarantino, 186–199. Cham: Springer International Publishing. doi:https://doi.org/10.1007/978-3-030-24305-0_15.
- Brown, J.F., and Shahriar Pervez, M. 2014. “Merging remote sensing data and national agricultural statistics to model change in irrigated agriculture.” Agricultural Systems, Vol. 127: 28–40. doi:10.1016/j.agsy.2014.01.004.
- Burke, M., and Lobell, D.B. 2017. “Satellite-based assessment of yield variation and its determinants in smallholder African systems.” Proceedings of the National Academy of Sciences of the United States of America, Vol. 114 (No. 9): 2189–2194. doi:10.1073/pnas.1616919114.
- Cavalaris, C., Megoudi, S., Maxouri, M., Anatolitis, K., Sifakis, M., Levizou, E., and Kyparissis, A. 2021. “Modeling of durum wheat yield based on sentinel-2 imagery.” Agronomy, Vol. 11 (No. 8): 1486. doi:10.3390/agronomy11081486.
- Chipanshi, A., Zhang, Y., Kouadio, L., Newlands, N., Davidson, A., Hill, H., Warren, R., et al. 2015. “Evaluation of the integrated canadian crop yield forecaster (ICCYF) model for in-season prediction of crop yield across the canadian agricultural landscape.” Agricultural and Forest Meteorology, Vol. 206: 137–150. doi:10.1016/j.agrformet.2015.03.007.
- Cicek, H., Sunohara, M., Wilkes, G., McNairn, H., Pick, F., Topp, E., and Lapen, D.R. 2010. “Using vegetation indices from satellite remote sensing to assess corn and soybean response to controlled tile drainage.” Agricultural Water Management, Vol. 98 (No. 2): 261–270. doi:10.1016/j.agwat.2010.08.019.
- Condro, A., Setiawan, Y., Prasetyo, L., Pramulya, R., and Siahaan, L. 2020. “Retrieving the national main commodity maps in indonesia based on high-resolution remotely sensed data using cloud computing platform.” Land, Vol. 9 (No. 10): 377. doi:10.3390/land9100377.
- Deines, J.M., Kendall, A.D., and Hyndman, D.W. 2017. “Annual irrigation dynamics in the U.S. northern high plains derived from landsat satellite data.” Geophysical Research Letters, Vol. 44 (No. 18): 9350–9360. doi:10.1002/2017GL074071.
- Dong, T., Liu, J., Shang, J., Qian, B., Huffman, T., Zhang, Y., Champagne, C., and Daneshfar, B. 2016. “Assessing the impact of climate variability on cropland productivity in the Canadian prairies using time series MODIS FAPAR.” Remote Sensing, Vol. 8 (No. 4): 281. doi:10.3390/rs8040281.
- Doraiswamy, P. C., Akhmedov, B., Beard, L., Stern, A., and Mueller, R. 2007. “Operational prediction of crop yields using modis data and products,” ISPRS Archives XXXVI-8/W48 Workshop Proceedings: Remote Sensing Support to Crop Yield Forecast and Area Estimates, 6. https://www.ars.usda.gov/ARSUserFiles/1430/isprs_agrifish_final.pdf
- Forkuor, G., Conrad, C., Thiel, M., Zoungrana, B., and Tondoh, J. 2017. “Multiscale remote sensing to map the spatial distribution and extent of cropland in the sudanian savanna of West Africa.” Remote Sensing, Vol. 9 (No. 8): 839. doi:10.3390/rs9080839.
- Franz, T.E., Pokal, S., Gibson, J.P., Zhou, Y., Gholizadeh, H., Tenorio, F.A., Rudnick, D., et al. 2020. “The role of topography, soil, and remotely sensed vegetation condition towards predicting crop yield.” Field Crops Research, Vol. 252: 107788. doi:10.1016/j.fcr.2020.107788.
- Gorelick, N., Hancher, M., Dixon, M., Ilyushchenko, S., Thau, D., and Moore, R. 2017. “Google earth engine: Planetary-scale geospatial analysis for everyone.” Remote Sensing of Environment, Vol. 202: 18–27. doi:10.1016/j.rse.2017.06.031.
- Ha, T., Shen, Y., Duddu, H., Johnson, E., and Shirtliffe, S.J. 2022. “Quantifying hail damage in crops using sentinel-2 imagery.” Remote Sensing, Vol. 14 (No. 4): 951. doi:10.3390/rs14040951.
- Hunt, M.L., Blackburn, G.A., Carrasco, L., Redhead, J.W., and Rowland, C.S. 2019. “High resolution wheat yield mapping using sentinel-2.” Remote Sensing of Environment, Vol. 233: 111410. doi:10.1016/j.rse.2019.111410.
- Jeong, J.H., Resop, J.P., Mueller, N.D., Fleisher, D.H., Yun, K., Butler, E.E., Timlin, D.J., et al. 2016. “Random forests for global and regional crop yield predictions.” PLOS One, Vol. 11 (No. 6): e0156571. doi:10.1371/journal.pone.0156571.
- Johnson, D.M., Rosales, A., Mueller, R., Reynolds, C., Frantz, R., Anyamba, A., Pak, E., and Tucker, C. 2021. “USA crop yield estimation with MODIS NDVI: Are remotely sensed models better than simple trend analyses?” Remote Sensing, Vol. 13 (No. 21): 4227. doi:10.3390/rs13214227.
- Karlson, M., Ostwald, M., Bayala, J., Bazié, H.R., Ouedraogo, A.S., Soro, B., Sanou, J., and Reese, H. 2020. “The potential of sentinel-2 for crop production estimation in a smallholder agroforestry landscape, Burkina Faso.” Frontiers in Environmental Science, Vol. 8: 85. doi:10.3389/fenvs.2020.00085.
- Karthikeyan, L., Chawla, I., and Mishra, A.K. 2020. “A review of remote sensing applications in agriculture for food security: crop growth and yield, irrigation, and crop losses.” Journal of Hydrology, Vol. 586: 124905. doi:10.1016/j.jhydrol.2020.124905.
- Kayad, A., Sozzi, M., Gatto, S., Marinello, F., and Pirotti, F. 2019. “Monitoring within-field variability of corn yield using sentinel-2 and machine learning techniques.” Remote Sensing, Vol. 11 (No. 23):pp. 2873. doi:10.3390/rs11232873.
- Kölle, W., Buchholz, M., and Musshoff, O. 2022. “Do high-resolution satellite indices at field level reduce basis risk of satellite-based weather index insurance?” Agricultural Finance Review, Vol. 82 (No. 4): 616–640. doi:10.1108/AFR-12-2020-0177.
- Kouadio, L., Newlands, N.K., Davidson, A., Zhang, Y., and Chipanshi, A. 2014. “Assessing the performance of MODIS NDVI and EVI for seasonal crop yield forecasting at the ecodistrict scale.” Remote Sensing, Vol. 6 (No. 10): 10193–10214. doi:10.3390/rs61010193.
- Li, F., Miao, Y., Chen, X., Sun, Z., Stueve, K., and Yuan, F. 2022. “In-Season Prediction of Corn Grain Yield through PlanetScope and Sentinel-2 Images.” Agronomy, Vol. 12 ((No. 12):pp. 3176. doi:10.3390/agronomy12123176.
- Liu, J., Huffman, T., Qian, B., Shang, J., Li, Q., Dong, T., Davidson, A., and Jing, Q. 2020. “Crop yield estimation in the canadian prairies using terra/MODIS-derived crop metrics.” IEEE Journal of Selected Topics in Applied Earth Observations and Remote Sensing, Vol. 13: 2685–2697. doi:10.1109/JSTARS.2020.2984158.
- Liu, L., Dong, Y., Huang, W., Du, X., Ren, B., Huang, L., Zheng, Q., and Ma, H. 2020. “A disease index for efficiently detecting wheat fusarium head blight using sentinel-2 multispectral imagery.” IEEE Access., Vol. 8: 52181–52191. doi:10.1109/ACCESS.2020.2980310.
- Makaudze, E.M., and Miranda, M.J. 2010. “Catastrophic drought insurance based on the remotely sensed normalised difference vegetation index for smallholder farmers in Zimbabwe.” Agrekon, Vol. 49 (No. 4): 418–432. doi:10.1080/03031853.2010.52669.
- Marszalek, M., Körner, M., and Schmidhalter, U. 2022. “Prediction of multi-year winter wheat yields at the field level with satellite and climatological data.” Computers and Electronics in Agriculture, Vol. 194: 106777. doi:10.1016/j.compag.2022.106777.
- Masiza, W., Chirima, J.G., Hamandawana, H., Kalumba, A.M., and Magagula, H.B. 2022. “Do satellite data correlate with in situ rainfall and smallholder crop yields? Implications for crop insurance.” Sustainability, Vol. 14 (No. 3):pp. 1670. doi:10.3390/su14031670.
- Möllmann, J., Buchholz, M., Kölle, W., and Musshoff, O. 2020. “Do remotely-sensed vegetation health indices explain credit risk in agricultural microfinance?” World Development, Vol. 127 (No. 10): 104771. doi:10.1016/j.worlddev.2019.104771.
- Muskulus, M., and Verduyn-Lunel, S. 2011. “Wasserstein distances in the analysis of time series and dynamical systems.” Physica D: Nonlinear Phenomena, Vol. 240 (No. 1): 45–58. doi:10.1016/j.physd.2010.08.005.
- Nazir, A., Ullah, S., Saqib, Z.A., Abbas, A., Ali, A., Iqbal, M.S., Hussain, K., Shakir, M., Shah, M., and Butt, M.U. 2021. “Estimation and forecasting of rice yield using phenology-based algorithm and linear regression model on sentinel-II satellite data.” Agriculture, Vol. 11 (No. 10): 1026. doi:10.3390/agriculture11101026.
- Nguyen, L.H., Robinson, S., and Galpern, P. 2022. “Medium-resolution multispectral satellite imagery in precision agriculture: Mapping precision canola (Brassica Napus L.) yield using sentinel-2 time series.” Precision Agriculture, Vol. 23 (No. 3): 1051–1071. doi:10.1007/s11119-022-09874-7.
- Nguy-Robertson, A., Gitelson, A., Peng, Y., Viña, A., Arkebauer, T., and Rundquist, D. 2012. “Green leaf area index estimation in maize and soybean: Combining vegetation indices to achieve maximal sensitivity.” Agronomy Journal, Vol. 104 (No. 5): 1336–1347. doi:10.2134/agronj2012.0065.
- Pantaleoni, E., Engel, B.A., and Johannsen, C.J. 2007. “Identifying agricultural flood damage using landsat imagery.” Precision Agriculture, Vol. 8 (No. 1–2): 27–36. doi:10.1007/s11119-006-9026-5.
- Pejak, B., Lugonja, P., Antić, A., Panić, M., Pandžić, M., Alexakis, E., Mavrepis, P., Zhou, N., Marko, O., and Crnojević, V. 2022. “Soya yield prediction on a within-field scale using machine learning models trained on sentinel-2 and soil data.” Remote Sensing, Vol. 14 (No. 9): 2256. doi:10.3390/rs14092256.
- Potgieter, A.B., Zhao, Y., Zarco-Tejada, P.J., Chenu, K., Zhang, Y., Porker, K., Biddulph, B., et al. 2021. “Evolution and application of digital technologies to predict crop type and crop phenology in agriculture.” In Silico Plants, Vol. 3 (No. 1): diab017. doi:10.1093/insilicoplants/diab017.
- Prasad, G., Reddy Vuyyuru, U., and Gupta, M.D. 2019. “Agriculture commodity arrival prediction using remote sensing data: Insights and beyond.” arXiv. doi:https://doi.org/10.48550/arXiv.1906.07573.
- Prey, L., and Schmidhalter, U. 2019. “Temporal and spectral optimization of vegetation indices for estimating grain nitrogen uptake and late-seasonal nitrogen traits in wheat.” Sensors, Vol. 19 (No. 21): 4640. doi:10.3390/s19214640.
- Qader, S.H., Dash, J., and Atkinson, P.M. 2018. “Forecasting wheat and barley crop production in arid and semi-arid regions using remotely sensed primary productivity and crop phenology: A case study in Iraq.” The Science of the Total Environment, Vol. 613–614: 250–262. doi:10.1016/j.scitotenv.2017.09.057.
- Sakamoto, T. 2020. “Incorporating environmental variables into a MODIS-based crop yield estimation method for United states corn and soybeans through the use of a random forest regression algorithm.” ISPRS Journal of Photogrammetry and Remote Sensing, Vol. 160:208–228. doi:10.1016/j.isprsjprs.2019.12.012.
- Salmon, J.M., Friedl, M.A., Frolking, S., Wisser, D., and Douglas, E.M. 2015. “Global rain-fed, irrigated, and paddy croplands: A new high resolution map derived from remote sensing, crop inventories and climate data.” International Journal of Applied Earth Observation and Geoinformation, Vol. 38: 321–334. doi:10.1016/j.jag.2015.01.014.
- Satir, O., and Berberoglu, S. 2016. “Crop yield prediction under soil salinity using satellite derived vegetation indices.” Field Crops Research, Vol. 192: 134–143. doi:10.1016/j.fcr.2016.04.028.
- Segarra, J., Araus, J.L., and Kefauver, S.C. 2022. “Farming and earth observation: Sentinel-2 data to estimate within-field wheat grain yield.” International Journal of Applied Earth Observation and Geoinformation, Vol. 107: 102697. doi:10.1016/j.jag.2022.102697.
- Shi, D., Shi, Y., Wu, Q., and Fang, R. 2020. “Multidimensional assessment of food provisioning ecosystem services using remote sensing and agricultural statistics.” Remote Sensing, Vol. 12 (No. 23): 3955. doi:10.3390/rs12233955.
- Shirsath, P.B., Sehgal, V.K., and Aggarwal, P.K. 2020. “Downscaling regional crop yields to local scale using remote sensing.” Agriculture, Vol. 10 (No. 3): 58. doi:10.3390/agriculture10030058.
- Sishodia, R.P., Ray, R.L., and Singh, S.K. 2020. “Applications of remote sensing in precision agriculture: A review.” Remote Sensing, Vol. 12 (No. 19): 3136. doi:10.3390/rs12193136.
- Skakun, S., Vermote, E., Franch, B., Roger, J.-C., Kussul, N., Ju, J., and Masek, J. 2019. “Winter wheat yield assessment from landsat 8 and sentinel-2 data: Incorporating surface reflectance, through phenological fitting, into regression yield models.” Remote Sensing, Vol. 11 (No. 15): 1768. doi:10.3390/rs11151768.
- Soriano-González, J., Angelats, E., Martínez-Eixarch, M., and Alcaraz, C. 2022. “Monitoring rice crop and yield estimation with sentinel-2 data.” Field Crops Research, Vol. 281: 108507. doi:10.1016/j.fcr.2022.108507.
- Tadesse, M., Simane, B., Abera, W., Tamene, L., Ambaw, G., Recha, J.W., Mekonnen, K., Demeke, G., Nigussie, A., and Solomon, D. 2021. “The effect of climate-smart agriculture on soil fertility, crop yield, and soil carbon in southern ethiopia.” Sustainability, Vol. 13 (No. 8): 4515. doi:10.3390/su13084515.
- Turvey, C.G., and Mclaurin, M.K. 2012. “Applicability of the normalized difference vegetation index (NDVI) in index-based crop insurance design.” Weather, Climate, and Society, Vol. 4 (No. 4): 271–284. doi:10.1175/WCAS-D-11-00059.1.
- Ulfa, F., Orton, T.G., Dang, Y.P., and Menzies, N.W. 2022. “Developing and testing remote-sensing indices to represent within-field variation of wheat yields: Assessment of the variation explained by simple models.” Agronomy, Vol. 12 (No. 2): 384. doi:10.3390/agronomy12020384.
- Wall, L., Larocque, D., and Léger, P.‐M. 2008. “The early explanatory power of NDVI in crop yield modelling.” International Journal of Remote Sensing, Vol. 29 (No. 8): 2211–2225. doi:10.1080/01431160701395252.
- Weiss, M., Jacob, F., and Duveiller, G. 2020. “Remote sensing for agricultural applications: A meta-review.” Remote Sensing of Environment, Vol. 236: 111402. doi:10.1016/j.rse.2019.111402.
- Yang, C. 2020. “Remote sensing and precision agriculture technologies for crop disease detection and management with a practical application example.” Engineering, Vol. 6 (No. 5): 528–532. doi:10.1016/j.eng.2019.10.015.
- Zhao, Y., Potgieter, A.B., Zhang, M., Wu, B., and Hammer, G.L. 2020. “Predicting wheat yield at the field scale by combining high-resolution sentinel-2 satellite imagery and crop modelling.” Remote Sensing, Vol. 12 (No. 6): 1024. doi:10.3390/rs12061024.
- Zheng, Q., Huang, W., Cui, X., Shi, Y., and Liu, L. 2018. “New spectral index for detecting wheat yellow rust using sentinel-2 multispectral imagery.” Sensors, Vol. 18 (No. 3): 868. doi:10.3390/s18030868.
Appendix A
Figure A1. Accuracy of yearly yield predictions by the best performing multi-index and single-index models using Landsat data against MODIS single-index model for 2009–2019 for wheat, barley and canola. Yield anomaly (%) is the model residual relative to mean observed yield. A simple average of yield anomaly across all municipalities was calculated to derive an annual mean anomaly value.
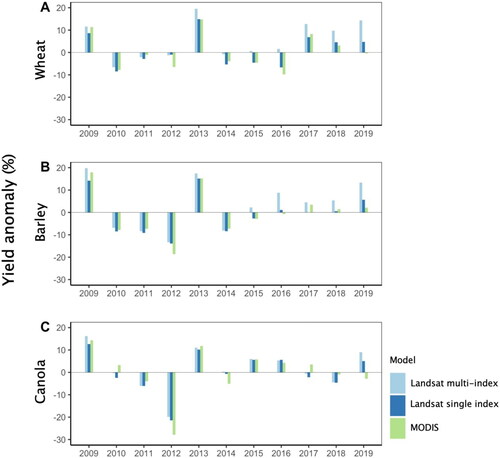
Figure A2. Accuracy of yearly yield predictions by the best performing multi-index and single-index models using Landsat and Sentinel-2 data against MODIS single-index model for 2016–2019 for wheat, barley and canola. Yield anomaly (%) is the model residual relative to mean observed yield. A simple average of yield anomaly across all municipalities was calculated to derive an annual mean anomaly value.
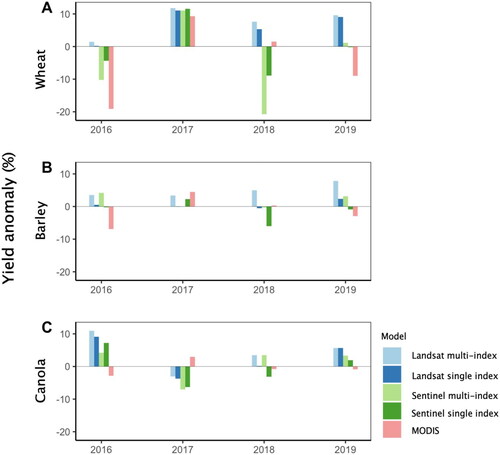
Figure A3. Correlations between different Landsat-based vegetation indices for wheat observed in July. Pairwise correlation coefficient and pairwise relationship between variables is shown in the upper triangle portion and lower triangle portion of the plot respectively. The curves on the diagonal show the density of respective variables where frequency count is reported along the y-axis and the variable value range is reported along the x-axis.
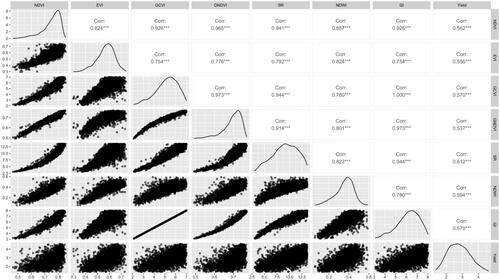
Figure A4. Correlations between different Landsat-based vegetation indices for barley observed in July. Pairwise correlation coefficient and pairwise relationship between variables is shown in the upper triangle portion and lower triangle portion of the plot respectively. The curves on the diagonal show the density of respective variables where frequency count is reported along the y-axis and the variable value range is reported along the x-axis.
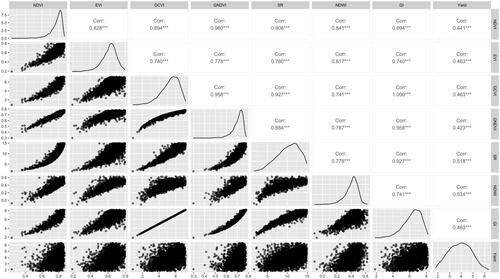
Figure A5. Correlations between different Landsat-based vegetation indices for canola observed in July. Pairwise correlation coefficient and pairwise relationship between variables is shown in the upper triangle portion and lower triangle portion of the plot respectively. The curves on the diagonal show the density of respective variables where frequency count is reported along the y-axis and the variable value range is reported along the x-axis.
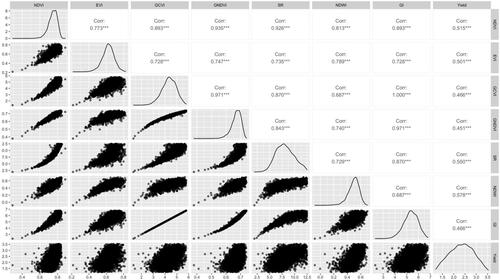
Figure A6. Yield estimation accuracy (RMSE) of single stage and multi-stage models using Sentinel-2 data for 2016-2019 for wheat, barley and canola. In the plots, x-axis show a week or combination of weeks using Sentinel-2 data. Single weeks are denoted by labels starting with ‘1’. The week number shown corresponds to a week in a calendar year.
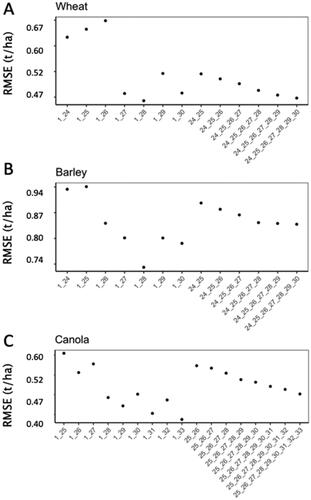
Figure A7. Spatial distribution of observed yield of wheat and estimation error of best-performing models using different satellite index predictors for 2009 and 2019. Landsat-NDWI is the best performing single-index. Best performing multi-index combination using Landsat data for wheat is EVI + SR + NDWI. Regions in white represent the absence of cropland within a given municipality. Regions in grey represent municipalities for which model-specific yield estimation error is unavailable.
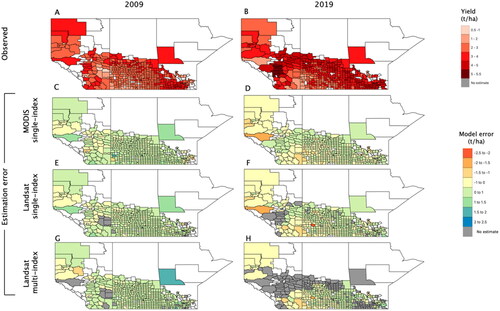
Figure A8. Spatial distribution of observed yield of barley and estimation error of best-performing models using different satellite index predictors for 2009 and 2019. Landsat-NDWI is the best performing single-index. Best performing multi-index combination using Landsat data for wheat is EVI + SR + GI. Regions in white represent the absence of cropland within a given municipality. Regions in grey represent municipalities for which model-specific yield estimation error is unavailable.
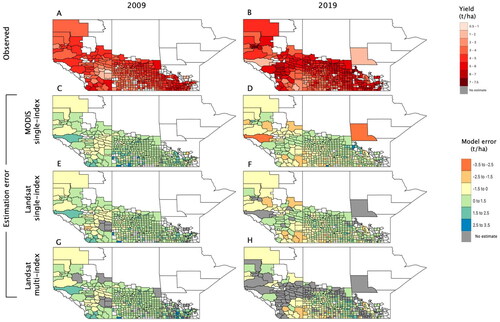
Figure A9. Spatial distribution of observed yield of canola and estimation error of best-performing models using different satellite index predictors for 2009 and 2019. Landsat-NDWI is the best performing single-index. Best performing multi-index combination using Landsat data for wheat is EVI + SR + NDWI. Regions in white represent the absence of cropland within a given municipality. Regions in grey represent municipalities for which model-specific yield estimation error is unavailable.
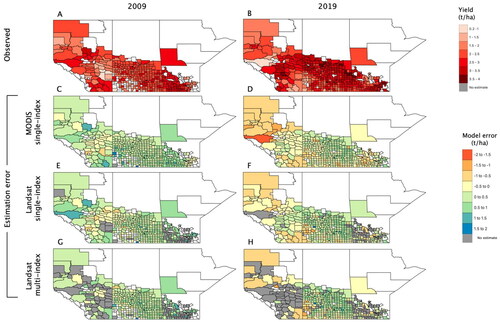
Table A1. Cross validation performance metrics for wheat of best performing multi-index models and single indices during the time period corresponding to Sentinel-2 data availability (2016–2019).
Table A2. Cross validation performance metrics for barley of best performing multi-index models and single indices during the time period corresponding to Sentinel-2 data availability (2016–2019).
Table A3. Cross validation performance metrics for canola of best performing multi-index models and single indices during the time period corresponding to Sentinel-2 data availability (2016–2019).
Table A4. AIC and AICc values of Landsat-based multi-index models for barley, canola, and wheat for 2009–2019 and 2016–2019. The best performing model is presented in bold.
Table A5. AICc values of Sentinel-2-based multi-index models for barley and wheat for 2016–2019. The best performing model is presented in bold.
Table A6. AICc values of Sentinel-2-based multi-index models for canola for 2016–2019. The best performing model is presented in bold.
Table A7. Sensor-specific multi-index combinations tested for modeling.