Abstract
Argo observations reveal that the salinity in the North Pacific subtropical gyre near Luzon Strait gradually declined by 0.2 (practical salinity scale used) from 2003 to 2007 over a depth range of 100 m to 200 m. Such freshening is also found in the outputs of the Estimating the Circulation and Climate of the Ocean (ECCO) model. The possible mechanisms for the freshening are investigated using the surface freshwater flux (E-P) data, the ECCO outputs and a salt budget equation for the upper ocean. Our analysis indicates that the magnitude of the salinity change caused by the surface freshwater flux anomaly is far smaller than observed, suggesting that the surface freshwater flux anomaly is not sufficient to account for the observed freshening. In fact, the salinity anomaly is closely linked to a pronounced freshening at the northeast corner of the study area from 2003 to 2007. The advection of salinity anomalies in the western North Pacific Ocean between 25°N and 35°N via a southwestward flow in the “C–shaped” region associated with the Kuroshio system is the main mechanism responsible for the observed freshening in the study area.
RÉSUMÉ [Traduit par la rédaction] Les observations Argo révèlent que la salinité dans le gyre subtropical du Pacifique Nord près du détroit de Luçon a graduellement diminué de 0,2 (en utilisant l’échelle de salinité pratique) entre 2003 et 2007 dans un intervalle de profondeur de 100 à 200 m. Un adoucissement comparable s'observe aussi dans les sorties du modèle ECCO (Estimating the Circulation and Climate of the Ocean). Nous examinons les mécanismes pouvant expliquer l'adoucissement au moyen des données de flux d'eau douce en surface (E–P), des sorties de l'ECCO et de l’équation du bilan du sel pour la couche supérieure de l'océan. Notre analyse indique que l'ampleur du changement de salinité causé par l'anomalie de flux d'eau douce en surface est beaucoup plus petite que ce qui est observé, ce qui suggère que l'anomalie de flux d'eau douce en surface ne suffit pas à expliquer l'adoucissement observé. En fait, l'anomalie de salinité est étroitement liée à un adoucissement prononcé dans le coin nord-est de la zone à l’étude de 2003 à 2007. L'advection des anomalies de salinité dans l'ouest du Pacifique Nord entre 25°N et 35°N par un écoulement vers le sud-ouest dans la région en forme de « C » associée au système du Kuroshio est le principal mécanisme responsable de l'adoucissement observé dans la zone à l’étude.
1 Introduction
The distribution of salinity in the world's oceans and its variability are essential for our understanding of ocean circulation and climate change. Salinity plays an important role in the thermohaline circulation and, thus, affects the distribution of mass and heat (Bryan, Citation1986; Delcroix & Hénin, Citation1991). In the tropical ocean, salinity stratification can control the formation and variability of barrier- and mixed-layer depths (Lukas & Lindstrom, Citation1991; Sprintall & Tomczak, Citation1992; Foltz & McPhaden, Citation2008). The formation of the barrier layer and changes in the mixed-layer depth can influence the ocean–atmosphere interaction by trapping heat energy in a shallow surface layer. As a result, a warm reservoir is formed, which is closely related to climate variability, for example, the buildup of El Niño-Southern Oscillation (ENSO) events (Maes et al., Citation2005), the onset of monsoons (Masson et al., Citation2005), and the evolution of tropical cyclones (Wang et al., Citation2011). In general, as one of the variables of state, salinity is key to the numerical simulation and forecasting of variability in the global and regional ocean and climate (Cooper, Citation1988).
In spite of the importance of salinity distribution and its variability in oceanographic and climate studies, salinity variability is poorly studied compared to temperature variability because of the sparse observations over the broad area of the oceans. Previous efforts to understand salinity variability mainly focused on sea surface salinity (SSS) in the tropical oceans (Delcroix & Hénin, Citation1991; Dessier & Donguy, Citation1994; Delcroix et al., Citation1996; Johnson et al., Citation2002). Recently, with the availability of an increased number of salinity observations, more studies have focused on the subsurface salinity budget and its variability (Lukas, Citation2001; Foltz et al., Citation2004; Phillips et al., Citation2005; Foltz & McPhaden, Citation2008; Ren & Riser, Citation2010; Sasaki et al., Citation2010; Kilpatrick et al., Citation2011). For example, Lukas (Citation2001) examined salinity observations near the Hawaii Ocean Time Series (HOT) station and reported that from 1988 to 2001 the main thermocline near the HOT station experienced a pronounced freshening, which is related to the subduction of surface salinity anomalies at higher latitudes. On the basis of the observations, Phillips et al. (Citation2005) mapped an average freshening to a depth of 180 m in the Australia–Indonesia region and suggested that the advection of freshwater from the Indonesian seas is the dominant forcing for this anomaly. Similar freshening signals have also been detected in recent studies based on several kinds of observational data, including the World Ocean Circulation Experiment (WOCE) hydrographic dataset, Argo profiling float data, and the Hydrobase climatology in the North Pacific Ocean (Ren & Riser, Citation2010; Sasaki et al., Citation2010).
These studies have enhanced our knowledge and understanding of salinity variability in the tropical ocean. Yet, because of the limited number of observations and the geographic location, questions remain about the salinity distribution and its variability on an interannual or longer time scale, especially in the tropical Northwest Pacific Ocean where subsurface processes are highly variable. Therefore, the main objective of this study is to examine the annual variability in the regional average subsurface salinity and the possible contributing mechanisms in the Northwest Pacific Ocean subtropical gyre using satellite data and Argo observations, as well as oceanic assimilation products. In this study, we focus on the area from 16°N to 25°N and 122°E to 130°E, where strong interannual fluctuations of the East Asian monsoon dominate (Lau et al., Citation2000). In addition, this area is very sensitive to water exchange between the marginal ocean basin (i.e., the South China Sea (SCS) and the open Pacific Ocean).
The remainder of the paper is divided into the following sections. The data and methodology are presented in Section 2. In Section 3, a pronounced freshening scenario for the study area, based on observations and oceanic assimilation products, is described, and the mechanisms potentially responsible for such anomalies are explored. Finally, our results are summarized in Section 4.
2 Data and methodology
a Data
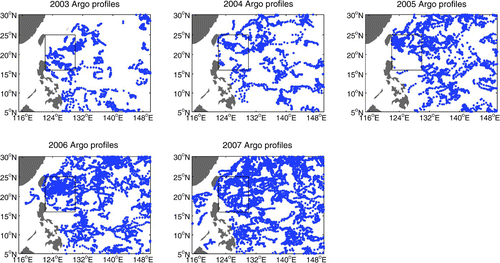
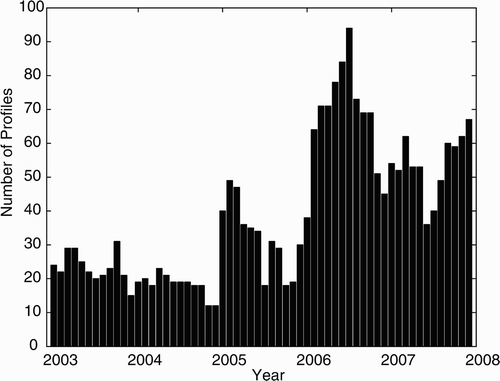
Argo collects salinity and temperature profiles from a sparse (approximately 3° × 3° spacing and 10-day interval) array of robotic floats in ice-free oceans. Each profile consists of 60–70 points in the vertical ranging from near the surface to 2000 m depth. The first Argo floats were deployed in 2000, but Argo float coverage of the North Pacific Ocean was not adequate for scientific studies until 2003. Salinity profiles for the period January 2003 to December 2007 from the China Argo Real–time Data Center were used in this study. This dataset has been carefully calibrated and has undergone quality control by the China Argo Data Center. During the period 2003–07, Argo collected 49,471 salinity observations in the tropical Pacific Ocean (100°E–180°E, 0°N–60°N; ). From this collection we have selected 2,340 observations within our study area (16°N–25°N, 122°E–130°E) to analyze the salinity variability. As shown in and , there are approximately 40 Argo salinity observations per month in the study area, with the maximum data coverage of Argo float profiles occurring in 2006–07 and the minimum data coverage occurring from 2003 to the end of 2004.
Fig. 1 Spatial distributions of Argo float temperature and salinity profiles in the Northwest Pacific Ocean during the period 2003–07: (a) JFM, (b) AMJ, (c) JAS, and (d) OND. Winter, indicated by JFM, is regarded as the three consecutive months of January, February and March, and so on. The rectangle is the study area (16°N–25°N, 122°E–130°E).
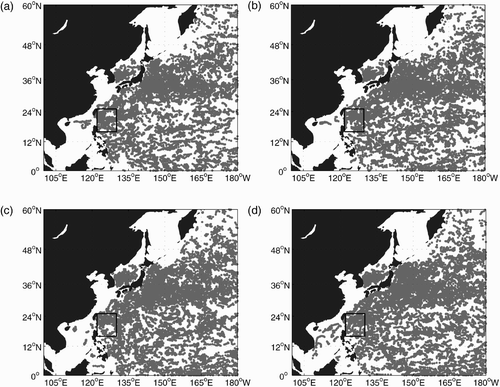
Fig. 2 Monthly accumulated number of Argo float profiles in the study region (16°N–25°N, 122°E–130°E) during the period 2003–07.
The Argo gridded temperature (T) and salinity (S) product (G-Argo) during the period 2000 to 2008, constructed by Wang et al. (Citation2010) with Argo float data, is used to investigate subsurface salinity variations. The G-Argo is a 3° × 3° gridded dataset of weekly temperature and salinity with 36 vertical levels: 0, 10, 20, 30, 50, 75, 100, 125, 150, 175, 200, 225, 250, 275, 300, 325, 350, 375, 400, 425, 450, 475, 500, 550, 600, 700, 800, 900, 1000, 1100, 1200, 1300, 1400, 1500, 1750 and 2000 m. The averaged root-mean-square errors for T and S in G-Argo datasets are approximately 0.2°C and 0.02 (practical salinity scale used), respectively. The datasets were downloaded from the China Argo Real-time Data Center and the details of the data processing, gridding, and error estimation of G-Argo are described by Wang et al. (Citation2010).
To examine the mechanisms potentially responsible for the salinity variations further, the assimilation products of the Estimating the Circulation and Climate of the Ocean (ECCO) project generated at the National Aeronautics and Space Administration (NASA) Jet Propulsion Laboratory (JPL) are also used (NASA/JPL, Citation2010). Briefly, the ECCO model is a near–global version of the Massachusetts Institute of Technology (MIT) ocean general circulation model (Marshall et al., Citation1997). This model was designed to study the seasonal-to-interannual variability of the ocean circulation. Using a Kalman filter, the model assimilates altimetric sea level anomalies (TOPEX/Poseidon and JASON-1), in situ temperature profiles (from expendable bathythermographs (XBTs), Argo and Tropical Atmosphere Ocean (TAO) data), Levitus climatological temperature and salinity, and surface fluxes from the National Centers for Environmental Prediction (NECP). The model has a telescoping latitudinal grid with 1/3° resolution in the tropics (20°S to 20°N); the model resolution gradually increases to 1° resolution away from the equator. The longitudinal resolution is 1°. There are 46 vertical levels with 10 m resolution in the upper 150 m and 21 layers above 300 m. The model is forced by NCEP reanalysis products (12-hourly wind stress, daily heat and freshwater fluxes) and time-means are replaced by those from the Comprehensive Ocean–Atmosphere Dataset. Surface temperature and salinity are relaxed toward the observed values. Model fields are available as 10-day averages. Additional descriptions of the model and detailed comparisons of the model outputs with various observational data, including temperature, salinity and velocity in the tropical Pacific and Indian oceans, are provided by Lee et al. (Citation2002). The ECCO–JPL products have been successfully applied to analyze the mixed-layer temperature and salinity budget in the tropical and mid-latitude Pacific Ocean (Kim et al., Citation2004, Citation2007; Halkides & Lee, Citation2009; Werf et al., Citation2009).
In addition, a suite of satellite measurements are used in this study. Surface winds are obtained from NASA's Quick Scatterometer (QuikSCAT). Monthly mean precipitation from the Tropical Rainfall Measuring Mission (TRMM) 3B43–V6 product (Huffman et al., Citation2007) and monthly mean evaporation derived from the latent heat component of the Objective Analysis Flux (OAFlux; Yu & Weller (Citation2007)) are also used.
b Methodology
To ensure an understanding of upper-layer salinity changes, it is helpful to briefly present and discuss the equation for a salinity budget. Paralleling the methodology of Delcroix and Hénin (Citation1991) and Ren Riser (Citation2009), the time evolution of mixed-layer salinity is governed by
The area of our study is defined by four boundaries. The southern, northern, western and eastern boundaries are θs = 15.5°N, θn = 25.5°N, λw = 121.5°E, and λe = 130.5°E, respectively. Integrating Eq. (1) over this area (A) leads to
Averaging Eq. (2) over the time period (2003–07) of our study leads to
3 Results
a The Observed Salinity Anomalies
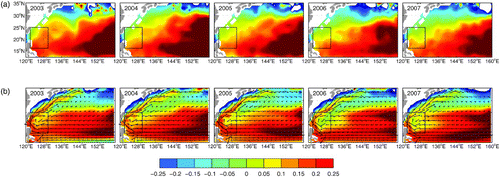
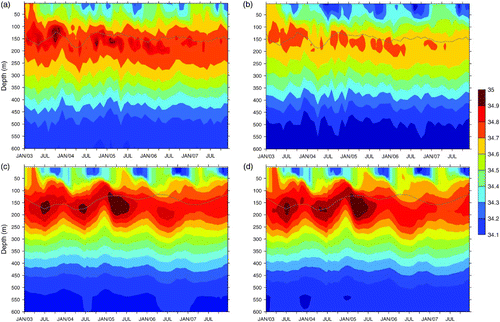
As discussed in the introduction, water in the study area is a mixture of different water masses that are formed elsewhere and reach the study area through different flow paths (Nitani, Citation1972; Wyrtki, Citation1975). The T-S diagram and annual mean T-S curves of the water masses from the Argo profiles during the period 2003–07 in the study area are shown in . The annual mean salinity in the upper ocean gradually decreases from 2003 to 2007. The maximum salinity change is found in the isopycnal layer of σθ = 23.8–24.0 kg m−3, and it has an amplitude of about 0.2. The salinity variation can be seen clearly from the time evolution of salinity profiles along 18°N (averaged over 122°E–130°E) and along 126°E (averaged over 16°N–25°N) from 2003 to 2007, as shown in ; the spatial distributions of salinity anomalies for the same period are shown in . Here, we focus on the isopycnal layer of σθ = 23.8–24.0 kg m−3, where the maximum salinity variability is found (). As shown in a and b, the salinity exhibits a significant annual variation in both the zonal transect (along 18°N) and the meridional transect (along 126°E). The maximum salinity anomalies are located at a depth range of 100–200 m, and the salinity decreases gradually from 2003 to 2007. Looking at the spatial distribution of salinity anomalies (), we see a pronounced freshening for the isopycnal layer σθ = 23.8–24.0 kg m−3, in the study area in both observations and model results, consistent with the results of Li et al. (Citation2012).
Fig. 4 Temperature-salinity (T-S) diagrams from the Argo float profiles in the study area from 2003 to 2007, superimposed on these are the annual mean T-S curves for the year 2003 (yellow solid line), 2004 (magenta solid line), 2005 (red solid line), 2006 (green dashed line) and 2007 (blue solid line).
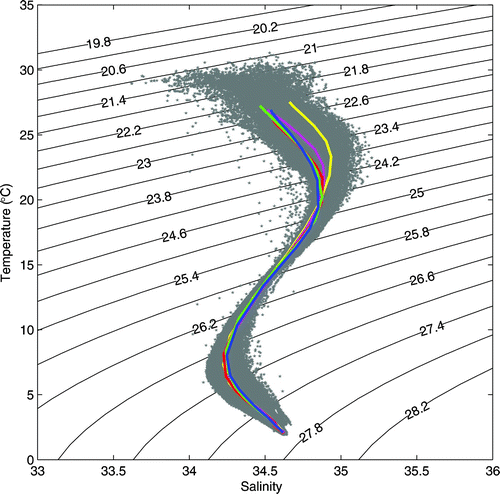
Fig. 5 Time evolution of salinity profiles (a) along 18°N from 122°E–130°E and (b) along 126°E from 16°N–25°N in the study area based on Argo observations from 2003 to 2007. (c) and (d): as in (a) and (b), but for ECCO outputs. The corresponding mean depth of σθ = 23.8–24.0 kg m−3 is depicted by the grey line.
b Possible Interpretations of the Freshening
What causes the near-surface freshening in the study area? As discussed above, salinity changes are closely related to several factors, including air–sea exchange of fresh water, horizontal advection, entrainment, vertical turbulent diffusion and horizontal eddy advection. Because entrainment, vertical turbulent diffusion and horizontal eddy advection (last term on the right-hand side of Eq. (4)) are not easy to quantify, they will be discussed only briefly in the paper.
1 Effect of the Surface Freshwater Flux on Freshening
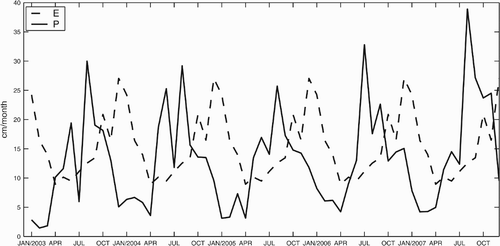
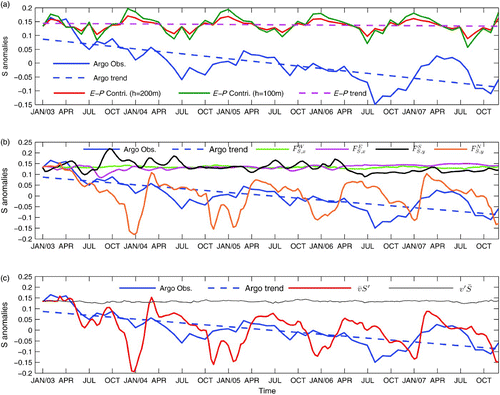
To determine the influence of the surface freshwater flux on freshening, the variability of the surface freshwater flux (evaporation minus precipitation, E-P) is examined first. The E-P averaged over three months is used as a gross indicator of the winter (DJF) and summer (JJA) surface freshwater budgets imprinted on the upper ocean for the years 2003, 2004 and 2007 (). The corresponding surface wind patterns, which are closely related to evaporation, are also shown in this figure. The E-P displays large spatial variations in both seasons. During the boreal winter, E-P is negative in a zonal belt ranging from 0°N–10°N, while the strongest northeasterly monsoon winds prevailing in this season drive maximum evaporation over the 10°N–35°N latitude band (a to 7c). In the boreal summer, the maximum precipitation shifts northward and evaporation weakens (d to 7f), leading to an excess of precipitation over evaporation (E–P < 0) for most of the western Pacific Ocean, except for a small area located southeast of Japan. The time evolution of area-averaged evaporation and precipitation over the study area is shown in . The spatially averaged precipitation and evaporation curves exhibit two major features. First, there is strong seasonal variability, with the maximum precipitation, on the order of 30 cm mo−1, occurring from July to October and the minimum precipitation occurring from January to April. Conversely, the maximum evaporation occurs during the strong wind period (January–April), when precipitation is at a minimum. Second, precipitation has a significant interannual variability, with the annual maximum decreasing in 2003–05 and increasing in 2005–07; precipitation exceeds evaporation after 2006. The excess of precipitation over evaporation seems to contribute to the salinity decrease in the study area.
Fig. 7 Three-month mean evaporation minus precipitation (cm yr−1, colour scale) and surface winds (arrows) for (left panels) 2003, (middle panels) 2004 and (right panels) 2007; upper panels are for December–February; lower panels are for June–August.
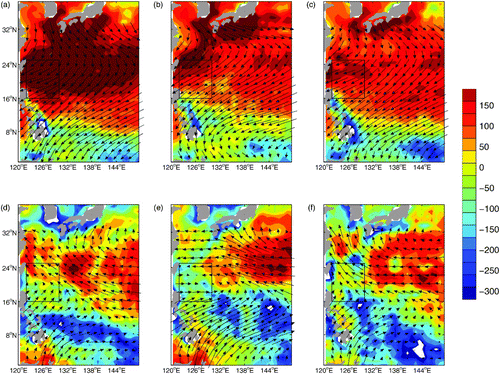
Fig. 8 Spatially averaged monthly mean precipitation and evaporation during the period 2003–07 in the study area (16°N–25°N, 122°E–130°E). The solid line denotes precipitation; the dashed line denotes evaporation. Both are in units of cm mo−1.
To estimate the contribution of the surface freshwater to the change in salinity in the upper ocean quantitatively, a one-dimensional model is used. Omitting the contribution of lateral salt advection and the residual term, Eq. (4) can be rewritten as
Fig. 9 Depth of the mixed layer in winter derived from Argo (dots) and ECCO (black lines) by the shallowest extreme curvature method (Lorbacher et al., Citation2006) for (a) 2003 and (b) 2007.
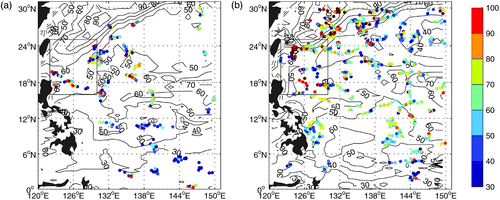
Fig. 10 (a) Salinity anomaly from Argo observations and model predictions (Eq. (5)) for the upper ocean in the study area from 2003 to 2007. The Argo observed salinity anomaly (averaged over 0–200 m in the study area (blue line) and its trend (derived using the linear least squares technique; blue dashed line); salinity change induced by the surface freshwater flux (E–P) based on the one-dimensional model (Eq. (5)) (red line for h = 200 m, green line for h = 100 m). The pink dashed line represents the trend in salinity change as a result of the surface freshwater flux (E–P), with h = 200 m. (b) Salinity anomaly from Argo observations and model prediction (Eq. (6)); the salinity anomaly from Argo observations and its trend are denoted by the blue and blue dashed lines, respectively; ,
,
, and
are the contributions from the salt flux through the western, eastern, southern and northern boundaries, respectively. (c) Salinity anomaly from Argo observations (blue line) and the meridional salinity flux along the southern and northern boundaries (
and
), which are denoted by the red and black lines, respectively.
2 Effect of Horizontal Advection on Freshening
Previous studies have suggested that contributions by salt advection from the oceanic flow are vital in the interannual and seasonal salinity anomalies in the upper ocean. For instance, Firing et al. (Citation1983) suggested that observed reversals of the South Equatorial Current (SEC) may have contributed to the decrease in near-equatorial surface salinity in 1982–83. Delcroix and Hénin (Citation1989) showed that the combined effect of mixing and advection on the surface salinity changes in the South Pacific Convergence Zone is the same order of magnitude as the effect of reduced rainfall. Foltz and McPhaden (Citation2008) revealed that freshening caused by meridional advection can balance the excess of evaporation over precipitation, resulting in a very weak seasonal cycle of mixed-layer salinity in the north-central basin of the Atlantic Ocean. Werf et al. (Citation2009) suggested that the strength of the SEC is a major regulator of the salinity anomaly found in the observations. Therefore, we will focus on the contribution of horizontal advection to salinity change in the remainder of this study.
We begin by estimating flow field, of which there are two common approaches to this. First, surface drifters and ship drifts, together with satellite-based sea level, wind stress, and temperature and salinity profiles, can be used to estimate the currents (Delcroix & Hénin, Citation1991; Grodsky & Carton, Citation2001; Johnson, Citation2001). Second, satellite sea level, wind stress and sea surface temperature, together with a dynamical model, can be used to calculate currents (Bonjean & Lagerloef, Citation2002). The advantage of the second approach is that it can provide more complete spatial and temporal coverage than that obtained from the ship drift and drifter method; however, the disadvantage is that it cannot use observations to constrain the flow field. The ECCO product has been successfully used to reproduce the circulation and thermohaline structure in the tropical ocean (Lee et al., Citation2002; Kim et al., Citation2004, Citation2007; Halkides & Lee, Citation2009; Werf et al., Citation2009). In light of its more complete spatial and temporal coverage, the assimilation output of ECCO is chosen here to estimate the horizontal advection of salinity in the study area.
Before analyzing the possible contributions of horizontal advection to the salinity variations, it is necessary to examine whether the ECCO outputs can reproduce the freshening scenario during the 2003–07 period in the study area, although previous studies (Lee et al., Citation2002; Kim et al., Citation2004, Citation2007; Halkides & Lee, Citation2009) have shown detailed assessments of ECCO data in terms of thermohaline structure and upper ocean circulation in the tropical ocean. As shown in c and d, the time evolution of salinity obtained from ECCO shows patterns similar to those of the observations in both the 18°N and 126°E sections. The maximum salinity anomalies are also found in the layers around 150 m, although the magnitude is slightly larger than that of the Argo observations (a and b). This discrepancy may be partly a result of the time and spatial smoothing of the observed salinity. Compared to the spatial distributions in a, the spatial distributions of salinity in layer σθ = 23.8–24.0 kg m−3 from ECCO (b) are also in good agreement. These results suggest that the outputs of ECCO can reasonably reproduce the salinity variability in the study area.
The contribution of horizontal salt advection to the salinity anomaly can be estimated as follows. Omitting the E-P term and the residual term in Eq. (4), and integrating with respect to time leads to
The results based on the outputs of ECCO are shown in b and c. The salt flux across the northern boundary (red line) is the dominant term of all four flux terms; salt flux through the southern boundary is secondary, and salt flux through the western and eastern boundaries is quite small. These results are consistent with the results shown in and , suggesting that the salinity anomalies in the study area are primarily influenced by the advection of salinity anomalies in the western North Pacific Ocean between 25°N and 35°N via a southwestward flow on the northern boundary. The combined contribution of horizontal salt advection predicts a salinity decline of 0.28 over the period 2003–07, which is the same order of magnitude as the mixed-layer salinity change in the tropical Pacific Ocean induced by meridional salt advections, as inferred from observations (Delcroix & Hénin, Citation1991). This is also consistent with the findings of Delcroix et al. (Citation1996), who showed that the potential contribution of the seasonal advection of mixed-layer salinity by the north equatorial countercurrent is about 0.25.
On the other hand, looking at both a and b shows that although E-P does not seem to contribute to the freshening trend in the upper ocean, it does contribute to the seasonal cycle of the salinity anomaly in the upper ocean. This can be clearly seen from the seasonal time-scale correlation between E-P and the salinity anomaly inferred from Argo.
4 Discussion and summary
This study has focused on the salinity anomaly in the Northwest Pacific Ocean subtropical gyre near Luzon Strait and its possible mechanisms. Our analysis is based on Argo observations and numerical model outputs. Observations indicate that from 2003 to 2007 the annual mean salinity in the upper ocean gradually declined by 0.2 in the study area. Our further analysis shows that the surface freshwater flux anomaly is not sufficient to account for the observed freshening. In fact, the observed freshening in the study area is primarily a result of the advection of salinity anomalies in the western North Pacific Ocean between 25°N and 35°N via a southwestward flow parallel to the Kuroshio in the “C-shaped” region (Wyrtki, Citation1975; Reid, Citation1997; Talley et al., Citation2011).
However, an accurate estimate of evaporation from observations is not available at the present time, although the precipitation anomalies are well represented in the TRMM. Also, the paucity of precise open-ocean salinity measurements, the lack of velocity data and the multiple processes involved in the salinity variability make it difficult for us to give an accurate estimate of the salinity change. The variations in mixed-layer depth and barrier-layer thickness in the upper ocean are closely related to climate variability (Lukas, Citation1990; Sato et al., Citation2004); therefore, it is important to understand salinity variability in the Northwest Pacific subtropical gyre and the possible mechanisms for the anomaly. In addition, the quantification of the impact of salinity anomalies in the eastern subtropical North Pacific Ocean on salinity variability in the North Pacific subtropical gyre near Luzon Strait is also an area of interest (Sasaki et al., Citation2010; Li et al., Citation2012). Our results suggest that freshening of the study area has no significant connection with the spiciness anomaly in the eastern subtropical North Pacific Ocean at 120°W–150°W through the northward North Equatorial Current, consistent with previous results (Schneider et al., Citation1999; Yeager & Large, Citation2004; Sasaki et al., Citation2010; Li et al., Citation2012).
It is known that salinity anomalies are predominantly controlled by changes in the air–sea freshwater flux (evaporation and precipitation) and salinity advection when the mixing term is neglected. According to Stommel (Citation1965), the horizontal advection term can be broken into two parts: the Ekman wind drift component (Ve) and the geostrophic component (Vg). The variations of meridional Ekman salt transport would reinforce the precipitation effect on the salinity variations (Delcroix & Hénin, Citation1991), which in turn would affect the geostrophic flow variability in their respective regions (Kessler & Taft, Citation1987; Cronin & McPhaden, Citation1998). Therefore, when we consider the potential role of salinity in the dynamics and thermodynamics of the western Pacific warm pool, detailed studies of salinity variation related to each term are needed. In the near future, more numerous measurements in the upper ocean could greatly improve our knowledge of variability in the tropical ocean.
Acknowledgements
We thank the JPL ECCO team for providing the Kalman filter assimilation product. Dr. Rui Xin Huang from Woods Hole Oceanographic Institution (WHOI) has provided much help in editing the dynamics and presentation. This work is partly supported by the National Basic Research Program of China (2007CB816003; 2011CB403504), the National Natural Science Foundation of China (40706009) and the R&D Special Fund for Public Welfare Industry (Meteorology) (GYHY201106036).
References
- Bonjean , F. and Lagerloef , G. S. E. 2002 . Diagnostic model and analysis of the surface currents in the tropical Pacific Ocean . Journal of Physical Oceanography , 32 : 2938 – 2954 . (doi:10.1175/1520-0485(2002)032<2938:DMAAOT>2.0.CO;2)
- Bryan , F. 1986 . High-latitude salinity effects and interhemispheric thermohaline circulation . Nature , 323 : 301 – 304 . (doi:10.1038/323301a0)
- Cooper , N. S. 1988 . The effect of salinity on tropical ocean models . Journal of Physical Oceanography , 18 : 697 – 707 . (doi:10.1175/1520-0485(1988)018<0697:TEOSOT>2.0.CO;2)
- Cronin , M. F. and McPhaden , M. J. 1998 . Upper ocean salinity balance in the western equatorial Pacific . Journal of Geophysical Research , 103 ( C12 ) : 27567 – 27587 . (doi:10.1029/98JC02605)
- Delcroix , T. and Hénin , C. 1989 . Mechanisms of subsurface thermal structure and sea surface thermohaline variabilities in the southwestern tropical Pacific during 1979–85 . Journal of Marine Research , 47 : 777 – 812 . (doi:10.1357/002224089785076046)
- Delcroix , T. and Hénin , C. 1991 . Seasonal and interannual variations of sea surface salinity in the tropical Pacific Ocean . Journal of Geophysical Research , 96 ( C12 ) : 22135 – 22150 . (doi:10.1029/91JC02124)
- Delcroix , T. , Hénin , C. , Porte , V. and Arkin , P. 1996 . Precipitation and sea surface salinity in the tropical Pacific Ocean . Deep Sea Research, Part I , 43 ( 7 ) : 1123 – 1141 . (doi:10.1016/0967-0637(96)00048-9)
- Dessier , A. and Donguy , J. R. 1994 . The sea surface salinity in the tropical Atlantic between 10°S and 30°N—seasonal and interannual variations (1977–1989) . Deep Sea Research, Part I , 41 ( 1 ) : 81 – 100 . (doi:10.1016/0967-0637(94)90027-2)
- Firing , E. , Lukas , R. , Sadler , J. and Wyrtki , K. 1983 . Equatorial undercurrent disappears during 1982–1983 EI Niño . Science , 222 ( 4628 ) : 1121 – 1123 . (doi:10.1126/science.222.4628.1121)
- Foltz , G. R. , Grodsky , S. A. , Carton , J. A. and McPhaden , M. J. 2004 . Seasonal salt budget of the northwestern tropical Atlantic Ocean along 38°W . J. Geophysical Research , 109 : C03052 doi:10.1029/2003JC002111
- Foltz , G. R. and McPhaden , M. J. 2008 . Seasonal mixed layer salinity balance of the tropical North Atlantic Ocean . Journal of Geophysical Research , 113 : C02013 doi:10.1029/2007JC004178
- Grodsky and Carton . 2001 . Intense surface currents in the tropical Pacific during 1996–1998 . Journal of Geophysical Research , 106 : 16673 – 16684 . (doi:10.1029/2000JC000481)
- Halkides , D. J. and Lee , T. 2009 . Mechanisms controlling seasonal-to-interannual mixed layer temperature variability in the southeastern tropical Indian Ocean . Journal of Geophysical Research , 114 : C02012 doi:10.1029/2008 JC004949
- Huffman , G. J. , Adler , R. F. , Bolvin , D. T. , Gu , G. , Nelkin , E. J. , Bowman , K. P. , Hong , Y. , Stocker , E. F. and Wolff , D. B. 2007 . The TRMM multi-satellite precipitation analysis: quasi-global, multi-year, combined-sensor precipitation estimates at fine scale . Journal of Hydrometeorology , 8 ( 1 ) : 38 – 55 . (doi:10.1175/JHM560.1)
- Johnson , E. S. , Lagerloef , G. S. E. , Gunn , J. T. and Bonjean , F. 2002 . Surface salinity advection in the tropical oceans compared with atmospheric freshwater forcing: A trial balance . Journal of Geophysical Research , 107 ( C12 ) : 8014 doi:10.1029/2001JC001122
- Johnson , G. C. 2001 . The Pacific Ocean subtropical cell surface limb . Geophysical Research Letters , 28 ( 9 ) : 1771 – 1774 . (doi:10.1029/2000GL012723)
- Kessler , W. S. and Taft , B. A. 1987 . Dynamic heights and zonal geostrophic transports in the central tropical Pacific during 1979–84 . Journal of Physical Oceanography , 17 : 97 – 122 . (doi:10.1175/1520-0485(1987)017<0097:DHAZGT>2.0.CO;2)
- Kilpatrick , T. , Schneider , N. and Di Lorenzo , E. 2011 . Generation of low-frequency spiciness variability in the thermocline . Journal of Physical Oceanography , 41 ( 2 ) : 365 – 377 . (doi:10.1175/2010JPO4443.1)
- Kim , S. B. , Lee , T. and Fukumori , I. 2004 . The 1997–1999 abrupt change of the upper ocean temperature in the north central Pacific . Geophysical Research Letters , 31 : L22304 doi:10.1029/2004GL021142
- Kim , S. B. , Lee , T. and Fukumori , I. 2007 . Mechanisms controlling the interannual variation of mixed layer temperature averaged over the Niño-3 region . Journal of Climate , 20 : 3822 – 3843 . (doi:10.1175/JCLI4206.1)
- Lau , K. M. , Ding , Y. H. , Wang , J. T. , Johnson , R. , Keenan , T. , Cifelli , R. , Gerlach , J. , Phiele , O. , Rickenbach , P. , Tsay , S. C. and Lin , P. H. 2000 . A report of the field operation and early results of the South China Sea monsoon experiment (SCSMEX) . Bulletin of the American Meteorological Society , 81 : 1261 – 1270 . (doi:10.1175/1520-0477(2000)081<1261:AROTFO>2.3.CO;2)
- Lee , T. , Fukumori , I. , Menemenlis , D. and Fu , L. L. 2002 . Effects of the Indonesian throughflow on the Pacific and Indian Oceans . Journal of Physical Oceanography , 32 : 1404 – 1429 . (doi:10.1175/1520-0485(2002)032<1404:EOTITO>2.0.CO;2)
- Li , Y. , Wang , F. and Zhai , F. 2012 . Interannual variations of subsurface spiciness in the Philippine Sea: Observations and mechanism . Journal of Physical Oceanography , 42 : 1022 – 1038 . (doi:10.1175/JPO-D-12-06.1)
- Lorbacher , K. , Dommenget , D. , Niiler , P. P. and Köhl , A. 2006 . Ocean mixed layer depth: A subsurface proxy of ocean atmosphere variability . Journal of Geophysical Research , 111 : C07010 doi:10.1029/2003JC002157
- Lukas, R. (1990). The role of salinity in the dynamics and thermodynamics of the western Pacific warm pool. Proc. Int. TOGA Scientific Conf., Honolulu, HI, World Meteorological Association, 73–113.
- Lukas , R. 2001 . Freshening of the upper thermocline in the North Pacific subtropical gyre associated with decadal changes of rainfall . Geophysical Research Letters , 28 : 3485 – 3488 . (doi:10.1029/2001GL013116)
- Lukas , R. and Lindstrom , E. 1991 . The mixed layer of the western equatorial Pacific Ocean . Journal of Geophysical Research , 96 : 3343 – 3357 . (doi:10.1029/91JC00062)
- Maes , C. , Picaut , J. and Belamari , S. 2005 . Importance of salinity barrier layer for the buildup of El Niño . Journal of Climate , 18 : 104 – 118 . (doi:10.1175/JCLI-3214.1)
- Marshall , J. , Adcroft , A. , Hill , C. , Perelman , L. and Heisey , C. 1997 . A finite-volume, incompressible Navier Stokes model for studies of the ocean on parallel computers . Journal of Geophysical Research , 102 ( C3 ) : 5753 – 5766 . doi:10.1029/96JC02775
- Masson , S. , Luo , J. J. , Madec , G. , Vialard , J. , Durand , F. , Gualdi , S. , Guilyardi , E. , Behera , S. , Delecluse , P. , Navarra , A. and Yamagata , T. 2005 . Impact of barrier layer on winter-spring variability of the southeastern Arabian Sea . Geophysical Research Letters , 32 : L07703 doi:10.1029/2004GL021980
- NASA/JPL (National Aeronautics and Space Administration/Jet Propulsion Laboratory). (2010). Estimating the circulation and climate of the ocean: Products [Data]. Retrieved from http://ecco.jpl.nasa.gov/las/servlets/dataset
- Nitani , H. 1972 . “ Beginning of the Kuroshio ” . In Kuroshio: Its physical Aspects , Edited by: Stommel , H. and Yoshida , K. 129 – 163 . Tokyo : University of Tokyo Press .
- Phillips , H. E. , Wijffels , S. E. and Feng , M. 2005 . Interannual variability in the freshwater content of the Indonesian-Australian Basin . Geophysical Research Letters , 32 : L03603 doi:10.1029/2004GL021755
- Reid , J. L. 1997 . On the total geostrophic circulation of the Pacific Ocean: Flow patterns, tracers, and transports . Progress in Oceanography , 39 : 263 – 352 . (doi:10.1016/S0079-6611(97)00012-8)
- Ren , L. and Riser , S. C. 2009 . Seasonal salt budget in the northeast Pacific Ocean . Journal of Geophysical Research , 114 : C12004 doi:10.1029/2009JC005307
- Ren , L. and Riser , S. C. 2010 . Observations of decadal time scale salinity changes in the subtropical thermocline of the North Pacific Ocean . Deep Sea Research, Part II , 57 ( 13–14 ) : 1161 – 1170 . (doi:10.1016/j.dsr2.2009.12.005)
- Sasaki , Y. N. , Schneider , N. , Maximenko , N. and Lebedev , K. 2010 . Observational evidence for propagation of decadal spiciness anomalies in the North Pacific . Geophysical Research Letters , 37 ( 7 ) doi:10.1029/2010GL042716
- Sato , K. , Suga , T. and Hanawa , K. 2004 . Barrier layer in the North Pacific subtropical gyre . Geophysical Research Letters , 31 : L05301 doi:10.1029/2003GL018590
- Schneider , N. , Miller , A. J. , Alexander , M. A. and Deser , C. 1999 . Subduction of decadal North Pacific temperature anomalies: Observations and dynamics . Journal of Physical Oceanography , 29 : 1056 – 1070 . (doi:10.1175/1520-0485(1999)029<1056:SODNPT>2.0.CO;2)
- Sprintall , J. and Tomczak , M. 1992 . Evidence of the barrier layer in the surface layer of the tropics . Journal of Geophysical Research , 97 : 7305 – 7316 . (doi:10.1029/92JC00407)
- Stommel , H. 1965 . The Gulf Stream, A physical and dynamical description , Berkeley : University of California Press .
- Talley , L. D. , Pickard , G. L. , Emery , W. J. and Swift , J. H. 2011 . Descriptive physical oceanography: An introduction , 6 303 – 308 .
- Wang, H., Wang, G., Zhang, R., & Chen, D. (2010). User's manual of Argo gridded salinity product (G-Argo). Retrieved from ftp://ftp.argo.org.cn/pub/ARGO/G-argo/gridded/
- Wang , X. D. , Han , G. J. , Qi , Y. Q. and Li , W. 2011 . Impact of barrier layer on typhoon-induced sea surface cooling . Dynamics of Atmospheres and Oceans , 52 ( 3 ) : 367 – 385 . (doi:10.1016/j.dynatmoce.2011.05.002)
- Werf , P. M. V.d. , Schouten , M. W. , Leeuwen , P. J. V. , Ridderinkhof , H. and de Ruijter , W. P. M. 2009 . Observation and origin of an interannual salinity anomaly in the Mozambique Channel . Journal of Geophysical Research , 114 C03017, 1–11
- Wyrtki , K. 1975 . Fluctuations of the dynamic topography in the Pacific Ocean . Journal of Physical Oceanography , 5 : 450 – 459 . (doi:10.1175/1520-0485(1975)005<0450:FOTDTI>2.0.CO;2)
- Yeager , S. G. and Large , W. G. 2004 . Late-winter generation of spiciness on subducted isopycnals . Journal of Physical Oceanography , 34 : 1528 – 1547 . (doi:10.1175/1520-0485(2004)034<1528:LGOSOS>2.0.CO;2)
- Yu , L. S. and Weller , R. A. 2007 . Objectively analyzed air-sea heat fluxes for the global ice-free ocean (1981–2005) . Bulletin of the American Meteorological Society , 88 ( 4 ) : 527 – 539 . (doi:10.1175/BAMS-88-4-527)
