
Abstract
The dependence of ozone formation on the mixing ratios of volatile organic compounds (VOCs) and nitrogen oxides (NOx) has been widely studied. In addition to the atmospheric levels of VOCs and NOx, the extent of photochemical processing of VOCs has a strong impact on ozone levels. Although methods for measuring atmospheric mixing ratios of VOCs and NOx are well established and results of those measurements are widely available, determination of the extent of photochemical processing of VOCs, known as photochemical age (PCA), is difficult. In this article a recently developed methodology for the determination of PCA for individual compounds based on the change in their stable carbon isotope composition is used to investigate the dependence between ozone and VOC or NOx mixing ratios at a rural site in Ontario, Canada, during fall and winter. The results show that under these conditions the variability in VOC mixing ratios is predominantly a result of the varying impact of local emissions and not a result of changes in the extent of atmospheric processing. This explains why the mixing ratio of ozone shows no systematic dependence on the mixing ratios of VOCs or NOx in this environment and at this time of the year.
Résumé
[Traduit par la rédaction] La dépendance de la formation de l'ozone à l’égard des rapports de mélange des composés organiques volatiles (COV) et des oxydes d'azote (NOx) a fait l'objet de nombreuses études. En plus des concentrations atmosphériques de COV et de NOx, le degré d'avancement du traitement photochimique des COV a un effet marqué sur les concentrations d'ozone. Même si les méthodes de mesure des rapports de mélange atmosphérique des COV et des NOx sont bien établies et que les résultats de ces mesures sont facilement disponibles, il reste difficile de déterminer le degré d'avancement du traitement photochimique des COV, que l'on nomme « âge photochimique ». Dans cet article, nous employons une méthodologie récemment mise au point pour la détermination de l’âge photochimique de différents composés, basée sur le changement dans la composition de leurs isotopes stables du carbone, pour étudier la dépendance de l'ozone à l’égard des rapports de mélange des COV ou des NOx à un site rural en Ontario, au Canada, durant l'automne et l'hiver. Les résultats montrent que dans ces conditions la variabilité dans les rapports de mélange des COV est principalement attribuable à l'effet variable des émissions locales et non à des changements dans le degré d'avancement du traitement atmosphérique. Cela explique pourquoi le rapport de mélange de l'ozone n'affiche pas de dépendance systématique à l’égard des rapports de mélange des COV ou des NOx dans cet environnement et à ce moment de l'année.
1 Introduction
Volatile organic compounds (VOCs) are, together with nitrogen oxides (NOx), the key precursors of tropospheric ozone formation (Atkinson, Citation2000; Atkinson & Arey, Citation2003; Sillman, Citation1999). A simplified description of ozone formation from oxidation of VOCs is described by the following condensed reaction sequence:
(R1)
(R2)
(R3)
Depending on its structure the RO radical can undergo different complex reaction sequences resulting in the formation of a wide range of different substances such as peroxy radicals, carbonyls, peroxides, organic nitrates (Bloss et al., Citation2005; Saunders, Jenkin, Derwent, & Pilling, Citation2003).
Because Eq. (R1) is usually the rate limiting step, the O3 production rate is
(1)
where ikOH is the rate constant for the reaction of VOCi with OH, [OH] and [VOC] are the concentrations of OH and the VOC, respectively, and iy is the number of ozone molecules formed for each molecule of VOCi oxidized. This yield depends on the chemical composition of the air studied, with NOx typically playing a key role. Overall, the ozone production rate depends on a large number of factors such as VOC, NOx, ozone, and OH radical concentrations, photolysis rates of NO2 and ozone, as well as the structure and reactivity of the VOC. Moreover, because ozone is a precursor for the formation of OH radicals, this complex reaction system includes significant feedback. This complex behaviour has been studied in numerous laboratory experiments as well as numerical model simulations and field studies (Atkinson, Citation2000; Atkinson & Arey, Citation2003; Chameides et al., Citation1992; Sillman, Citation1999). In spite of this complex behaviour, it can be expected that photochemical VOC processing should be one of the factors that strongly influences tropospheric ozone mixing ratios because the ozone mixing ratio will depend on the VOC oxidation rate Eq. (1) integrated over time.
There are several approaches that allow estimates of the extent of photochemical processing of VOCs, often referred to as photochemical age (PCA). Most of them are based on the change in ratios of precursor mixing ratios or ratios of precursor mixing ratios to reaction product mixing ratios (known as the hydrocarbon clock) (Gelencsér, Siszler, & Hlavay, Citation1997; Kleinman et al., Citation2003; Parrish et al., Citation1992; Simpson et al., Citation2003). Recently a methodology was proposed that allows the determination of the extent of photochemical processing for individual VOCs from changes in their stable carbon isotope composition (isotope hydrocarbon clock) (Rudolph & Czuba, Citation2000; Rudolph, Czuba, Norman, Huang, & Ernst, Citation2002).
The stable carbon isotope ratio is defined as the ratio of the number of 13C atoms to that of 12C (13C/12C):
(2)
This ratio is given relative to a reference point—a standard with known isotope composition; for carbon it is Vienna Peedee Belemnite (V-PDB) with R = 0.0112372 (Craig, Citation1953). Because deviations in 13C/12C are very small but measured to four significant digits, the isotope ratios are typically expressed in delta notation (δ13C) as parts per thousand (‰).
In atmospheric processes reaction rate coefficients of isotopologues (compounds with different isotopes for one or more of the atoms) are slightly different because of the differences in their zero point energies (Kaye, Citation1987). The kinetic isotope effect (KIE) is defined as the ratio of the rate constants for the 12C only isotopologue to the rate constant for 13C containing isotopologues. The ratio is usually close to one; therefore, the KIE is often presented as the relative difference between the rate constants in epsilon notation (ϵ) in parts per thousand (‰):
(3)
For VOCs which are predominantly removed from the atmosphere by reaction with OH radicals, the PCA is the time-integrated exposure to OH radicals. In the conventional hydrocarbon clock approach, the PCA is determined based on one or more pairs of VOCs, for example:
(4)
where r and s refer to mixing ratios at the receptor and source locations, respectively; k1 and k2 are the rate constants for reactions of the two VOCs with the OH radical (Gelencsér et al., Citation1997). For the isotope hydrocarbon clock, a pair of isotopologues is used instead:
(5)
For very small changes, such as those typical for isotope fractionation, valid linear approximations can be used to simplify Eq. (5) (Rudolph & Czuba, Citation2000). Using delta and epsilon notations (δ and ϵ; Eqs (2) and (3)) the isotopic composition of an ambient VOC can be expressed as
(6)
where
and
are the stable carbon isotope compositions of a VOC at the source and receptor locations, respectively; kOH is the reaction rate coefficient (VOC + OH); ϵOH is the KIE for this reaction, and [OH]t is the average PCA of the VOC studied.
One of the fundamental advantages of PCAs derived from isotope ratios is the very small difference in VOC loss rates between the two isotopologues. For all practical purposes, this results in identical atmospheric residence times of the isotopologues, therefore, an identical footprint area (Rudolph & Czuba, Citation2000). Furthermore it has also been shown by Rudolph and Czuba (Citation2000) that, in the case of mixing of air masses with different photochemical histories, the PCA derived from VOC isotope ratios represents, for all practical purposes, the average PCA of the VOC studied. A practical advantage is the finding that VOC emissions from the most important atmospheric sources have very similar carbon isotope ratios (Rudolph, Citation2007), which eliminates most of the uncertainties resulting from errors in emission ratios.
2 Method
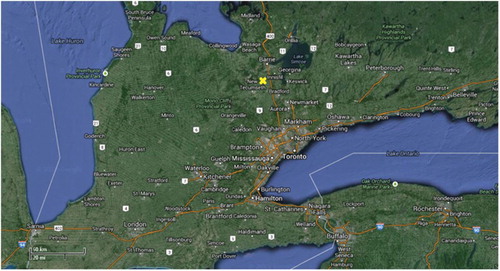
Ambient samples were collected at a rural location in southern Ontario (Egbert, 44°12′N, 79°48′W, elevation 251 m) on the premises of the Centre for Atmospheric Research Experiments (CARE) of Environment Canada. The centre is mainly surrounded by agricultural fields and some forested regions and is located 8 km to the west of a major transportation artery (Highway 400), 23 km southwest of Barrie and 85 km north of Toronto (). Samples averaged over 24 h were collected daily from 19 October 2009 to 25 January 2010.
Fig. 1 Surroundings of the CARE sampling site (x) Google maps. Imagery@2013 TerraMetrics, Map data @ 2013 Google (June, 2013).
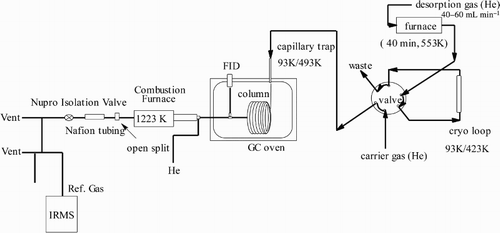
The compound-specific carbon isotope ratio and mixing ratio measurements of aromatic VOCs (benzene, toluene, ethylbenzene, and xylenes) were made using a method derived from the one described by Rudolph, Lowe, Martin, and Clarkson (Citation1997); therefore, the method is only described briefly here. The most important modification was the use of adsorptive sampling instead of the collection of whole air samples in canisters. Adsorptive VOC sampling from volumes of 20–100 L of ambient air was done on adsorbent filled cartridges (Carboxen® 569 from Supelco Inc., Bellefonte, USA) using the following components: a stainless steel inlet line (1/4 in.), a mass flow controller coupled with a flow totalizer, and a pump (). The VOCs were recovered from the cartridges by heating in a temperature-controlled furnace and trapping the desorbed VOCs in a two-step preconcentration system. The recovered VOC samples were separated by gas chromatography (GC). The separated VOCs were oxidized online in a combustion interface and the carbon dioxide formed was analyzed online by isotope ratio mass spectrometry (IRMS) ().
Fig. 2 Setup for VOC collection from ambient air on cartridges.
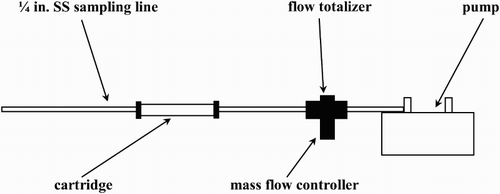
Fig. 3 Instrumental setup for IRMS analysis of ambient VOCs.
Analysis of blank cartridges resulted in small peaks for aromatic VOCs corresponding to masses in the range of 0.2 ng to 0.7 ng. For typical sample volumes this corresponds to approximately 1–5 pptv. Detection limits derived from the variability of the blank values were typically in the range of 3–15 pptv, depending on compound and sample volume. The mass of VOC from desorption of blank cartridges was too low to allow determination of carbon isotope ratios. Therefore, no correction of measured isotope ratios for contribution from blanks could be made. However, with the exception of some of the lowest atmospheric mixing ratios observed, the mass of the blank is very small compared with the sampled mass of VOC. For example the mass of benzene typically sampled on the cartridges (see ) corresponds to 5–15 ng, which exceeds the blank value by an order of magnitude or more. It is, therefore, unlikely that the blank values cause significant bias for the isotope ratio measurements.
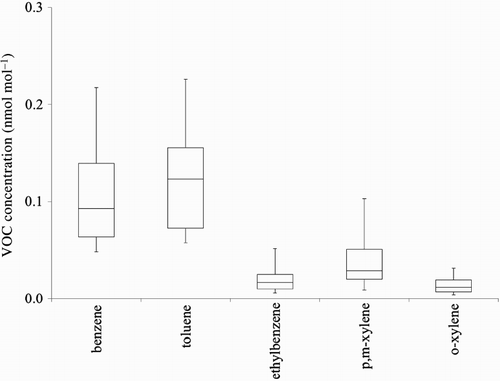
Fig. 4 Box-and-whisker plot representing statistical analysis of concentration values of aromatic VOCs at CARE measured between October 2009 and January 2010. Upper quartile (75%) and lower quartile (25%) are indicated by upper and lower ends of the boxes and medians by vertical bars within the boxes, 10% and 90% by the end points of the vertical lines.
Daily average ozone, NOx, and oxidant ([O3] + [NO2]) mixing ratios were calculated from hourly values measured at CARE measured by Environment Canada.
3 Results and discussion
An overview of VOC mixing ratios at CARE is provided in . The atmospheric VOC mixing ratios cover the range from the low picomole per mole level to a fraction of a nanomole per mole. Although the lower end of these VOC levels is consistent with a rural location, the upper range VOC mixing ratios are similar to VOC levels observed at semi-rural and suburban locations (Jobson et al., Citation2004; Pankow et al., Citation1998; Roberts et al., Citation1984). The substantial range and variability of VOC mixing ratios may be a result of long-range transport from different source areas, differences in VOC loss because of chemical reactions, or the impact of nearby VOC sources such as Barrie, Highway 400, or other major roads ().
The measured isotope ratios of VOCs are summarized in and some examples showing the frequency of observations as a function of isotope ratio are presented in a to 6c.
Fig. 5 Stable carbon isotope ratios for aromatic VOCs. Upper quartile (75%) and lower quartile (25%) are indicated by upper and lower ends of the boxes and medians by vertical bars within the boxes, 10% and 90% by the end points of the vertical lines.
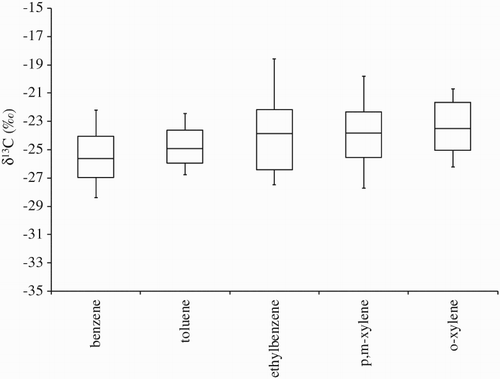
Fig. 6 (a) Frequency distribution of the carbon isotope ratio of benzene at CARE. The downward arrow indicates the isotope ratio of urban benzene sources (Rudolph et al., Citation2002). (b) Frequency distribution of the carbon isotope ratios of toluene at CARE. The downward arrow indicates the isotope ratio of urban toluene sources (Rudolph et al., Citation2002). (c) Frequency distribution of the carbon isotope ratios of p- and m-xylene at CARE. The downward arrow indicates the isotope ratio of urban p- and m-xylene sources (Rudolph et al., Citation2002).
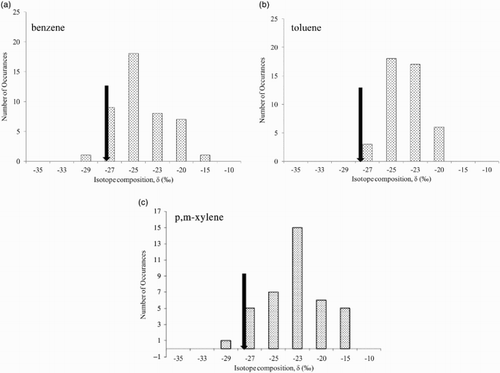
The 13C in the carbon isotope ratios measured in this study are, with very few exceptions, similar to or higher than in typical urban emissions as reported by Rudolph et al. (Citation2002) which is fully consistent with the concept that atmospheric reactions of emitted VOCs result in enrichment of 13C resulting from isotope fractionation during atmospheric removal (Rudolph & Czuba, Citation2000; Rudolph, Czuba, & Huang, Citation2000). On average, the PCAs derived from isotope ratios are approximately 1011 molec s cm−3 (). This corresponds to an exposure of the VOCs to an average of 106 OH radicals per cubic centimetre for more than 24 h. The range covered by the PCAs is very substantial, ranging from values that are, within their uncertainty, effectively zero to 6 × 10¹¹ molec s cm−3. The latter corresponds to atmospheric processing of about one week at an average OH radical concentration of 106 molec cm−3.
Table 1. Mean photochemical ages of aromatic VOCs at CARE in fall 2009 and early winter 2010.
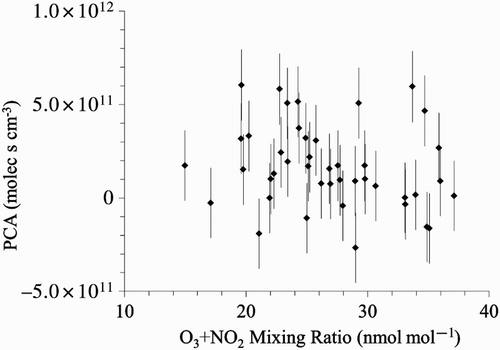
Considering this, it is surprising that there is no dependence between VOC or NOx mixing ratios and oxidant mixing ratios ([O3] + [NO2]). depicts the results for benzene as an example, and the other aromatic VOCs have a very similar behaviour. We use the sum of O3 and NO2 to avoid potential bias from changes of the photostationary state between O3, NO2, and NO. There is also no significant dependence between photochemical processing and oxidant mixing ratio for any of the VOCs studied here. An example is shown in . Although the uncertainty of the individual PCAs is substantial because of uncertainties in isotope ratio measurements, isotope ratio of emissions, and KIE (), the absence of any systematic dependence cannot be explained by this alone.
Fig. 7 Plot of benzene (squares) and NOx (triangles) mixing ratios versus the sum of ozone and nitrogen dioxide mixing ratios.
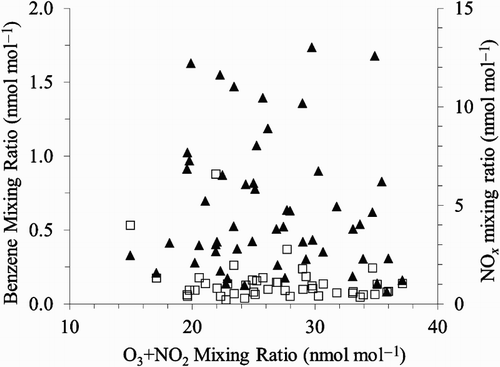
Fig. 8 Plot of PCA derived from benzene isotope ratios versus the sum of ozone and nitrogen dioxide mixing ratios.
Some insight into the reason for this behaviour can be obtained from examining differences in PCA and oxidant mixing ratios for high and low VOC levels. Because of the high variability and uncertainty of PCAs, some averaging is required to avoid bias from uncertainty of individual data points. In the average PCAs and oxidant mixing ratios for ten observations with the highest and lowest benzene mixing ratios are given. The oxidant levels are effectively identical, which is expected from the absence of a systematic dependence between VOC and oxidant mixing ratios. Moreover, the oxidant levels for high and low benzene mixing ratios are also essentially identical to the overall average of 26.4 nmol mol−1. However, the PCAs differ significantly. For the lowest ten benzene mixing ratios the PCA is a factor of 2.5 higher than for the highest ten benzene mixing ratios. This shows that the high VOC levels result from contributions from VOCs that have not been subject to significant processing.
Table 2. Averages of benzene mixing ratios, benzene carbon δ values, PCA of benzene, and sum of O3 + NO2 mixing ratios for the ten lowest and ten highest benzene mixing ratios measured during this campaign at CARE. The values in parentheses are the error of the mean.
The finding that the lower end of measured benzene mixing ratios is compatible with observations at rural sites without impact from local sources (see above) suggests that the average isotope ratio observed for these conditions represents that of a rural VOC background dominated by the impact of long-range transport. Based on the assumption that the high end of measured VOC mixing ratios is predominantly the result of unprocessed emissions into background air with low VOCs we calculate a benzene carbon isotope ratio of −26.4‰ (±1.5‰) for the high benzene levels using a simple isotope ratio mass balance. Within the uncertainties of prediction and observation this is fully compatible with the observations ().
4 Conclusions
Based on carbon isotope ratio measurements it can be concluded that the VOC levels at CARE were determined by mixing freshly emitted, unprocessed VOCs with background air containing low levels of processed VOC. These unprocessed VOCs most likely were emitted from local sources. Therefore, variability in VOC mixing ratios has most likely been dominated by the varying impact of unprocessed VOCs and not by differences in VOC processing. Consequently there is no observable relation between VOC and ozone mixing ratio, and the observed oxidant levels are predominantly the result of long-range transport of highly processed air masses and background ozone levels.
It should be noted that the measurements were made during the months of September to January, which is when relatively slow atmospheric processing can be expected. The situation may be different in midsummer, when faster atmospheric processing can be expected, but presently no isotope ratio measurements at rural locations in summer are available.
The results demonstrate that measurements of the stable carbon isotope ratio of atmospheric VOCs can be used to gain quantitative insight into the extent of their processing and to identify their origin. The PCAs calculated from VOC isotope ratios have substantial uncertainties, partly because of uncertainties in measurements but also because of the limited information available for the isotopic composition of VOC emissions. Further improvements in measurement techniques and more detailed studies of the isotopic composition of VOC sources could substantially reduce these uncertainties.
Acknowledgements
This research was supported financially by the Natural Sciences and Engineering Research Council (NSERC) of Canada and the Canadian Foundation for Climate and Atmospheric Sciences (CFCAS). We would also like to thank Environment Canada's Canadian Air and Precipitation Monitoring Network (CAPMoN) for the NOx and ozone data and Environment Canada and the Environment Canada staff at CARE for technical and logistical support.
References
- Anderson, R., Iannone, R., Thompson, A., Rudolph, J., & Huang, L. (2004a). Carbon kinetic isotope effects in the gas-phase reactions of aromatic hydrocarbons with the OH radical at 296 ± 4 K. Geophysical Research Letters, 31. doi:10.1029/2004GL020089
- Anderson, R., Iannone, R., Thompson, A., Rudolph, J., & Huang, L. (2004b). Carbon kinetic isotope effects in the gas-phase reactions of light alkanes and ethene with the OH radical at 296 ± 4 K. Journal of Physical Chemistry A, 108(52), 11537–11544.
- Atkinson, R. (2000). Atmospheric chemistry of VOCs and NOx. Atmospheric Environment, 34, 2063–2101.
- Atkinson, R., & Arey, J. (2003). Atmospheric degradation of volatile organic compounds. Chemical Reviews, 103, 4605–4638.
- Bloss, C., Wagner, V., Jenkin, M.E., Volkamer, R., Bloss, W.J., Heard, D.E., Wirtz, K., Martin-Reviejo, M., Rea, G., Wenger, J.C., & Pilling, M.J. (2005). Development of a detailed chemical mechanism (MCMv3.1) for the atmospheric oxidation of aromatic hydrocarbons. Atmospheric Chemistry and Physics, 5, 641–644.
- Chameides, W.L., Fehsenfeld, F., Rodgers, M.O., Cardelino, C., Martinez, J., Parrish, D., Lonneman, W., Greenberg, J., Middleton, P., & Wang, T. (1992). Ozone precursor relationships in the ambient atmosphere. Journal of Geophysical Research, 97, 6037–6055.
- Craig, H. (1953). The geochemistry of the stable carbon isotopes. Geochimica et Cosmochimica Acta, 3, 53–92.
- Finlayson-Pitts, B.J., & Pitts, J.N. J. (2000). Chemistry of the upper and lower atmosphere. San Diego: Academic Press.
- Gelencsér, A., Siszler, K., & Hlavay, J. (1997). Toluene–benzene concentration ratio as a tool for characterizing the distance from vehicular emission sources. Environmental Science and Technology, 31(10), 2869–2872.
- Jobson, B.T., Berkowitz, C.M., Kuster, W.C., Goldan, P.D., Williams, E.J., Fesenfeld, F.C., Apel, E.C., Karl, T., Lonneman, W.A., & Riemer, D. (2004). Hydrocarbon source signatures in Houston, Texas: Influence of the petrochemical industry. Journal of Geophysical Research, 109, D24305. doi:10.1029/2004JD004887
- Kaye, J.A. (1987). Mechanisms and observations for isotope fractionation of molecular species in planetary atmospheres. Reviews of Geophysics, 25(8), 1609–1658.
- Kleinman, L.I., Daum, P.H., Lee, L.-N., Nunnermacker, L.J., Springston, S.R., Weinstein-Lloyd, J., Hyde, P., Doskey, P., Rudolph, J., Fast, J., & Berkowitz, C. (2003). Photochemical age determinations in the Phoenix metropolitan area. Journal of Geophysical Research, 108, 4096. doi:10.1029/2002JD002621
- Pankow, J.F., Luo, W., Isabelle, L.M., Bender, D.A., & Baker, R.J. (1998). Determination of a wide range of volatile organic compounds in ambient air using multisorbent adsorption/thermal desorption and gas chromatography/mass spectrometry. Analytical Chemistry, 70(24), 5213–5221.
- Parrish, D.D., Hahn, C.J., Williams, E.J., Norton, R.B., Fehsenfeld, F.C., Singh, H.B., Shetter, J.D., Gandrud, B.W., & Ridley, B.A. (1992). Indications of photochemical histories of Pacific air masses from measurements of atmospheric trace species at Point Arena, California. Journal of Geophysical Research, 97(D14), 15883–15901.
- Roberts, J.M., Fehsenfeld, F.C., Liu, S.C., Bollinger, M.J., Hahn, C., Albritton, D.L., & Sievers, R.E. (1984). Measurements of aromatic hydrocarbon ratios and NOx concentrations in the rural troposphere: Observation of air mass photochemical aging and NOx removal. Atmospheric Environment, 18(11), 2421–2432.
- Rudolph, J. (2007). Gas chromatography-isotope ratio mass spectrometry. In R. Koppmann (Eds.), Volatile organic compounds in the atmosphere (pp. 348–466). Oxford: Blackwell Publishing Ltd.
- Rudolph, J., & Czuba, E. (2000). On the use of isotopic composition measurements of volatile organic compounds to determine the “photochemical age” of an air mass. Geophysical Research Letters, 27(23), 3865–3868.
- Rudolph, J., Czuba, E., & Huang, L. (2000). The stable carbon isotope fractionation for reactions of selected hydrocarbons with OH-radicals and its relevance for atmospheric chemistry. Journal of Geophysical Research, 105(D24), 29329–29346.
- Rudolph, J., Czuba, E., Norman, A.L., Huang, L., & Ernst, E. (2002). Stable carbon isotope composition of nonmethane hydrocarbons in emissions from transportation related sources and atmospheric observations in an urban atmosphere. Atmospheric Environment, 36(7), 1173–1181.
- Rudolph, J., Lowe, D.C., Martin, R.J., & Clarkson, T.S. (1997). A novel method for the compound specific determination of δ13C in volatile organic compounds at ppt levels in ambient air. Geophysical Research Letters, 24(6), 659–662.
- Saunders, S.M., Jenkin, M.E., Derwent, R.G., & Pilling, M.J. (2003). Protocol for the development of the Master Chemical Mechanism, MCM v3 (Part A): Tropspheric degradation of non-aromatic volatile organic compounds. Atmospheric Chemistry and Physics, 3, 161–180.
- Sillman, S. (1999). The relation between ozone, NOx and hydrocarbons in urban and polluted rural environments. Atmospheric Environment, 33, 1821–1845.
- Simpson, I.J., Blake, N.J., Blake, D.R., Atlas, E., Flocke, F., Crawford, J.H., Fuelberg, H.E., Kiley, C.M., Meinardi, S., & Rowland, F.S. (2003). Photochemical production and evolution of selected C2–C5 alkyl nitrates in tropospheric air influenced by Asian outflow. Journal of Geophysical Research, 108, 8808. doi:10.1029/2002JD002830