
Abstract
Regular ground-based measurements of total ozone are available over the full Russian territory using M-124 filter ozonometers, Brewer spectrophotometers, and Système d'Analyse par Observation Zénithale (SAOZ) spectrometers in the Arctic region where these observations are essential for evaluating ozone loss in winter. Daily measurements are performed by three Brewer spectrophotometers; these are located in Kislovodsk (43.7°N, 42.7°E), Obninsk (55.1°N, 36.6°E), and Tomsk (56.5°N, 85.1°E). Two SAOZ spectrometers are deployed at the Arctic Circle in Salekhard (66.5°N, 66.7°E) and Zhigansk (66.8°N, 123.4°E). In addition, regular winter–spring ozonesonde soundings are carried out in Salekhard. Altogether, they have provided the unique measurements over the eastern Arctic required for characterizing ozone loss during each winter and will also monitor the anticipated ozone recovery following the reduction of chlorine and bromine ozone-depleting substances in the atmosphere.
Résumé
[Traduit par la rédaction] Des mesures de l’épaisseur totale de la colonne d'ozone faites régulièrement depuis le sol sont disponibles pour l'ensemble du territoire russe avec des ozonomètres à filtre M-124 et des spectrophotomètres Brewer ainsi que des spectromètres SAOZ (Système d'analyse par observation zénithale) dans la région arctique, où elles sont essentielles pour évaluer la perte d'ozone en hiver. Trois spectrophotomètres Brewer prennent des mesures quotidiennement; ils sont situés à Kislovodsk (43,7°N, 42,7°E), Obninsk (55,1°N, 36,6°E) et à Tomsk (56,5°N, 85,1°E). Deux spectromètres SAOZ sont déployés sur le cercle arctique à Salekhard (66,5°N, 66,7°E) et à Zhigansk (66,8°N, 123,4°E). De plus, des sondages par ozonosondes sont régulièrement effectués en hiver et au printemps à Salekhard. Tous ensemble, ces instruments ont fourni pour l'est de l'Arctique des mesures uniques nécessaires pour étudier la perte d'ozone durant chaque hiver et ils surveilleront aussi le rétablissement attendu de la couche d'ozone par suite de la réduction des substances chlorées et bromées dans l'atmosphère qui détruisent la couche d'ozone.
1 Introduction
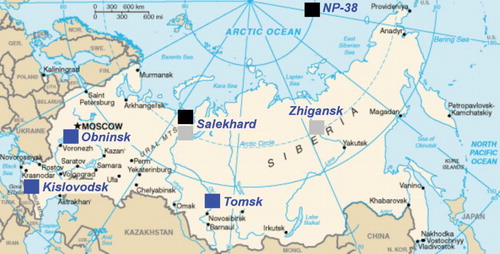
Stratospheric ozone over the Arctic has a large interannual variability in winter and early spring. This variability depends on the extent of chemical depletion, varying from a small ozone loss in the Arctic during years with early stratospheric warming, as in 1999, 2002, and 2004, to about 40% in 2011 when the vortex remained strong and cold until late March (Bazhenov & Burlakov, Citation2011; Dorokhov, Citation1990; Dorokhov & Potopova, Citation1995; Goutail, Pommereau, Sarkissian, Kyro, & Dorokhov, Citation1994; Goutail et al., Citation2005; Ivlev, Belan, Dorokhov, & Tereb, Citation2013; Kerr, McElroy, Wardle, & Dorokhov, Citation1990; Manney et al., Citation2011; Pommereau & Goutail, Citation1988; Pommereau et al., Citation2013; Rex et al., Citation1997; Tsvetkova, Yushkov, Lukyanov, Dorokhov, & Nakane, Citation2007). Because almost half the Arctic region is in Russian territory, it is essential that ozone observations continue in order to evaluate the annual extent of ozone depletion and assess the predicted recovery of the ozone layer. This recovery is expected to take place over the coming decades following a reduction in ozone-depleting substances, such as chlorine and bromine, and a progressive warming of the stratosphere (WMO, Citation2011). shows the location of the Brewer, Système d'Analyse par Observation Zénithale (SAOZ), and ozonesonde stations in Russia. The aim of this paper is to describe the measurements from these instruments and present some results, including an assessment of the quality of the measurements.
Fig. 1 Locations of the Brewer (blue), SAOZ (grey), and ozonesonde (black) stations in Russia.
2 Brewer spectrophotometer
Three Brewer spectrophotometers with different serial numbers (S/N) are currently operational in Russia: the Brewer MKII S/N 043 at the high altitude (2070 metres above sea level) Kislovodsk High Mountain Station of the A.M. Obukhov Institute of Atmospheric Physics, Russian Academy of Sciences in the Northern Caucasus since 1988; the Brewer MKII S/N 044 at the Institute of Experimental Meteorology in Obninsk near Moscow since 1988; and the Brewer MKIV S/N 049 in Tomsk in central Siberia since 2003. The instruments were calibrated in 2003, 2005, and 2008 by comparing them with the travelling reference Brewer MKII S/N 017. All the Russian instruments were calibrated again in September 2012 by International Ozone Services Inc. (IOS) in Obninsk using the travelling standard instrument. shows the time series of observed total column ozone from the Brewer MKIV S/N 049 spectrophotometer in Tomsk and the Brewer MKII S/N 044 spectrophotometer in Obninsk from 2003 to 2012. shows an example of the total column ozone measurement from Obninsk (55.1°N, 36.6°E) and Tomsk (56.5°N, 85.1°E) for 2011.
Fig. 2 Total ozone measured by (a) the Brewer MKII S/N 044 in Obninsk and (b) the Brewer MKIV S/N 049 in Tomsk from 2003 to 2012. (1 DU = 0.01 mm at standard temperature and pressure and is equivalent to 2.69 × 10²⁰ molecules per square metre.)
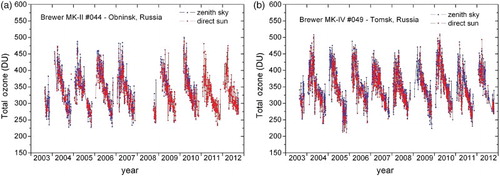
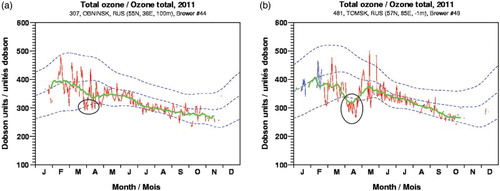
Fig. 3 Total ozone measured by (a) the Brewer MKII S/N 044 in Obninsk and (b) the Brewer MKIV S/N 049 in Tomsk in 2011. A dip can be observed in the Tomsk data in early April 2011 when the ozone-depleted vortex moved towards central Siberia. The initial plots of the total ozone deviation are from EC (Citation2013). The green line shows the monthly averaged mean values of total ozone in Obninsk and Tomsk in 2011. The blue dotted lines show ±2 sigma standard deviation from the climatic mean. The black ovals show the time period of unusually low total ozone in Obninsk and Tomsk in spring 2011.
3 SAOZ ultraviolet-visible (UV-Vis) spectrometer
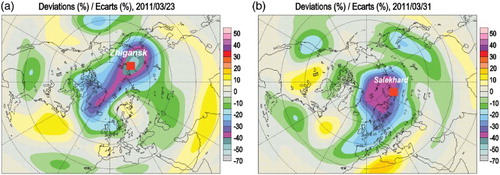
In collaboration with the French Centre national de la recherche scientifique (CNRS), within the framework of the Network for the Detection of Atmospheric Composition Change (NDACC), Russia has operated two SAOZ instruments within the polar circle allowing year-round observations to be made: Zhigansk in eastern Siberia, operational since 1991, and Salekhard in western Siberia, operational since 1998. shows the ozone and NO2 measured by the SAOZ ultraviolet-visible (UV-Vis) spectrometers. These instruments cover the polar region in the northern hemisphere, monitoring the degree of ozone destruction in the Arctic each year. These instruments contributed significantly to the quantification of the unprecedented Arctic ozone loss in 2011 caused by a long-lasting, denoxified vortex which resulted in a daily loss rate never before seen in the Arctic (Pommereau et al., Citation2013). shows the ozone-depleted, polar vortex which passed over Salekhard and Zhigansk stations from late March to early April 2011; losses of about 40% were observed at these stations.
Fig. 4 Total ozone and NO2 at (a) Zhigansk station from 1991 to 2011 and (b) Salekhard station from 2001 to 2011. The blue curve shows the measurements taken at sunrise and the red curve those taken at sunset.
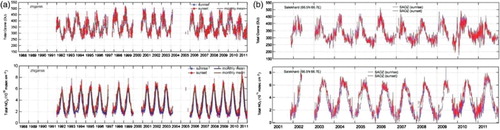
Fig. 5 WOUDC total ozone mapping on 23 and 31 March 2011 when the low ozone vortex passed over (a) Zhigansk and (b) Salekhard. The initial plots of the total ozone deviation are from EC (2013).
4 ECC ozonesonde
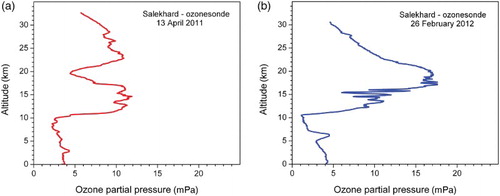
Ozonesonde measurements were first made in Russia at Heiss Island in Franz Josef Land in the central Arctic Ocean from 1989 to 1992 as part of a joint project between the Central Aerological Observatory (CAO) and the University of Wyoming. The ozonesonde flights were later continued in Yakutsk (62.0°N, 129.7°E) from December 1994 until 2006 and in Salekhard from January 1997 until the present. Salekhard (66.5°N, 66.7°E) is the only location where ozonesonde flights are currently launched in Russia. In Yakutsk, ozonesonde launches were carried out from 1994 to 2002 within the framework of a collaborative project between the National Institute for Environmental Studies (NIES), Japan and CAO, Russia. From 2003 to 2005 the launches continued within the framework of the Quantitative Understanding of Ozone losses by Bipolar Investigations (QUOBI) project. A total of 150 ozonesondes were launched at the Yakutsk aerological station in eastern Siberia during the winter–spring seasons of 1994 to 2006; 250 ozonesondes, model 2Z-ECC, were launched at Salekhard aerological station in western Siberia from 1997 to 2012 to measure vertical ozone profiles. The only sounding stations currently operational in Russia are Salekhard and the North Pole drifting station (in 2011 this was NP-38); results from several ascents from Salekhard aerological station in the winter–spring period of 2011 are shown in . These ascents took place during the depleted polar vortex conditions of March–April 2011 to February 2012. The ozone sounding data from Salekhard aerological station and station NP-38 were used by Manney et al. (Citation2011) to study the record ozone loss during that period, demonstrating that unusually long-lasting cold conditions in the lower stratosphere lead to persistent enhancement of ozone-destroying forms of chlorine and consequently to unprecedented ozone loss.
Fig. 6 Ozone profiles from 2Z-ECC sonde launched at Salekhard in the polar vortex in (a) April 2011 and (b) February 2012.
5 Conclusions
The results of ground-based total ozone monitoring over Russia using three well-maintained Brewer spectrophotometers and two SAOZ UV-Vis spectrometers deployed along the Arctic polar circle have been presented. Combined with high-latitude ozone soundings, they allow measurements of the long-term evolution of stratospheric ozone, as well as the episodic depletion in the Arctic such as the severe Arctic ozone depletion during the winter and spring of 2011. The data for the Brewer spectrophotometers are available in EC (Citation2011); for the SAOZ spectrometers in SAOZ (Citation2011) and NOAA (Citation2011), and for the Salekhard ozonesonde flights in NOAA-CPC (Citation2011).
Acknowledgements
The authors thank Tatyana Popova and Vladimir Balashov from the Salekhard aerological station who operated the SAOZ spectrometer and ozonesonde launches from 1997 to 2012, Vasily Lyulkin from the Zhigansk aerological station who operated the SAOZ V-1024, and the staff of Droplet Measurement Technologies, Boulder, Colorado, USA for discussions and help with operating the new ECC ozonesonde 2Z-V7. This work was partly supported by the Centre national d'études spatiales (CNES) and CNRS/INSU within the NDACC programme; the Federal Service for Hydrometeorology and Environmental Monitoring (Roshydromet), Russia; NIES, Japan; the Alfred Wegener Institute for Polar and Marine Research, Research Unit Potsdam, Potsdam, Germany; and the Central Aerological Observatory in Dolgoprudny near Moscow. We would like to acknowledge the World Ozone and Ultraviolet Radiation Data Centre (WOUDC) for the distribution of the Brewer spectrophotometer total column ozone data; the NDACC for the distribution of the SAOZ total ozone and nitrogen dioxide datasets and the Salekhard ozone profile data.
References
- Bazhenov, O.E., & Burlakov, V.D. (2011). Anomalous decrease of the level of the total ozone content over Tomsk and northern territory of Russia in March–April 2011. Atmospheric and Oceanic Optics, 24(10), 915–919.
- Dorokhov, V.M. (1990). Observations of the total ozone content in the Arctic over Heiss Island (81°N) in winter 1989. Atmospheric and Oceanic Optics, 3(01), 89–94.
- Dorokhov, V.M., & Potapova, T.E. (1995). Observation of total content of atmospheric ozone in high Arctic latitudes. Atmospheric and Oceanic Optics, 8(06), 868–874.
- EC (Environment Canada). (2011). Brewer Data Management System (BDMS) [Data]. Meteorological Service of Canada-World Ozone and Ultraviolet Data Centre. Retrieved from http://www.woudc.org/bdms/index_e.html
- EC (Environment Canada). (2013). World Ozone and Ultraviolet Radiation Data Centre (WOUDC). Retrieved from http://www.woudc.org/
- Goutail, F., Pommereau, J.-P., Lefèvre, F., van Roozendael, M., Andersen, S.B., Kåstad Høiskar, B.-A., Dorokhov, V., Kyrö, E., Chipperfield, M.P., & Feng, W. (2005). Early unusual ozone loss during the Arctic winter 2002/2003 compared to other winters. Atmospheric Chemistry and Physics, 5, 665–677. doi:10.5194/acp-5-665-2005
- Goutail, F., Pommereau, J.-P., Sarkissian, A., Kyro, E., & Dorokhov, V. (1994). Total nitrogen dioxide at the Arctic polar circle since 1990. Geophysical Research Letters, 21(13), 1371–1374. doi:10.1029/93GL01783
- Ivlev, G.A., Belan, B.D., Dorokhov, V.M., & Tereb, N.V. (2013). Spectral observations of the total ozone content variation in Obninsk and Tomsk in 2011 and 2012. Atmospheric and Oceanic Optics, 26(04), 325–331.
- Kerr, J.B., McElroy, C.T., Wardle, D.I., & Dorokhov, V. (1990). Measurements of Arctic total ozone during the polar winter. Atmosphere-Ocean, 28(4), 383–392. doi:10.1080/07055900.1990.9649384
- Manney, G.L., Santee, M.L., Rex, M., Livesey, N.J., Pitts, M.C., Veefkind, P., Nash, E.R., Wohltmann, I., Lehmann, R., Froidevaux, L., Poole, L.R., Schoeberl, M.R., Haffner, D.P., Davies, J., Dorokhov, V., Gernandt, H., Johnson, B., Kivi, R., Kyro, E., Larsen, N., Levelt, P.F., Makshtas, A., McElroy, C.T., Nakajima, H., Parrondo, M.C., Tarasick, D.W., von der Gathen, P., Walker, K.A., & Zinoviev, N.S. (2011). Unprecedented Arctic ozone loss in 2011. Nature, 478, 469–475. doi:10.1038/nature10556
- NOAA (National Oceanic and Atmospheric Administration). (2011). Network for the Detection of Atmospheric Composition Change (NDACC) [Data]. Retrieved from http://www.ndsc.ncep.noaa.gov
- NOAA-CPC (NOAA-Climate Prediction Centre). (2011). Salekhard ozonesonde data. Retrieved from ftp://ftp.cpc.ncep.noaa.gov/ndacc/station/salekhar/ames/o3sonde
- Pommereau, J.P., & Goutail, F. (1988). O3 and NO2 ground-based measurements by visible spectrometry during Arctic winter and spring 1988. Geophysical Research Letters, 891–894. doi:10.1029/GL015i008p00891
- Pommereau, J.-P., Goutail, F., Lefèvre, F., Pazmino, A., Adams, C., Dorokhov, V., Eriksen, P., Kivi, R., Stebel, K., Zhao, X., & van Roozendael, M. (2013). Why unprecedented ozone loss in the Arctic in 2011? Is it related to climate change?. Atmospheric Chemistry and Physics, 13, 5299–5308. doi:10.5194/acp-13-5299-2013
- Rex, M., Harris, N. R. P., von der Gathen, P., Lehmann, R., Braathen, G.O., Reimer, E., Beck, A., Chipperfield, M.P., Alfier, R., Allaart, M., O'Connor, F., Dier, H., Dorokhov, V., Fast, H., Gil, M., Kyrö, E., Litynska, Z., Mikkelsen, I.S., Molyneux, M.G., Nakane, H., Notholt, J., Rummukainen, M., Viatte, P., & Wenger, J. (1997). Prolonged stratospheric ozone loss in the 1995–96 Arctic winter. Nature, 389, 835–838. doi:10.1038/39849
- Systeme d'Analyse Par Observation Zenithale (SAOZ). (2011). Real time data [Data]. Retrieved from http://saoz.obs.uvsq.fr/SAOZ-RT.html
- Tsvetkova, N.D., Yushkov, V.A., Lukyanov, A.N., Dorokhov, V.M., & Nakane, H. (2007). Record-breaking chemical destruction of ozone in the Arctic during the winter of 2004/2005. Izvestiya, Atmospheric and Oceanic Physics, 43(5), 592–598. doi:10.1134/S0001433807050076
- WMO (World Meteorological Organization). (2011). Scientific assessment of ozone depletion: 2010, Global Ozone Research and Monitoring Project-Report No. 52, Geneva, Switzerland.